

Keep tabs on all the latest polling, articles and information ahead of the 2021 Scottish Parliament election in the Ballot Box Scotland Holyrood Hub!
Following on from yesterday’s look at the year’s council by-elections, let’s take a look at how Parliamentary polling has been going. Last year’s review for this side of things was quite exciting as we’d had two Parliamentary elections – the EU in May, and UK in December. This year would have been quieter on that front even without a global pandemic to contend with, but we did still have lots of juicy polling to tide us over until May’s election.
Regional Vote
2020 has been a good year for Scottish Parliament polling, as ComRes and Ipsos MORI have joined Panelbase, Survation and YouGov as regulars. Given the election is next year, it’s perhaps not surprising we’re seeing more polls from more sources, which is welcome from the point of view of this nerd. Now that I’ve learned how to do nice charts, let’s first take a look at how polling has shifted over the year per the (arbitrary) last five polls measure:
Over the course of the year, the SNP have seen their share go up substantially, whilst a decline for the Conservatives and very mild recovery for Labour has narrowed the gap between them by about 2%. Both of the major opposition parties have hit their lowest point since 2016 in this year, 19% in November for the Conservatives, and 14% in June for Labour.
The Lib Dems and Greens have also traded places, reverting to the 2016 status quo of the Greens placing ahead. They even very briefly hit double figures thanks to a bunch of well-timed 10-11% polls, though they’ve dipped a little since. Although Lib Dem polling is the lowest it’s been since BBS started, they did at least avoid hitting a record low.
I reckon that the Lib Dem losses over the year are simply that Brexit just isn’t a major dividing line anymore. The UK left the EU on the 31st of January, and the defining issue this year has of course been the pandemic. That probably also explains why the Brexit Party and UKIP basically don’t register in polling anymore. And remember that SSP figure are always entirely down to YouGov’s uniquely odd habit of showing them on relative highs.
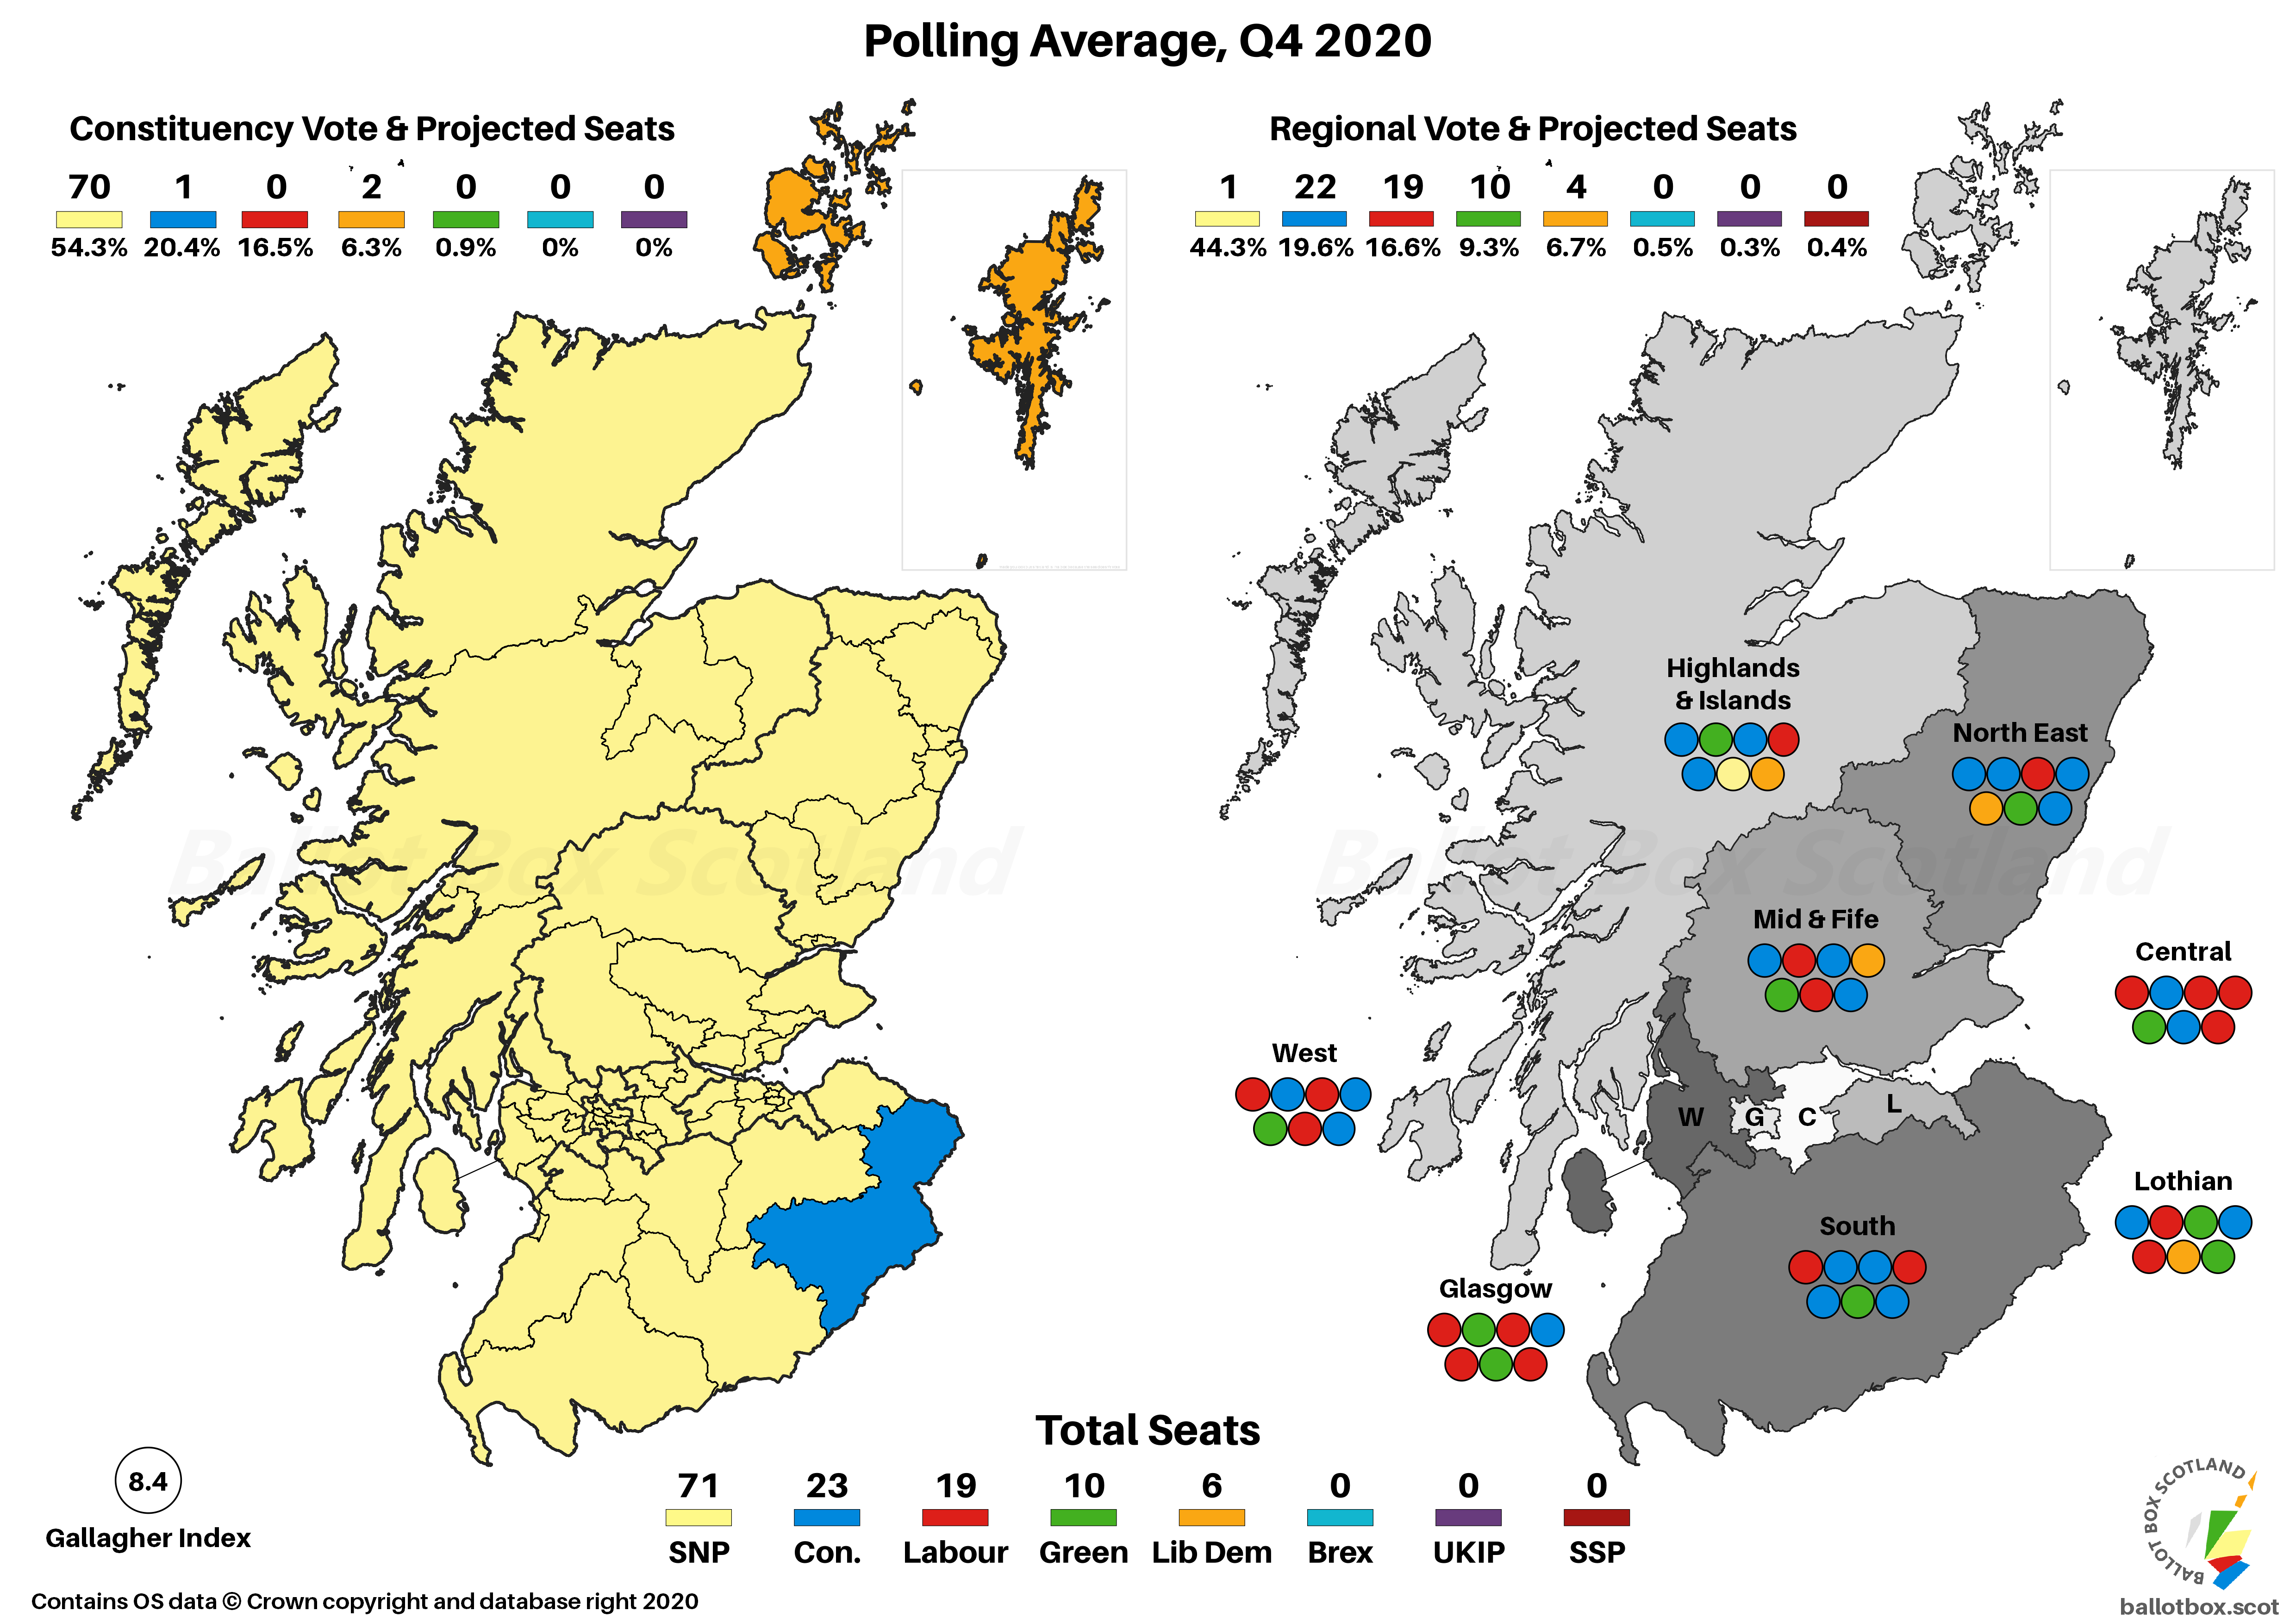
For the purposes of projection, we can look at polling across the last quarter of the year. This is how I’ve done previous reviews, and this year we had a very neat eight polls from five agencies. That’s substantially better than just three from two in Q4 2019! (changes are vs Q4 2019 / vs 2016):
SNP - 44.3% (+6.3 / +2.6)
Conservative - 19.6% (-4.1 / -3.3)
Labour - 16.6% (+0.3 / -2.5)
Green - 9.3% (+2.6 / +2.7)
Liberal Democrat - 6.7% (-3.3 / +1.5)
Brexit - 0.5% (-2.5 / +0.5)
SSP - 0.4% (-0.6 / -0.1)
UKIP - 0.3% (nc / -1.7)
Constituency Vote
Doing the same for the Constituency vote, starting with how the five-poll average shifted over the year:
As you’d expect, the dynamics here are broadly similar as on the list vote, with big gains for the SNP, a narrowed Conservative-Labour gap as the former have lost more ground, and a post-Brexit slump for the Lib Dems. All three of the Pro-Union parties hit lows for this term this year, 20% for the Conservatives in November, 14.2% for Labour in April and June, and 5.8% for the Lib Dems in August and December.
The Greens never score particularly highly on the Constituency side of things, but with two new pollsters who don’t specifically prompt for them for this vote, their share looks even lower. Even fewer pollsters ask about Brexit, or find them with much support at all if they do.
Looking more broadly across the whole quarter we see the following (changes are vs Q4 2019 / vs 2016):
SNP - 54.3% (+10.6 / +7.6)
Conservative - 20.4% (-3.9 / -1.6)
Labour - 16.5% (-0.2 / -6.1)
Liberal Democrat - 6.3% (-3.7 / -1.5)
Green - 0.9% (-1.1 / +0.3)
Seat Projection
Please see this page for how projections work and important caveats.
Seat projections also get the same last five poll treatment as the votes, though it’s important to note this average is of seat projections from individual polls, an individual seat projection for the average of polls… if that makes sense!
As the voting system is partly proportional, obviously the polling figures above lead to similar dynamics in terms of seats. The SNP are now averaging a very health majority, easily their best figures since 2016. Apart from the Greens who have avoided either extreme, the other parties all hit lows of the term at some point this year. That was 22.6 for the Conservatives in November, 17 for Labour in July, and 5 for the Lib Dems in December, which is a joint low with March 2017.
As with last year, we can use the quarterly polling average to run a projection (changes are vs Q4 2019 / vs 2016):
SNP - 71 (+9 / +8)
Conservative - 23 (-9 / -8)
Labour - 19 (-1 / -5)
Green - 10 (+6 / +4)
Liberal Democrat - 6 (-5 / +1)
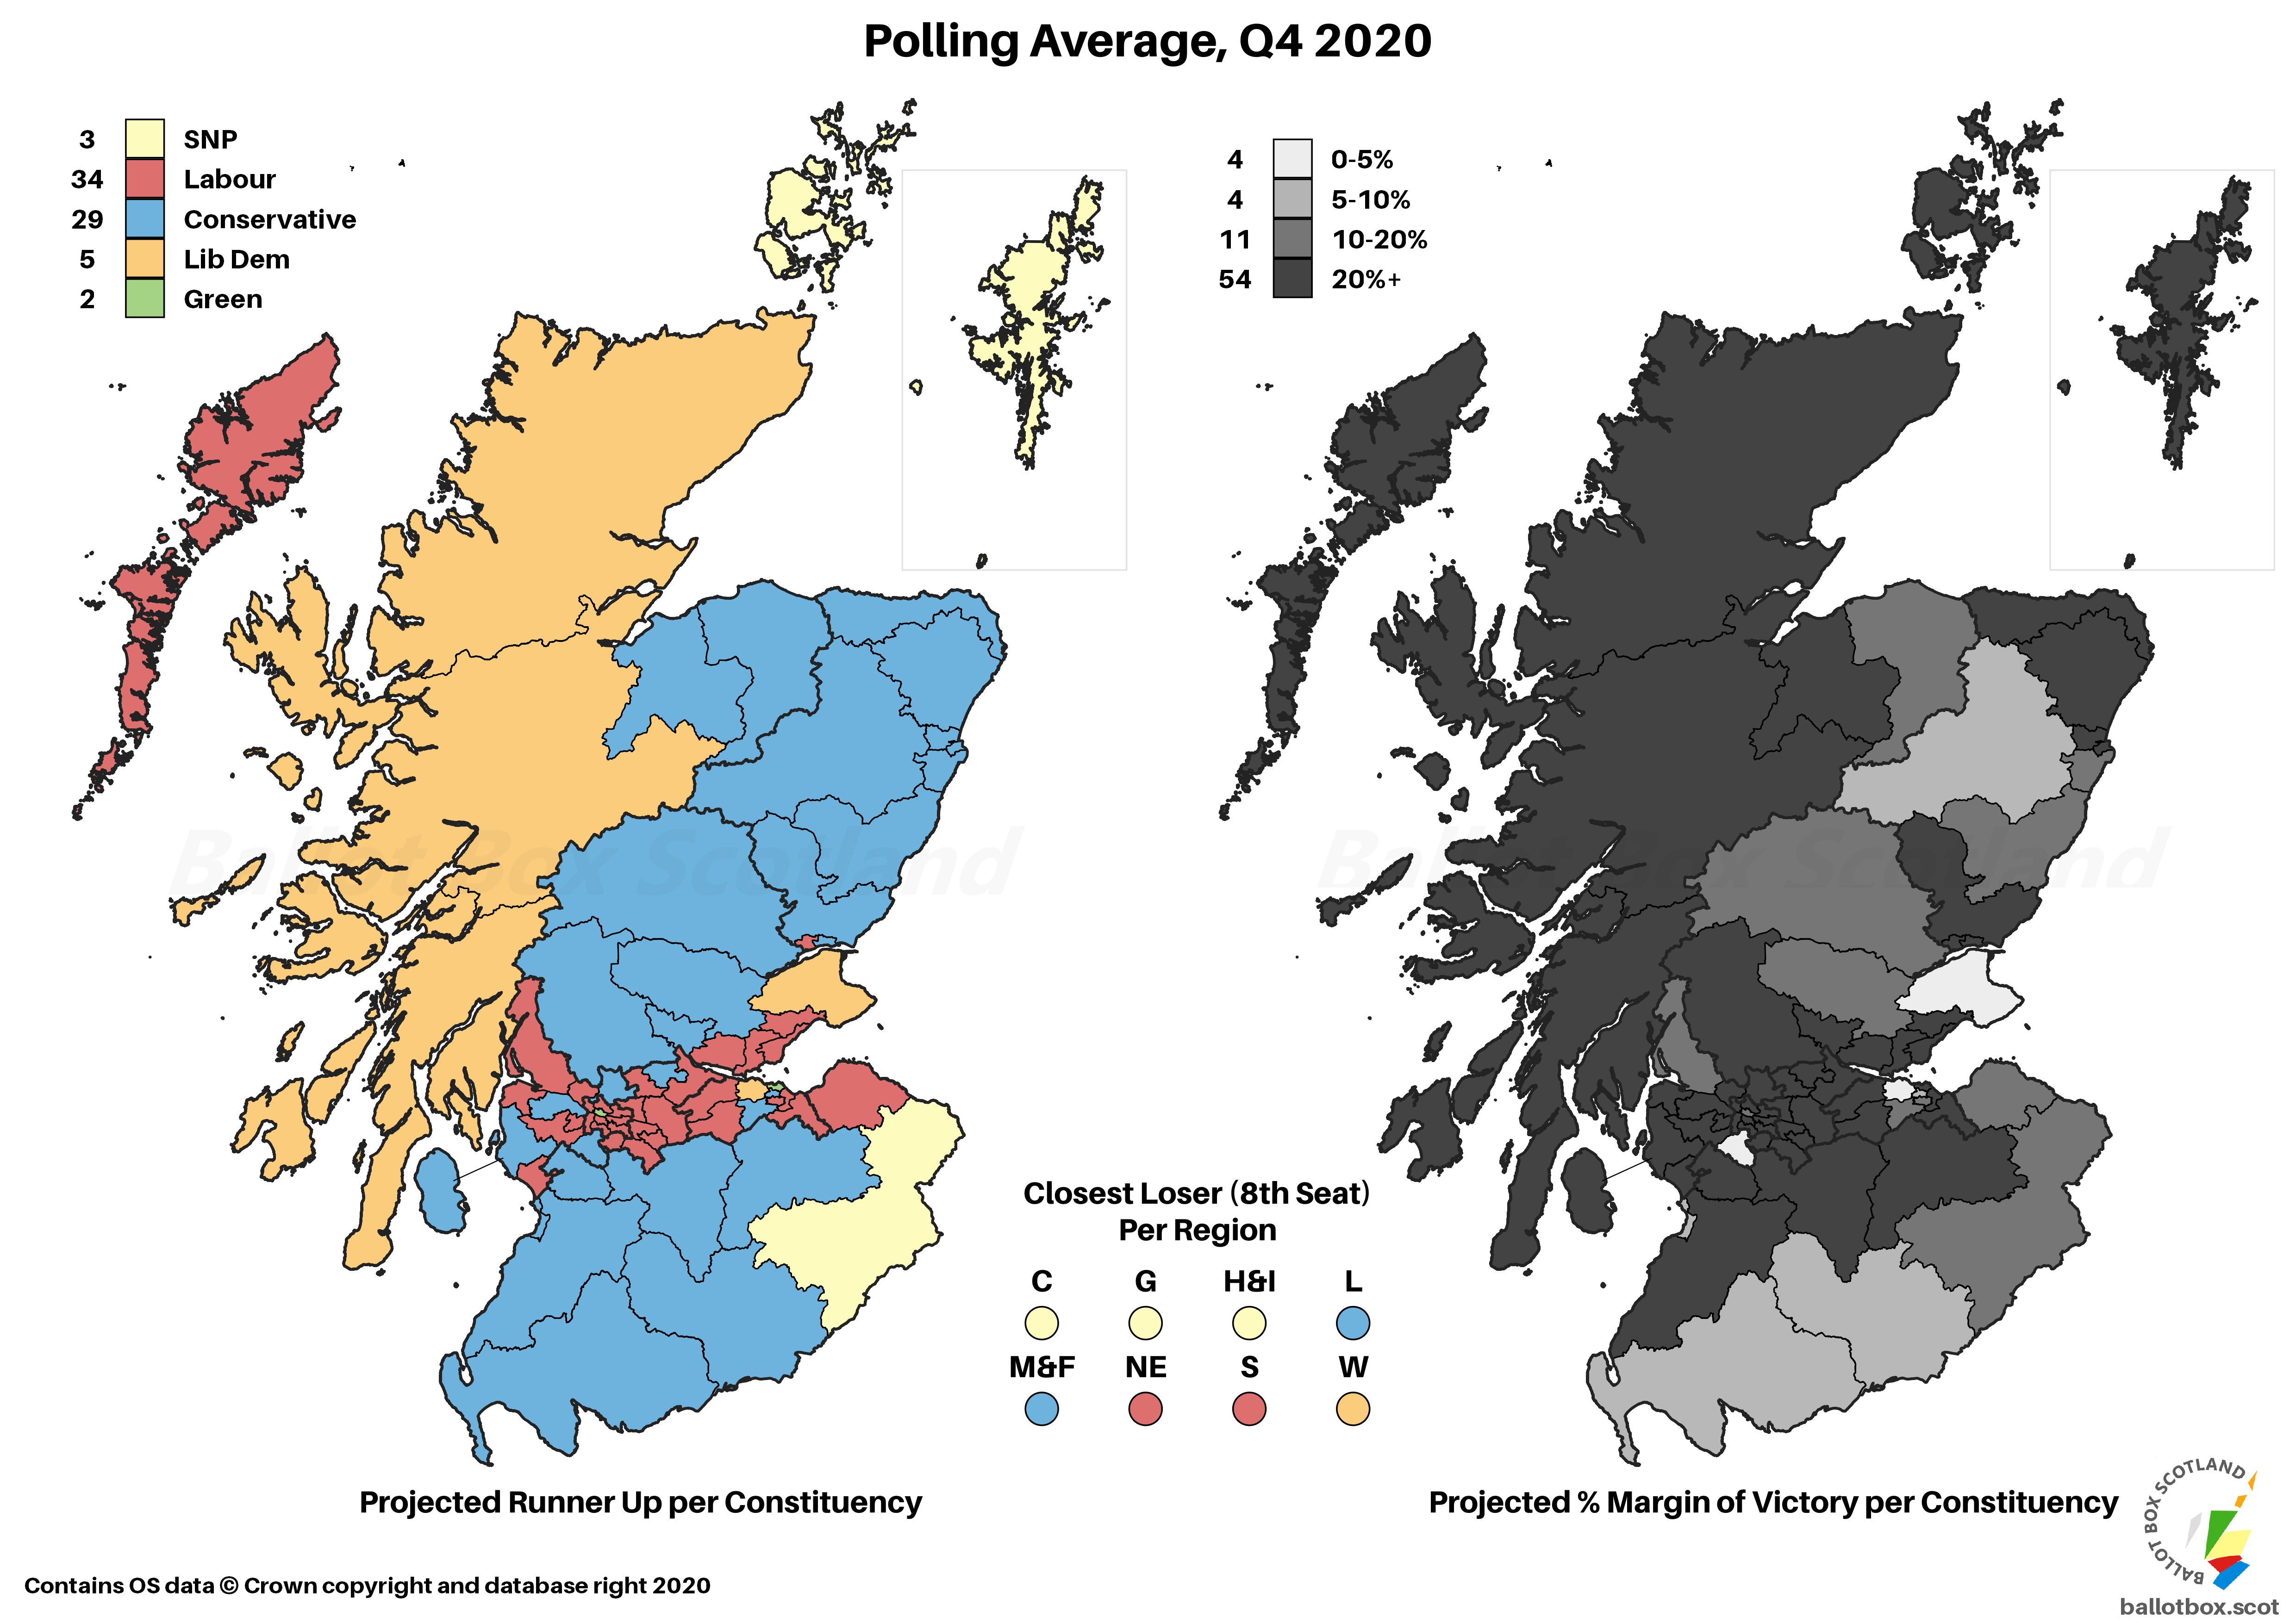
As you’d expect from all of the above, this projects out to a much happier picture for the SNP and Greens than it does for Conservatives, Labour and Lib Dems. The usual note about overhang applies here, and a more proportional system would be less dramatic, but we are where we are – and as this is a year in review, I’ll refrain from doing my usual hypotheticals to show where we could be with an even fairer system!
We can also do all of the same stuff for Westminster polling, though given the last election was December 2019, a 5-poll average doesn’t actually kick in until July. We also have more limited data here, as neither of the two new pollsters have asked a Westminster question.
That makes the chart look very boring for the SNP and Lib Dems who show a relatively even performance over the year. However, that represents a substantial increase for the SNP versus the election, and a decrease for the Lib Dems. By contrast, there appears to be more movement for the Conservatives and Labour, with Labour actually even appearing to leapfrog the Conservatives into second place.
Bear in mind though that since there are fewer sources of data here, the uniquely favourable to Labour polls from Survation have more weight than they did for the Holyrood averages. As ever I am at pains to add their being different doesn’t mean Survation are wrong – they could instead be the ones getting it right – but we won’t know that until the next election, and until then it’s a distinction worth being aware of.
Anyway, looking at the quarterly average as we did for Holyrood, we have four polls from three agencies (changes are vs GE 2019 / vs 2016):
SNP - 51.5% (+6.5)
Conservative- 19.5% (-5.6)
Labour - 19.5% (+0.9)
Liberal Democrat- 5.8% (-3.7)
Green - 1.3% (+0.3)
Brexit - 0.8% (+0.3)
Though I don’t do Westminster projections because pure First Past the Post is awful, I’ve quickly used Electoral Calculus to do one. They reckon it’d be an almost clean SNP sweep of 58 seats, with only Labour’s Ian Murray holding onto his. You’d hope that with this kind of polling constantly coming up at the moment there’s a bit of rumbling inside both the Conservatives and Labour in favour of proportional representation, but…
Anyway, that’s us for the Parliamentary polling stuff from 2020! However, I’ll be doing a third piece on Independence, due sometime between Christmas and New Year. I haven’t tended to look back over that in previous years, but 2020 has seen a big shift on that front that’s worth a quick run through.
If you find this or other Ballot Box Scotland output useful and/or interesting, and you can afford to do so, please consider donating to support my work. I love doing this, but it’s a one-man project and takes a lot of time and effort. All donations, no matter how small, are greatly appreciated and extremely helpful.
(About Donations)


