
Background
The other half of last Thursday’s bumper crop of by-elections took place in Argyll & Bute, both very sadly due to the passing of sitting councillors. Helensburgh and Lomond South was to replace a Lib Dem councillor, and based on 2017 results I thought it was highly likely to go Conservative.
Not so very far up the Clyde, the Isle of Bute was voting following an Independent vacancy. Things are always messier when there are Independents involved, and this ward had elected two such councillors in 2017, whilst also seeing strong SNP and Conservative results. I had genuinely no idea which way it was going to go, so let’s start there…
First Preferences - Isle of Bute
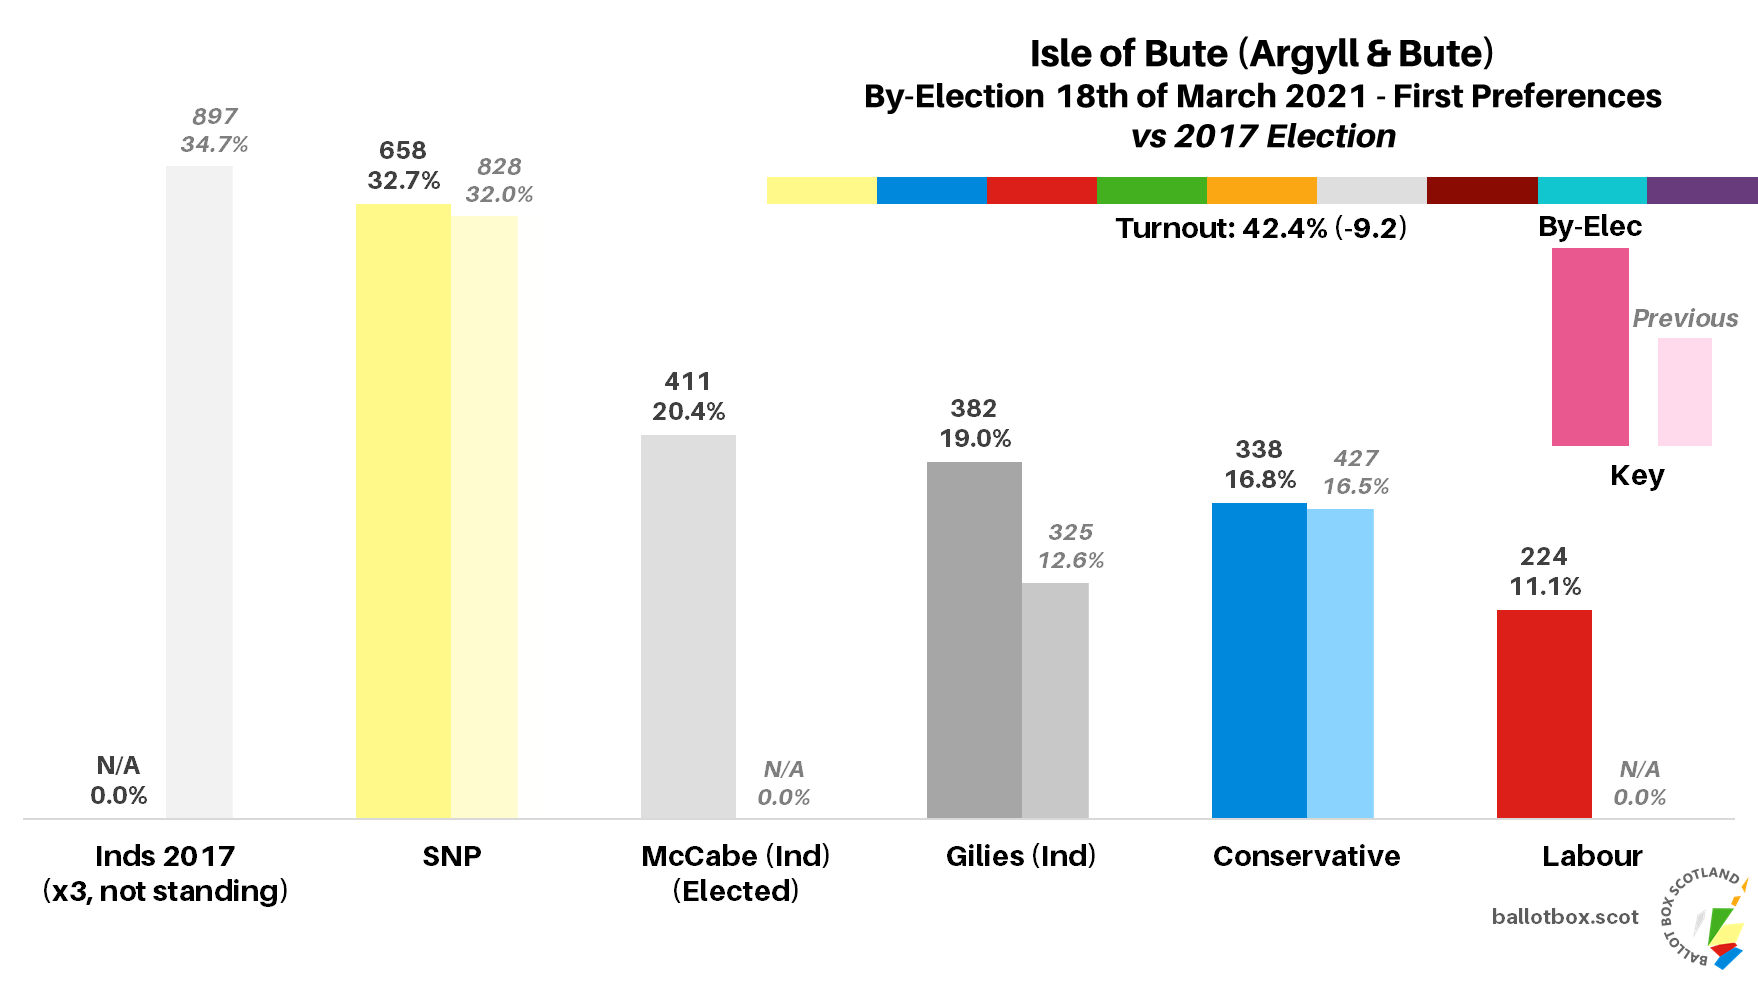
Looking just at first preferences, the SNP came out with a pretty clear lead over any other candidate here. And yet, for the second results post in a row, I need to say we all know that’s not the end of the story with votes to transfer. First preferences in full were (changes versus 2017 election):
SNP - 658 (32.7%, +0.7)
McCabe (Independent) - 411 (20.4%, +20.4)
Gillies (Independent) - 382 (19.0%, +6.4)
Conservative - 338 (16.8%, +0.3)
Labour - 224 (11.1%, +11.1)
Note that in the 2017 election the combined total for three Independent candidates not standing this time was 34.7%.
With over a third of the vote going spare compared to last time, everyone benefitted. The SNP and Conservatives did so the least, gaining less than 1% of the vote on their previous result. Gillies, a previous Independent councillor, added a respectable amount to his vote but was pipped to second place by newcomer Liz McCabe.
For Labour it’s hard to say what this performance means for them, and whether it was related to the candidate. Back in 2012 they did stand here and won 15%, but in 2007 they got 7%, so this result is slap-bang in the middle of those two. It’s probably relatively solid for an island at this point in time, even one not far from the central belt with a (relatively) big town on it.
Transfers - Isle of Bute
As no candidate had an outright majority of the vote, transfer rounds were necessary. The quota to reach here was 1007 votes.
Looking now at the transfers for the final head-to-head at stage 4 (changes vs final head-to-head stage in 2017 election re-calculation):
McCabe (Independent) - 772 (38.4%)
SNP - 767 (38.1%)
Didn't Transfer - 505 (23.5%)
Some truly spectacular STV action here from a nerd perspective, as over the course of the count McCabe ate away at the SNP lead to place just 5 votes ahead of them at the final stage. That is what is known in formal Scottish parlance as a bawhair.
You’ve got to feel a bit of sympathy for Gillies who just cannot seem to get back onto the council, dropping out with just 25 votes behind McCabe in stage 3. If he had closed that gap however, he still may not have won, as he places 39 votes behind the SNP if we re-work transfers to an SNP-Gillies head-to-head.
Detailed Data - Isle of Bute
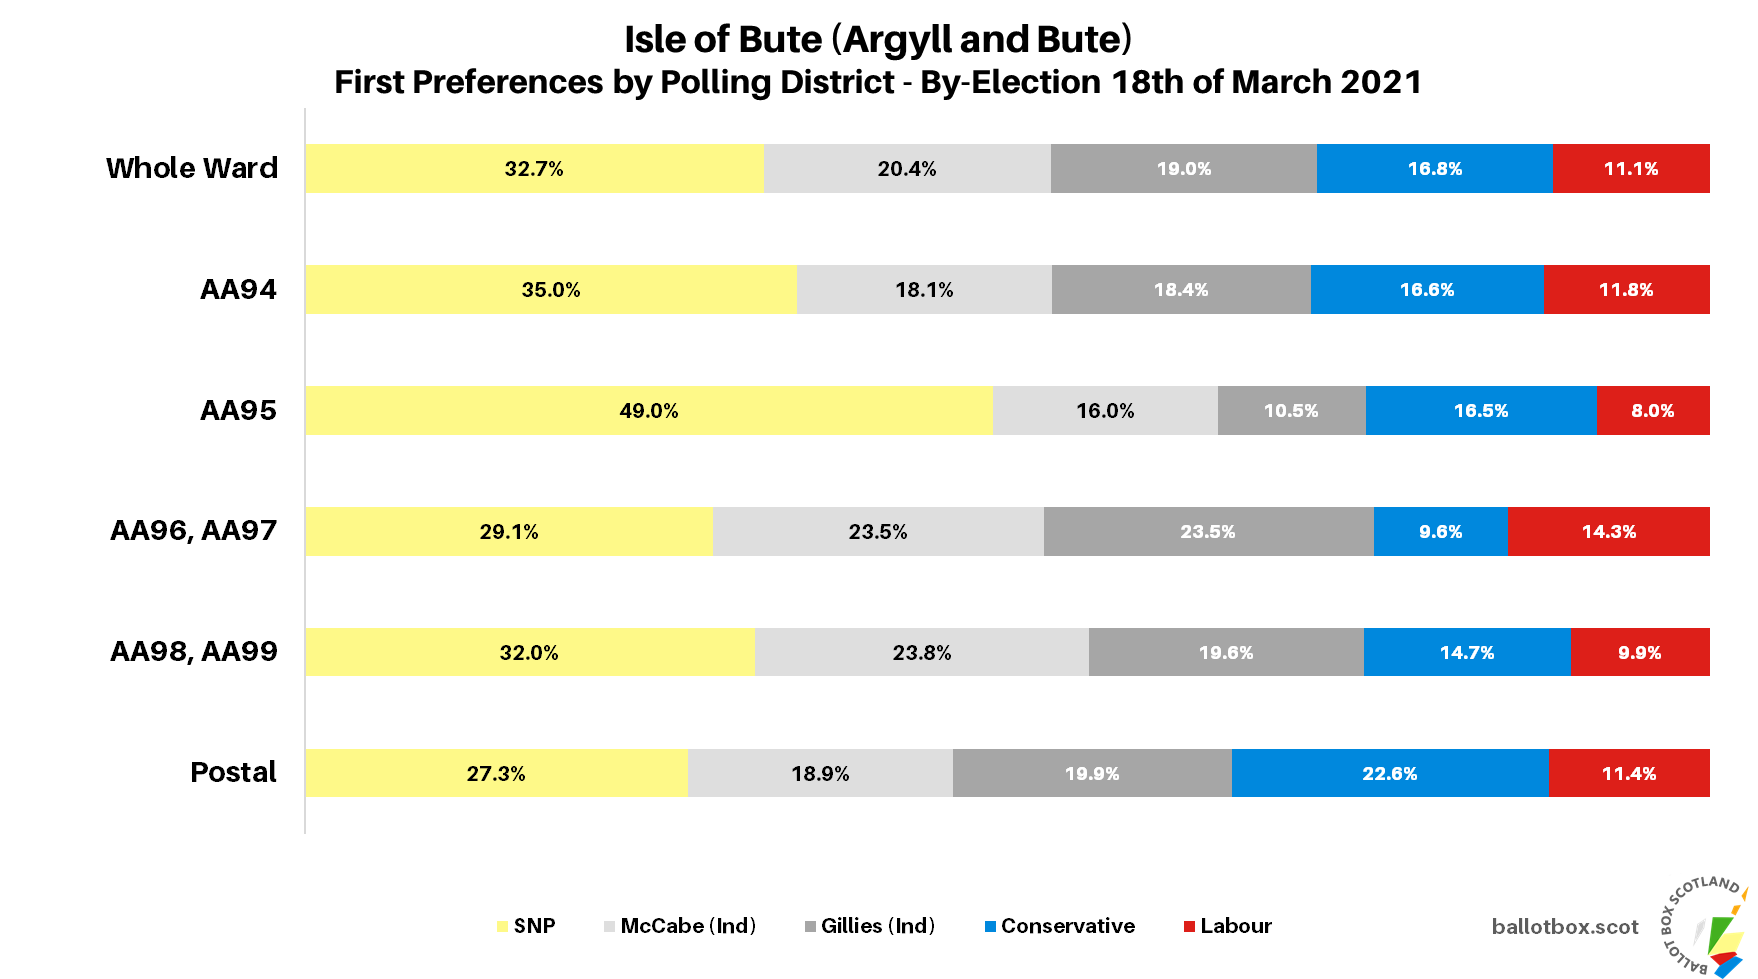
Machine counts mean more juicy data, so let’s get stuck into the polling district data.

This is basically the same as 2017, with the SNP leading each district, but the total Independent vote being higher everywhere except the AA95 district covering Port Bannatyne, which was the strongest bit for the SNP. McCabe performed most strongly in the southern end of the island, in the districts covering Craigmore, Ascog and Kilchattan Bay, whilst Gillies was once again rooted in central and southern Rothesay. That was Labour’s best area too, whilst the Conservatives excelled in western Rothesay and Ardbeg.
Absolutely no surprises here to find that the Independent candidates were the most popular choices for everyone else’s second preferences. The SNP, Conservatives and McCabe’s voters all leaned towards Gillies, whilst Gillies himself and Labour saw their votes directed in their largest parts to McCabe. The fact the SNP received less than 15% of everyone else’s second preferences goes some way to explaining how McCabe successfully overturned their lead in the transfer rounds.
First Preferences - Helensburgh and Lomond South
Moving now onto the other ward, which we expected to go to the Conservatives…
And it did, on first preferences alone, the Conservatives adding another transfer-free victory to their recent tally of such results. First preferences in full were (changes versus 2017 election):
Conservative - 1206 (50.7%, +11.7)
SNP - 562 (23.6%, +5.8)
Liberal Democrat - 333 (14.0%, -8.1)
Labour - 133 (5.6%, -2.9)
Green - 123 (5.2%, +5.2)
Worker's Party - 22 (0.9%, +0.9)
Note that in the 2017 election the Green candidate won 8.4% as an Independent, a second Independent won 3.2%, and UKIP won 1.1%%.
The Lib Dems clearly suffered for the changeover in candidate, as they dropped a quite weighty 8.1% here which likely made up the bulk of the big Conservative increase. Labour too suffered a decline of a few percent.
Whereas in 2017 this was one of relatively few mainland wards where the SNP didn’t place in the top two, they managed to do so here by growing their vote in both relative and absolute terms. Though we can’t directly compare Independent with party results, the Greens figure of 5.2% is lower than what their candidate won in 2017 as an Independent.
Transfers
Although there weren’t any transfers needed in this by-election so no need for a chart, we can run them anyway to get a “Two Party Preferred” result between the Conservatives and SNP (note that I always like to show exhausted ballots, so it’s slightly different from the Australian style, and changes are versus the 2017 re-calculation for the same two parties):
Conservative - 1396 (58.7%, +4.4)
SNP - 735 (30.9%, +5.5)
Didn't Transfer - 248 (10.4%, -9.9)
There’s actually a very, very slight narrowing of the Conservative lead over the SNP here, but to a degree that’s basically completely meaningless given how big the Conservative majority is.
Detailed Data
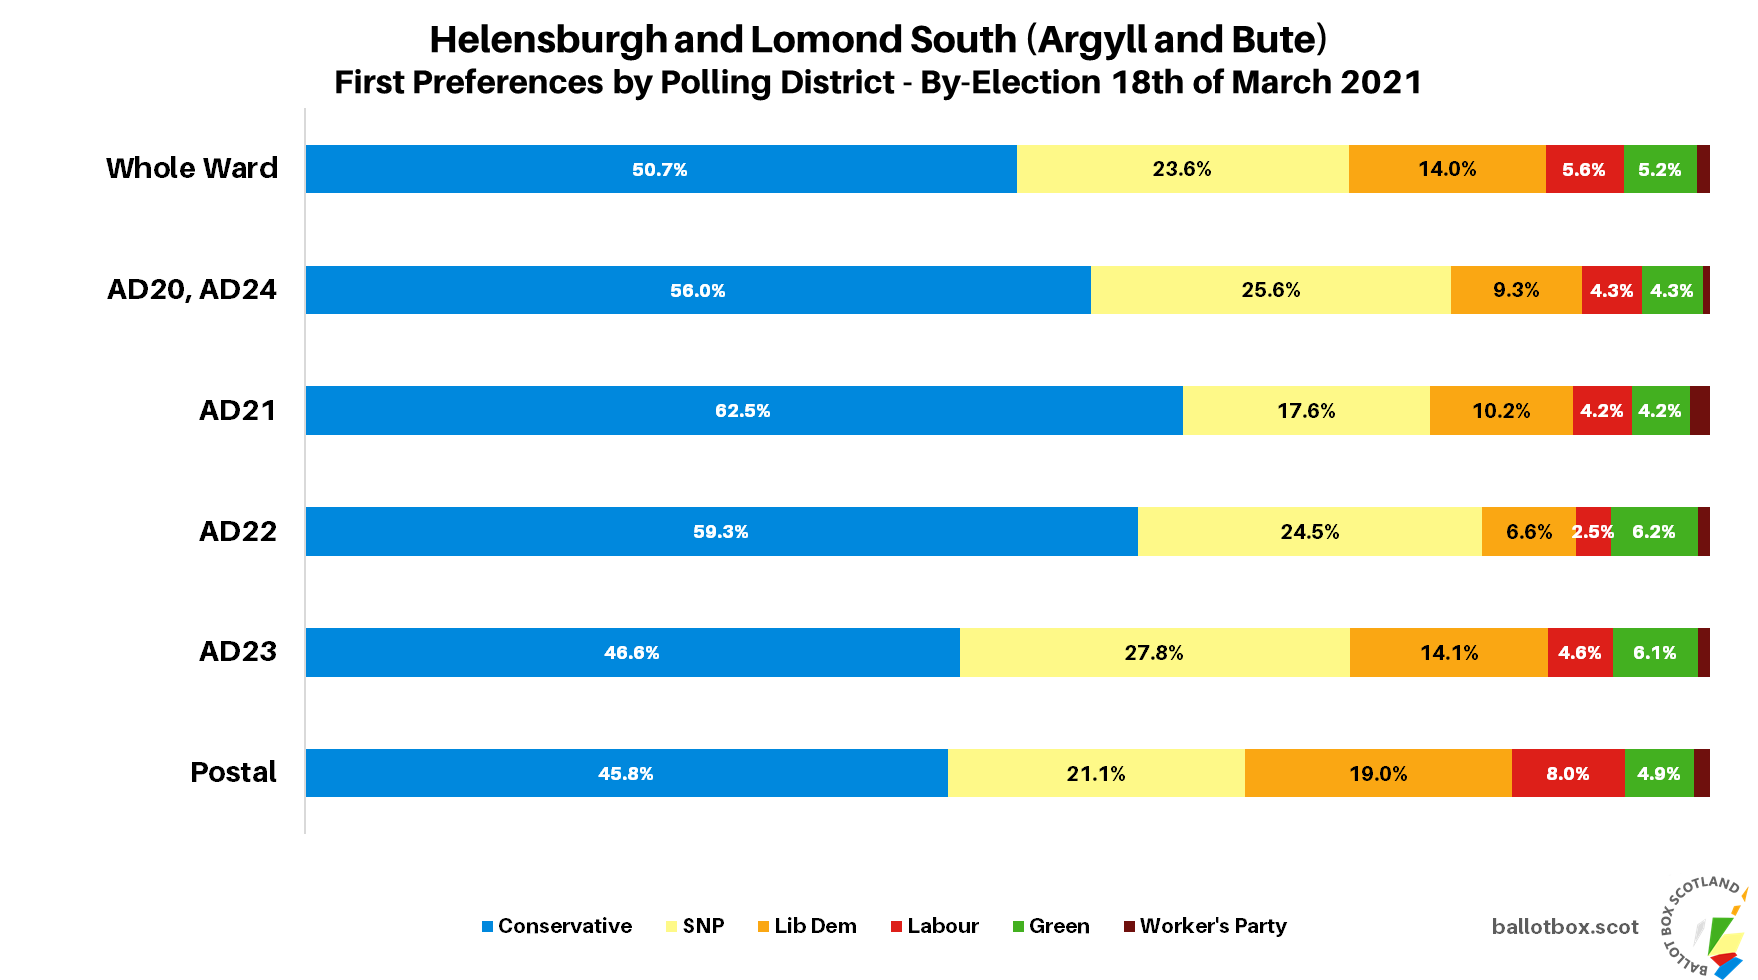
As with the other ward, we can look at the data at polling district level.

No surprises that, given their victory on first preferences alone, the Conservatives dominated every single one of the polling districts here, their best result coming from the northeast of Helensburgh. The SNP meanwhile posted their best result in Cardross, which was also the best non-postal spot for the Lib Dems and Labour. The Greens meanwhile performed most strongly in the north of Helensburgh.
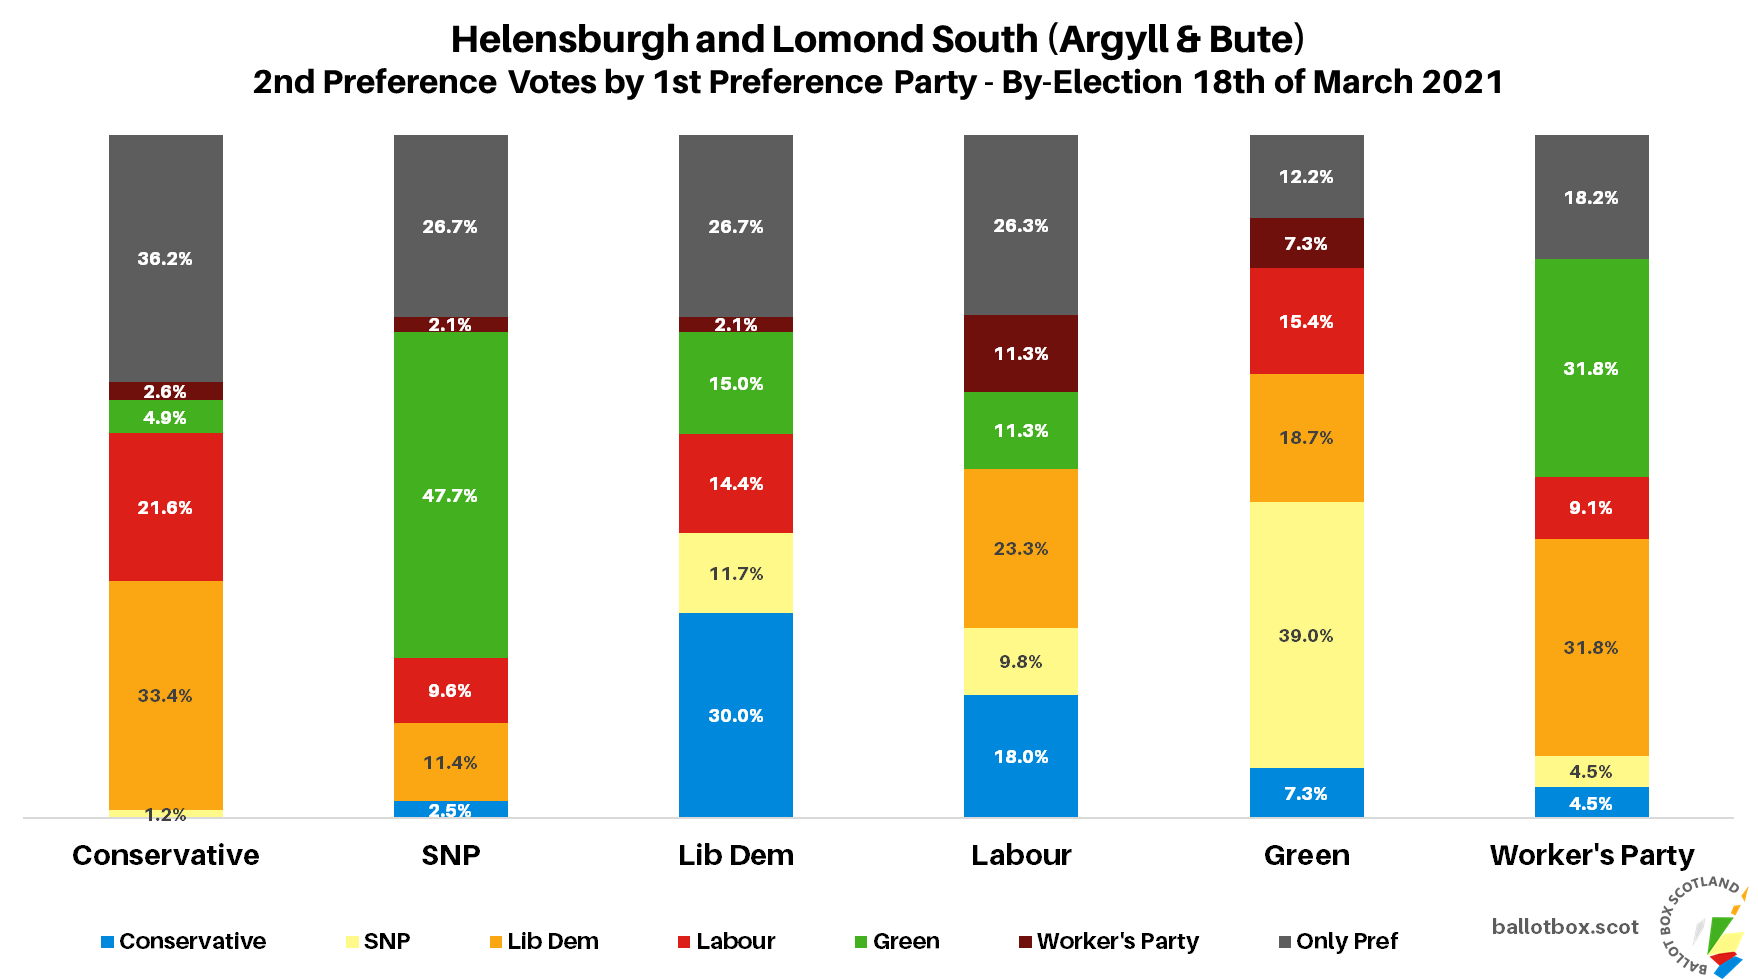
With a full slate of Holyrood parties here we see some of the dynamics we’ve come to expect. Is that strong mutual preferencing from SNP and Green voters? Yes, it is. Do the Conservatives and Lib Dems have a similar degree of mutual support? They do. Labour voters meanwhile were most favourable to the Lib Dems.
That’s us at the end of the busiest day in elections this month. There are two further by-elections due on the 25th, in Midlothian and Perth & Kinross. No rest for Ballot Box Scotland, especially as Holyrood is looming and there is always more work to be done!
If you find this or other Ballot Box Scotland output useful and/or interesting, and you can afford to do so, please consider donating to support my work. I love doing this, but it’s a one-man project and takes a lot of time and effort. All donations, no matter how small, are greatly appreciated and extremely helpful.
(About Donations)


