

Keep tabs on all the latest polling, articles and information ahead of the 2021 Scottish Parliament election in the Ballot Box Scotland Holyrood Hub!
I’m not saying I’m getting a little bit knackered, but we’re now on the 8th (public) poll conducted in March, which is as many as we saw in the previous three months combined! Not only that, this first outing by Find Out Now also adds an 8th pollster to our pool of those that are either regularly or have recently run Holyrood polling. That’s a lot of juicy polling data, and a whole lot of BBS work on top of all the other Holyrood coverage. It’s fun, but oopht…
Note that this poll pre-dates the formation of Alex Salmond’s new Alba Party. We don’t yet know what the impact of that party will be, but I expect to find out soon, as pollsters will be just as eager as everyone else to get to the bottom of that question. We should also know tomorrow evening who and where all of the candidates are for every party, as nominations will have closed.
Display format for this post:
- Party/Option – Vote% (Change vs last election or referendum)
Regional Vote
SNP ~ 42% (nc)
Conservative ~ 21% (-2)
Labour ~ 16% (-3)
Green ~ 11% (+4)
Liberal Democrat ~ 5% (nc)
Reform UK ~ 2% (+2)
As this is yet another new pollster, the only baseline we have for this poll is the 2016 election and what other pollsters are saying. For the SNP and Conservatives this is roughly in the middle of their current polling spread, for the Greens it’s towards the upper end, and for Labour and the Lib Dems it’s on the lower end. Although it’s unlikely to be seat-winning for Reform UK, the re-badged Brexit Party, 2% is the best they’ve done this campaign.
Relative to 2016 this would therefore be static for the SNP and Lib Dems, a pretty substantial increase for the Greens, and decreases for the Conservatives and Labour.
Constituency Vote
SNP ~ 50% (+3)
Conservative ~ 21% (-1)
Labour ~ 17% (-6)
Liberal Democrat ~ 5% (-3)
Green ~ 4% (+3)
Reform UK ~ 1% (+1)
Running the same comparative exercises for this vote, the SNP are up somewhat on 2016 and on the upper end of recent polling. Conservatives are on the lower end and down a bit, whilst the Greens have another record high on this vote which is unlikely to come to fruition given a more limited spread of candidates. That leaves both Labour and the Lib Dems at the low end of their recent polling and down heavily versus the last election.
Seat Projection
Please see this page for how projections work and important caveats.
Projecting that into seats might give us something like this:
SNP ~ 70 (+7)
Conservative ~ 26 (-5)
Labour ~ 18 (-6)
Green ~ 11 (+5)
Liberal Democrat ~ 4 (-1)
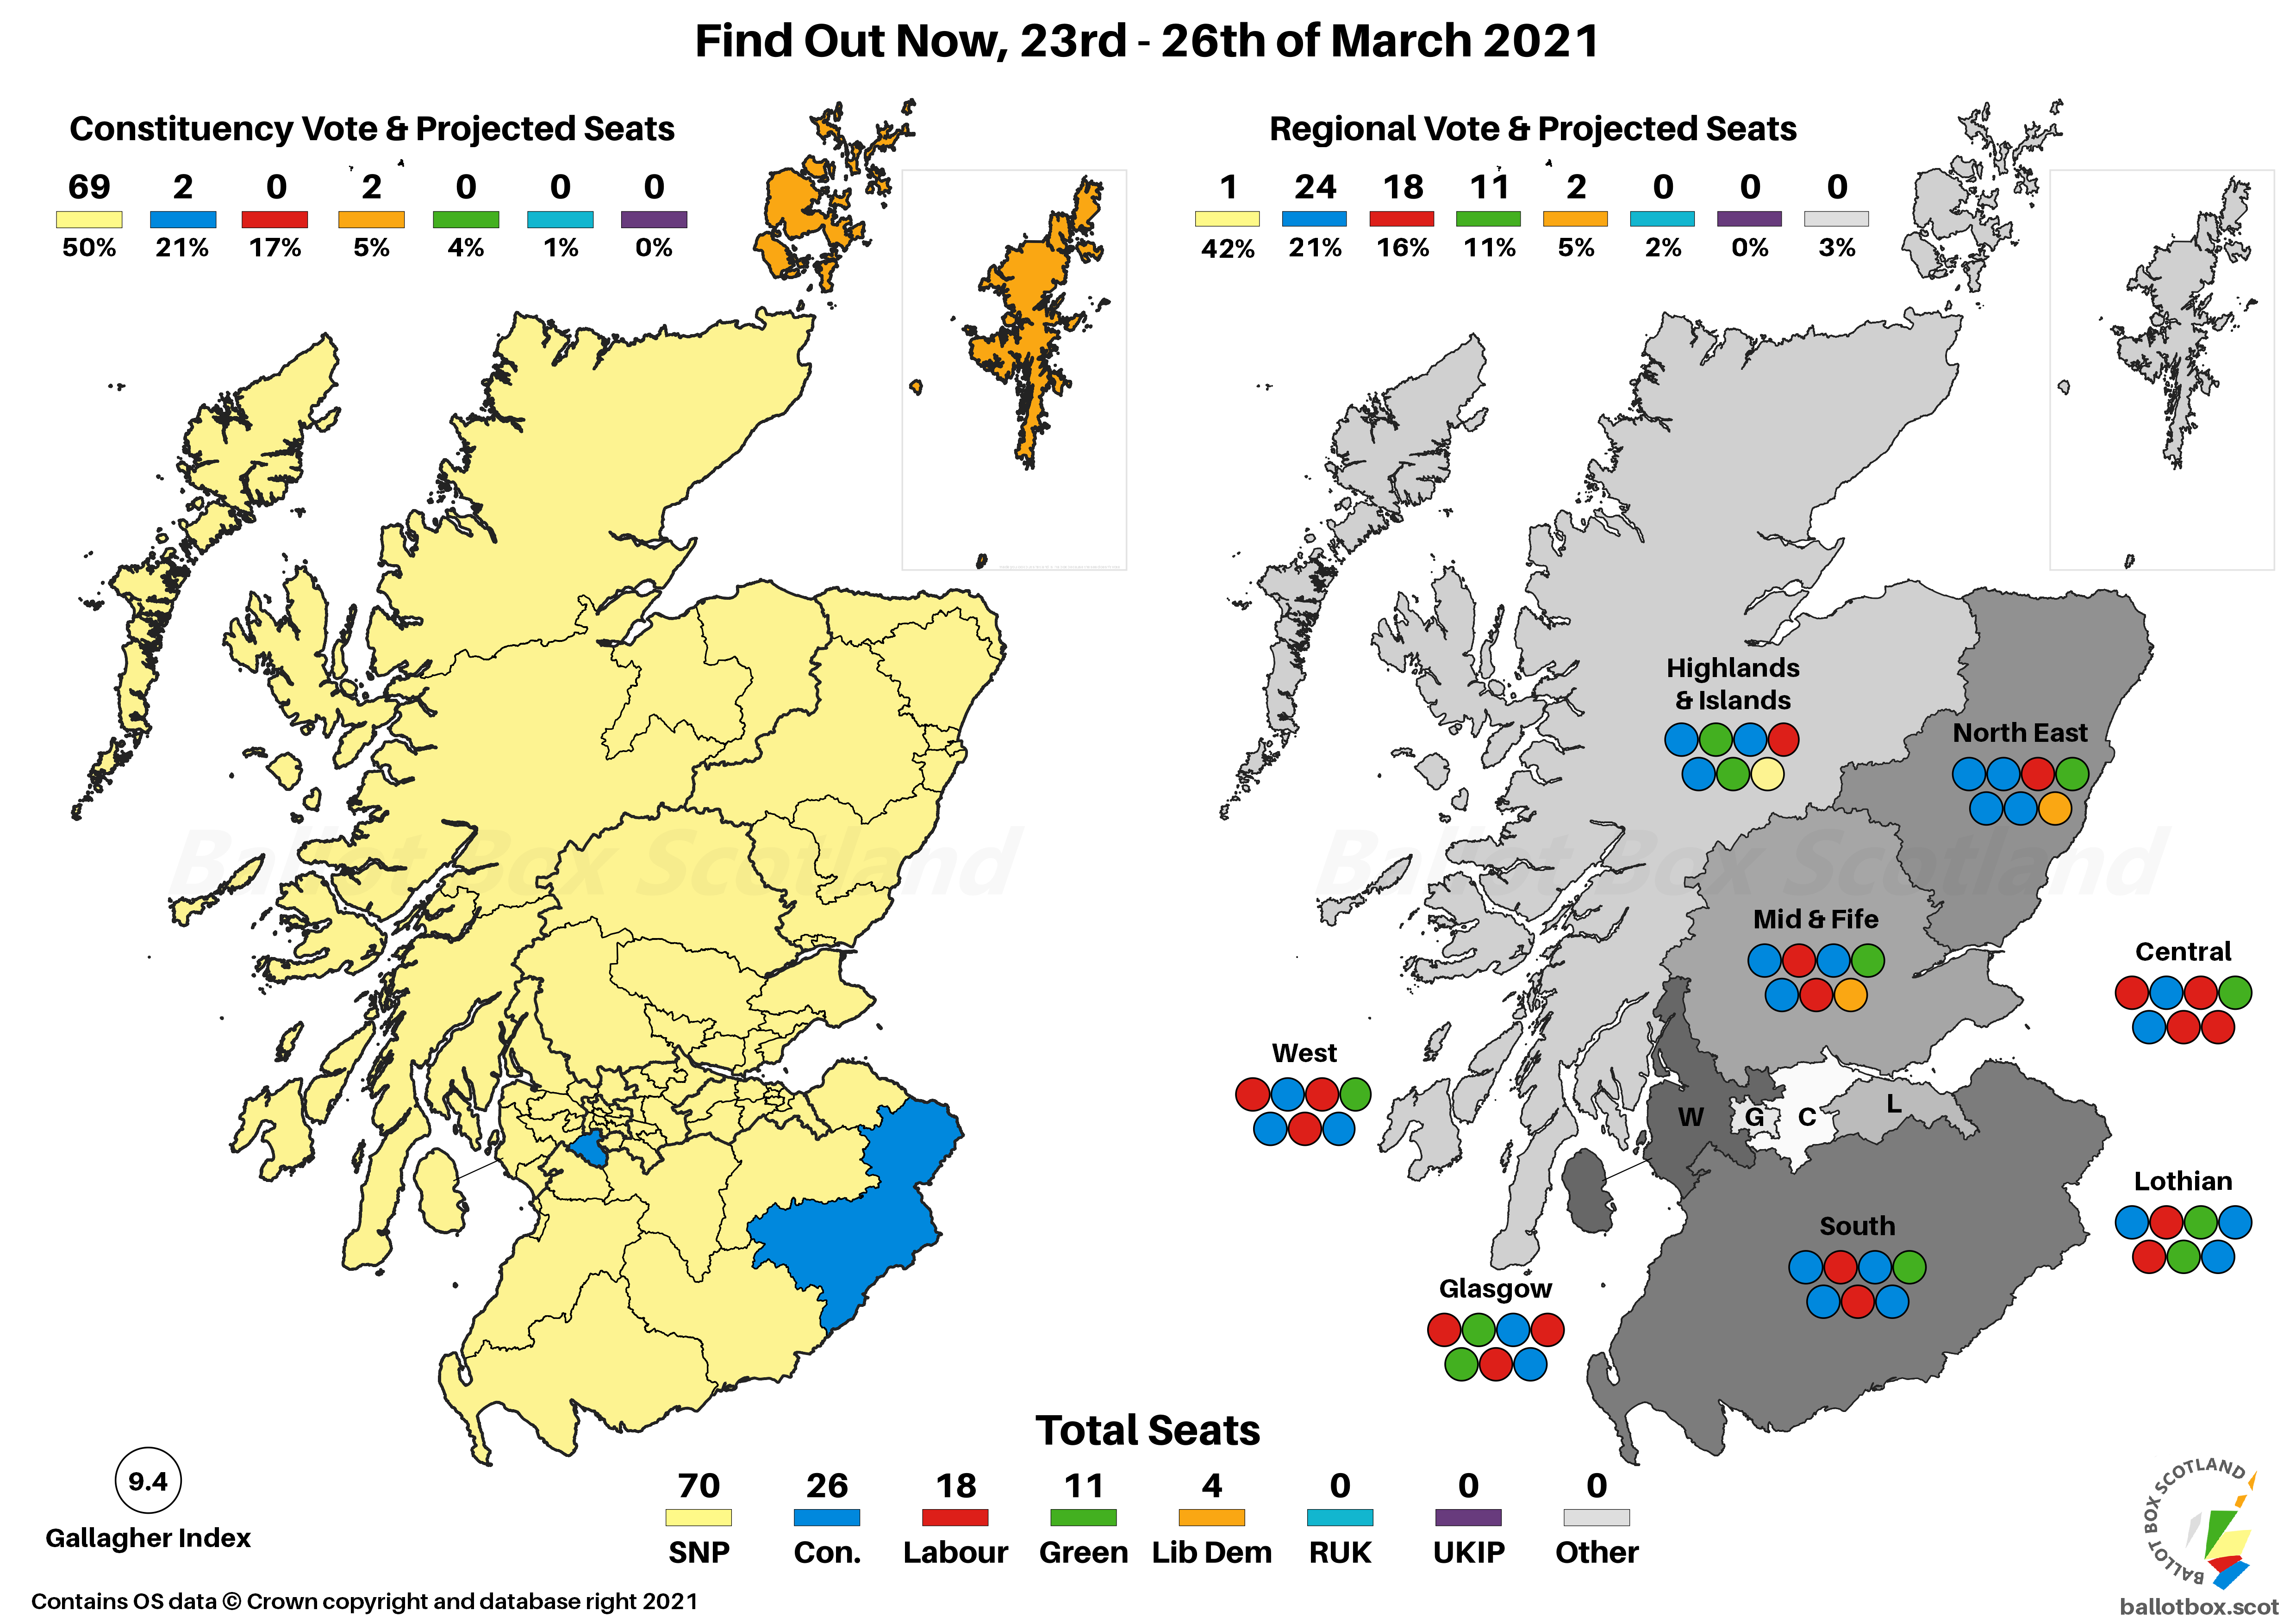

A clear majority of 70 seats is the second best projection for the SNP this month, and follows a recent spate of less comfortable majorities or indeed minority polls. Add in the 11 Greens and this is also the most the chamber has been projected to tilt towards the pro-Independence parties, at 81 seats versus 48 for their pro-Union counterparts.
I’ve not mentioned overhang too much lately, but given the current chatter online it’s worth reminding folk of it. Here, the SNP have 10 seats more than their ideal D’Hondt entitlement under AMS. That gives us a nice stepped pattern of 4 seats too few for Labour, 3 for the Conservatives, 2 for the Greens, and 1 for the Lib Dems.
No Westminster question in this poll, I’m afraid!
Standard Question
Yes ~ 48%
No ~ 44%
Don't Know ~ 8%
At the risk of repeating myself, which any regular readers might be getting a bit tired of, we’re still very much in the realms of the margin of error here. With a 4% advantage for Yes, this is the biggest the lead has been in this month’s batch of polling, but it’s not a particularly big one in the grand scheme of things.
Excluding Don't Knows
Yes ~ 52% (+7)
No ~ 48% (-7)
If we exclude the Don’t Knows, we once again get everyone’s favourite referendum numbers. Just to emphasise how much we’re living in the margin of error this month, we’ve had seven polls using the standard question logged in my tracker, which have split three in favour of Union, three in favour of Independence, and one tie.
Council Area Projection
Please see this page for how projections work and important caveats.

On a simple Uniform Swing versus 2014, this might have 17 councils leaning towards Yes, up from 4 at the referendum. 15 would be No leaning, down from 28.
Hypotheticals
As ever, the last little bit of analysis concerns those hypothetical and more proportional voting systems that I have a bee in my bonnet about here at BBS. The fact Westminster uses pure FPTP is an affront to democracy, and though Holyrood fares far better, AMS is still deeply imperfect. The examples here simply transpose the poll findings onto more proportional voting systems – the reality is that different systems would of course result in different voter behaviour.
Changes here are vs AMS.
SNP ~ 57 (-13)
Conservative ~ 28 (+2)
Labour ~ 22 (+4)
Green ~ 15 (+4)
Liberal Democrat ~ 7 (+3)

Most readers will know how this one works by now – the SNP would be down quite substantially without the warping effect of FPTP, whilst everyone else would be much better off. This would then mean a more accurate reflection of the constitutional balance of parties by votes cast, splitting 72:57 in favour of the pro-Independence parties.

If you find this or other Ballot Box Scotland output useful and/or interesting, and you can afford to do so, please consider donating to support my work. I love doing this, but it’s a one-man project and takes a lot of time and effort. All donations, no matter how small, are greatly appreciated and extremely helpful.
(About Donations)


