

Keep tabs on all the latest polling, articles and information ahead of the 2021 Scottish Parliament election in the Ballot Box Scotland Holyrood Hub!
Who put 50p in the pollsters? After already having ComRes pop up at the weekend with their second ever poll of this parliamentary term, Ipsos MORI have just appeared with their first. It’s a bit odd they’ve been so quiet in this term, given in the 2011-16 session of parliament they were quite regular. In any case, I’m always crying out for more diversity amongst the polls we get, so this is a welcome new (re)arrival. This poll had a very slight overlap with the ComRes poll, with fieldwork ending on the same day that poll was conducted.
Note that this ISN’T the only Independence poll they’ve done, having asked about that as recently as the 25th of November last year. As such, bear in mind that the Holyrood figures are purely changes since 2016, but the Independence figures are changes versus November.
Display format for this post:
- Party/Option – Vote% (Change vs last poll by agency / vs last election or referendum)
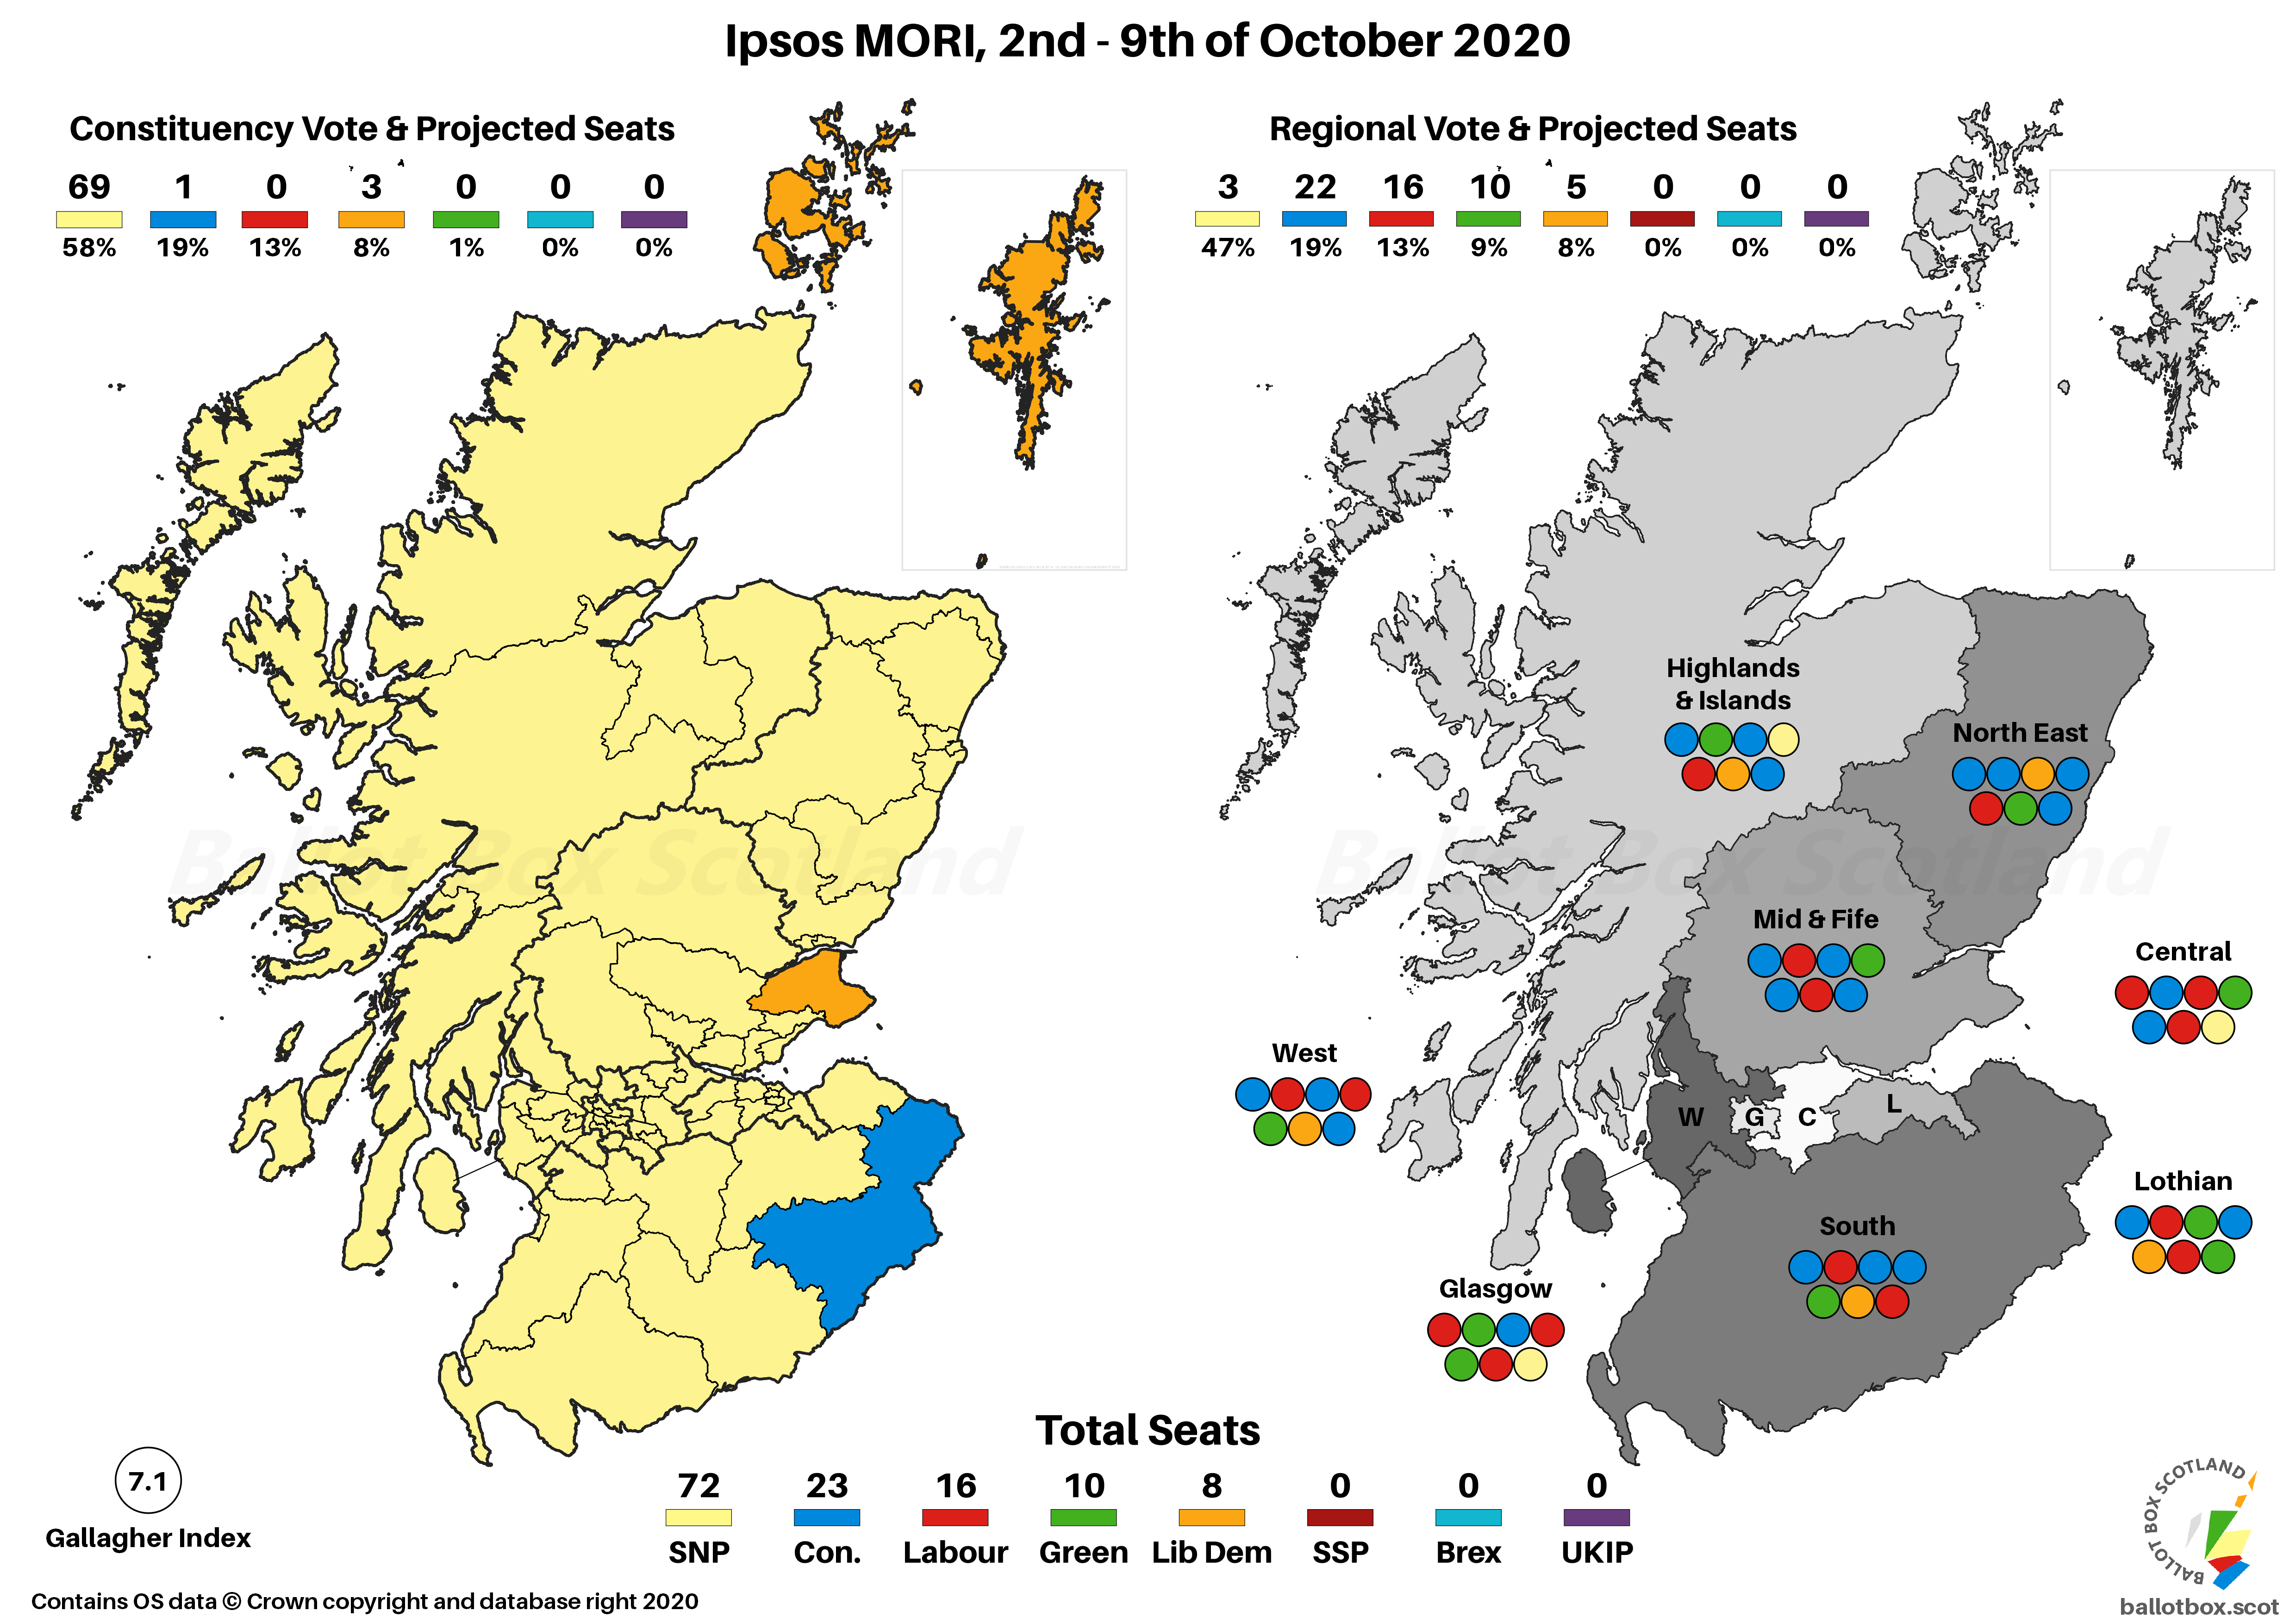
Regional Vote
SNP - 47% (+5)
Conservative - 19% (-4)
Labour - 13% (-6)
Green - 9% (+2)
Liberal Democrat - 8% (+3)
This is quite starkly different from the ComRes poll! Looking first at the SNP, this is on the higher end of their polling for the list vote, which puts them a whopping 28% ahead of their nearest competition. That’d be the Conservatives, who with 19% are on a joint second-worst polling figure for this vote.
Things are even more grim for Labour here. Whereas ComRes and other agencies had them creeping upwards from record lows, this has them back down towards that rock-bottom. It’s not their worst, which was 11% (and 4th, behind the Lib Dems) in September 2019, but it’s close.
On the other hand, both the Greens and Lib Dems will be pleased to see healthy increases in their vote share compared to 2016, that are roughly in line with other recent polling.
Constituency Vote
SNP - 58% (+11)
Conservative - 19% (-3)
Labour - 13% (-10)
Liberal Democrat - 8% (nc)
Green - 1% (nc)
It’s even more dramatic in this vote, with a truly eye-watering 58% for the SNP being the highest they’ve polled since the last election. That’s a full 11% more than their list vote, putting Ipsos into the “wide gap between ballots” column. There’s a correspondingly low figure for the Greens (a further note on that shortly), but the other parties are polling identically to the list vote.
That means things are even bleaker for Labour here, as that represents almost a full 10% drop in their vote compared to the election. It’s been some time since a poll projected to show any Labour constituencies, and this seemingly puts them even further from holding any.
Seat Projection
Please see this page for how projections work and important caveats.
SNP - 72 (+9)
Conservative - 23 (-8)
Labour - 16 (-8)
Green - 10 (+4)
Liberal Democrat - 8 (+3)

As you’d expect from such strong polling for the SNP, they’d come out with a comfortable majority. Throw in the 10 Green seats, and that gives a constitutional balance of 82-47 in favour of the pro-Independence parties.
On the pro-Union side, the Conservatives are on their joint second-worst figure since 2016, and Labour lose a third of their seats. With a neat gain of three, the Lib Dems’ Willie Rennie would probably be the only pro-Union leader not immediately defenestrated by his party.
You may note on the map showing runners up and margins that the Greens are now not only projected to be second in Glasgow Kelvin, but also in Edinburgh Northern and Leith. This is a new addition since the weekend, as I revisited how my calculator deals with Greens in the constituencies, in part because recent Kelvin figures were deeply weird, but also in light of the recent announcement by the party they’d be contesting Northern and Leith.
It now takes a much more cautious approach to dealing with the Greens in Kelvin, whereas for any other seats the Greens contest I’ve got a toggle that makes an estimate for them based on their 2016 list vote share there, and their list vote in the poll. It basically ignores the Green constituency figure, as with such a limited number of constituencies contested it’s not a useful measure. Anyway, with Labour down 10% and Northern and Leith being the Greens’ second best area in 2016, they show as second there.
No Westminster figures, unfortunately. Ipsos MORI did poll on Westminster a couple of times between 2017 and 2019, so it’s a bit annoying they seem to be working on a “never the twain shall meet” basis.
Standard Question
Yes - 55% (+7)
No - 39% (-9)
Don't Know - 6% (+2)
Even for a time when Independence is experiencing an unprecedented sustained lead in the polls, this is pretty remarkable. Even when uncertain voters are included, this poll still shows a massive lead for Yes.
It’s worth bearing in mind however that Ipsos MORI also found the previous record high in support of Independence back in August 2015, showing as 53% vs 44% and 3% Don’t Know. In general, they do seem to show slightly higher support for Independence than everyone else. Effectively, we can be very confident that Ipsos MORI have the right of it in general Yes-No terms, but a lot less confident they’ve got the exact balance of the two spot on.
Excluding Don't Knows
Yes - 58% (+8 / +13)
No - 42% (-8 / -13)
Obviously, once you take out the don’t knows, you get an even more dramatic result. This seems to be the highest Independence finding ever, or certainly in recent history. Again, however, bear that caveat about Ipsos MORI’s history on this question in mind.
Council Area Projection
Please see this page for how projections work and important caveats.

On a simple Uniform Swing versus 2014, this might completely reverse the results of that referendum, with 28 Council Areas leaning towards Yes and 4 towards No. Only the two council areas bordering England and the Northern Isles come out in favour of the Union by this measure. For the third time though, remember this poll may be an outlier in terms of how high support for Independence is.
Other Independence Related Questions
This poll also asked a range of other questions relating to Independence. Firstly, it asked people whether an SNP majority next year means the UK government should allow an Independence referendum:
- Definitely Should – 51%
- Probably Should – 12%
- Probably Should Not – 7%
- Definitely Should Not – 27%
- Don’t Know – 2%
Overall, Scots feel that such a circumstance should allow a referendum by 64% to 34%.
Finally, it asked about how convincing arguments in favour of Independence or the Union were. Starting with how many found the Independence arguments convincing (Very / Fairly):
- People in Scotland want to take the country in a very different political direction to England
- 64% (38% / 25%)
- Westminster governments cannot be trusted to act in Scotland’s interests
- 63% (46% / 17%)
- Because the UK is leaving the EU even though Scotland voted to Remain
- 57% (40% / 17%)
- In the long term, Scotland’s economy will be stronger outside the UK than within it
- 52% (27% / 25%)
And how convincing the Union arguments were (again, Very / Fairly):
- In spite of current challenges, the different countries of the UK still have more in common than divides us
- 60% (29% / 31%)
- Independence would be a major risk for Scotland’s economy and jobs
- 55% (35% / 20%)
- Scotland gets the best of both worlds from having its own devolved parliament and being part of the UK
- 49% (25% / 24%)
- Leaving the UK would leave Scotland isolated and weaker on the international stage
- 43% (26% / 17%)
On the whole, voters were more convinced by the Pro-Independence than Pro-Union arguments presented, but this was by no means an exhaustive list of arguments in favour of either option, so this is mostly just interesting rather than deeply indicative.
Hypotheticals
As ever, the last little bit of analysis concerns those hypothetical and more proportional voting systems that I have a bee in my bonnet about here at BBS. The fact Westminster uses pure FPTP is an affront to democracy, and though Holyrood fares far better, AMS is still deeply imperfect. The examples here simply transpose the poll findings onto more proportional voting systems – the reality is that different systems would of course result in different voter behaviour.
Changes here are vs AMS:
SNP - 63 (-9)
Conservative - 25 (+2)
Labour - 17 (+1)
Green - 13 (+3)
Liberal Democrat - 11 (+3)

With the SNP coming up short of a majority of the (useful) list vote, they’d be just shy of a majority in this purely proportional system. As ever, everyone else would be slightly better off, in particular the Greens and Lib Dems.

If you find this or other Ballot Box Scotland output useful and/or interesting, and you can afford to do so, please consider donating to support my work. I love doing this, but it’s a one-man project and takes a lot of time and effort. All donations, no matter how small, are greatly appreciated and extremely helpful.
(About Donations)


