

Keep tabs on all the latest polling, articles and information ahead of the 2021 Scottish Parliament election in the Ballot Box Scotland Holyrood Hub!
In yesterday’s Ipsos MORI coverage, I said that there was a new poll due out today. I was wrong – there were in fact two polls out today. There was a ComRes poll which I was expecting, and this second entry from Opinium which came out of the blue. Since this finished fieldwork first, it makes chronological sense to start with it.
As I’m still trying to stick to a one article a day limit here on BBS, plus I’ve got lots of other stuff to do, and I have my actual day job, you’ll have to wait until Saturday for the ComRes analysis. Tomorrow is a Ballot Box Battlegrounds day, and I’ve got to keep to schedule!
Display format for this post:
- Party/Option – Vote% (Change vs last poll by agency 11th – 16th of March / vs last election or referendum)
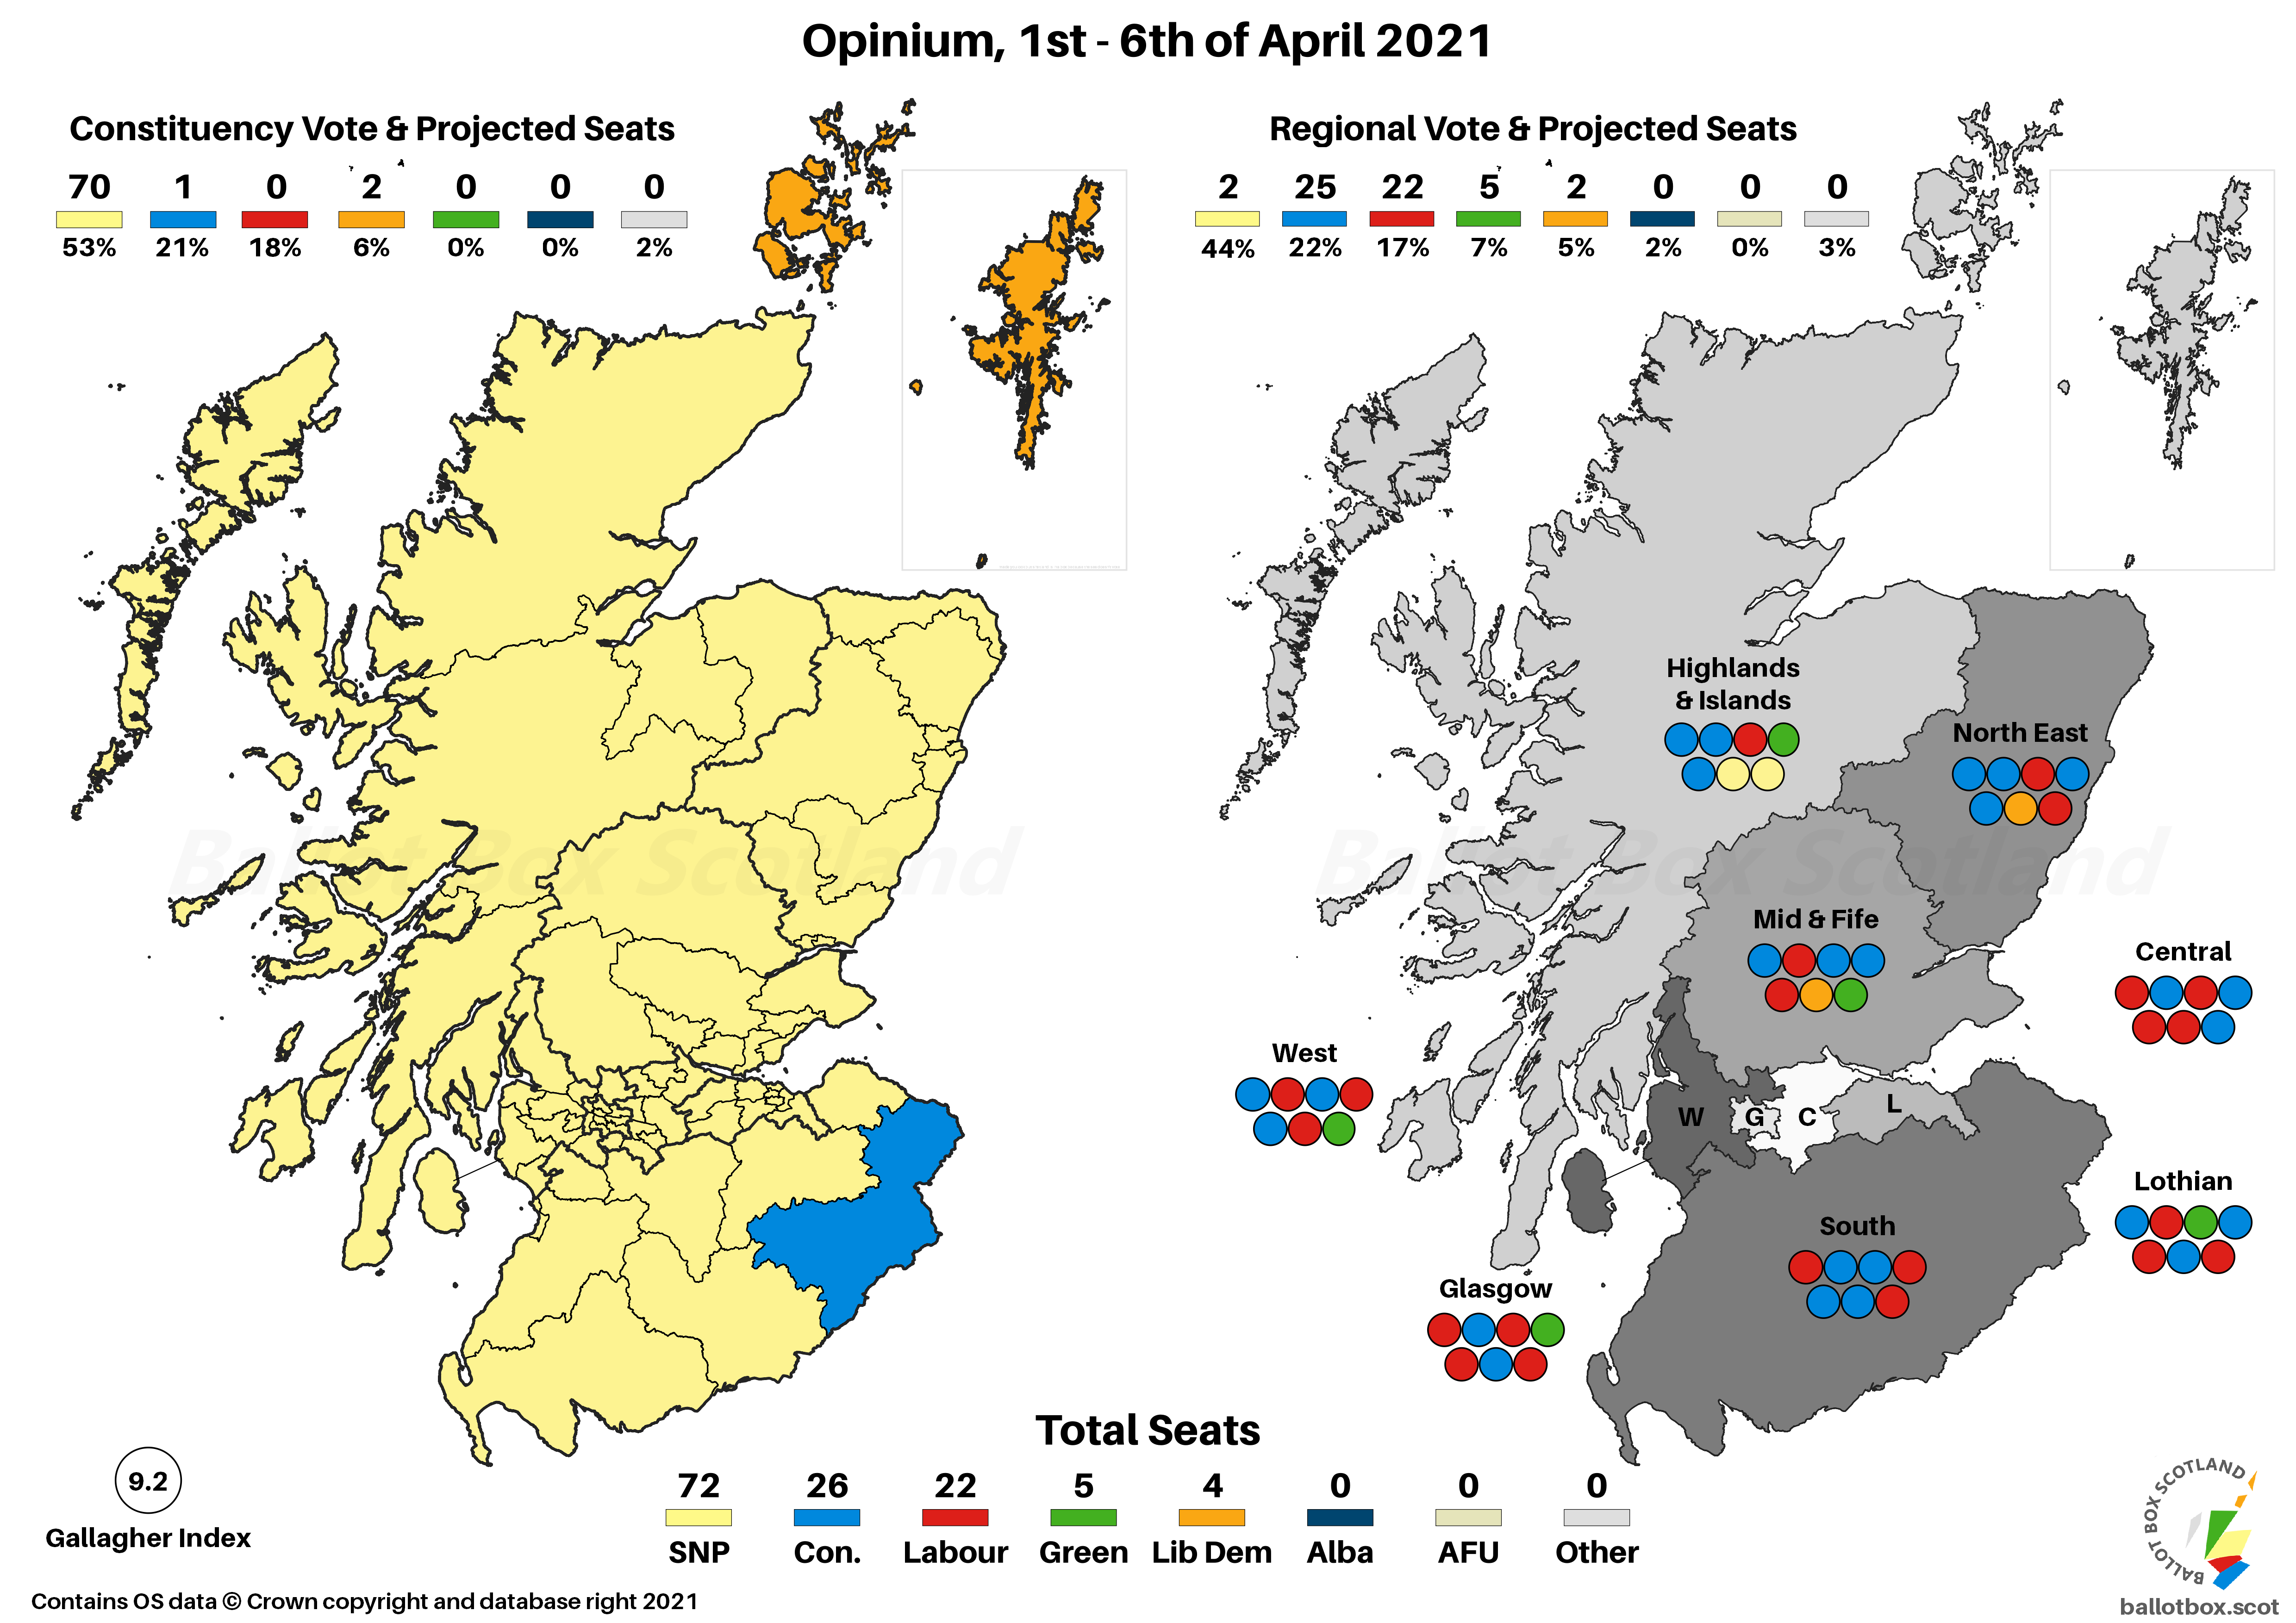
Regional Vote
SNP ~ 44% (+2 / +2)
Conservative ~ 22% (nc / -1)
Labour ~ 17% (-2 / -2)
Green ~ 7% (nc / nc)
Liberal Democrat ~ 5% (nc / nc)
Alba ~ 2% (+2 / +2)
The other thing I said in yesterday’s piece was that we probably needed one more poll to determine whether Panelbase’s 6% for Alba was an outlier or not. Both of today’s polls seem to confirm that, and in this case 2% is the worst this new party has performed in a poll since launching. Indeed, rather than facing heavy vote share losses to Alba, the SNP manage an increase in this poll.
The only party losing out here is Labour, who drop a couple of percent. The Conservatives, Greens and Lib Dems are static, with the latter two entirely so as they remain on their 2016 results as well. We’ve only got the two polls to work with, but Opinium do appear to be slotting into the low end of the polling scale for the smaller parties.
Constituency Vote
SNP ~ 53% (+7 / +6)
Conservative ~ 21% (-3 / -1)
Labour ~ 18% (-2 / -5)
Liberal Democrat ~ 6% (nc / -2)
Green ~ 0% (-4 / -1)
I normally wouldn’t show a 0% figure here, but given the Greens were on 4% in the last Opinium poll it was worth briefly remarking on why that is. Since the last poll the final candidate nominations have been published, and the Greens are standing in 12 of the 73 constituencies. That’s a lot more than 3 in 2016, but still very few and it means that Opinium opted to remove them from the prompt, since relatively few voters will have a Green on their constituency ballot.
That may then explain part of the massive 7% increase for the SNP here, with the remainder being made up by notable declines for the Conservatives and Labour. In doing so, Opinium go from having found one of the lowest SNP constituency votes in recent months to one of the highest.
Seat Projection
Please see this page for how projections work and important caveats.
Projecting that into seats might give us something like this:
SNP ~ 72 (+8 / +9)
Conservative ~ 26 (-4 / -5)
Labour ~ 22 (-2 / -2)
Green ~ 5 (-1 / -1)
Liberal Democrat ~ 4 (-1 / -1)
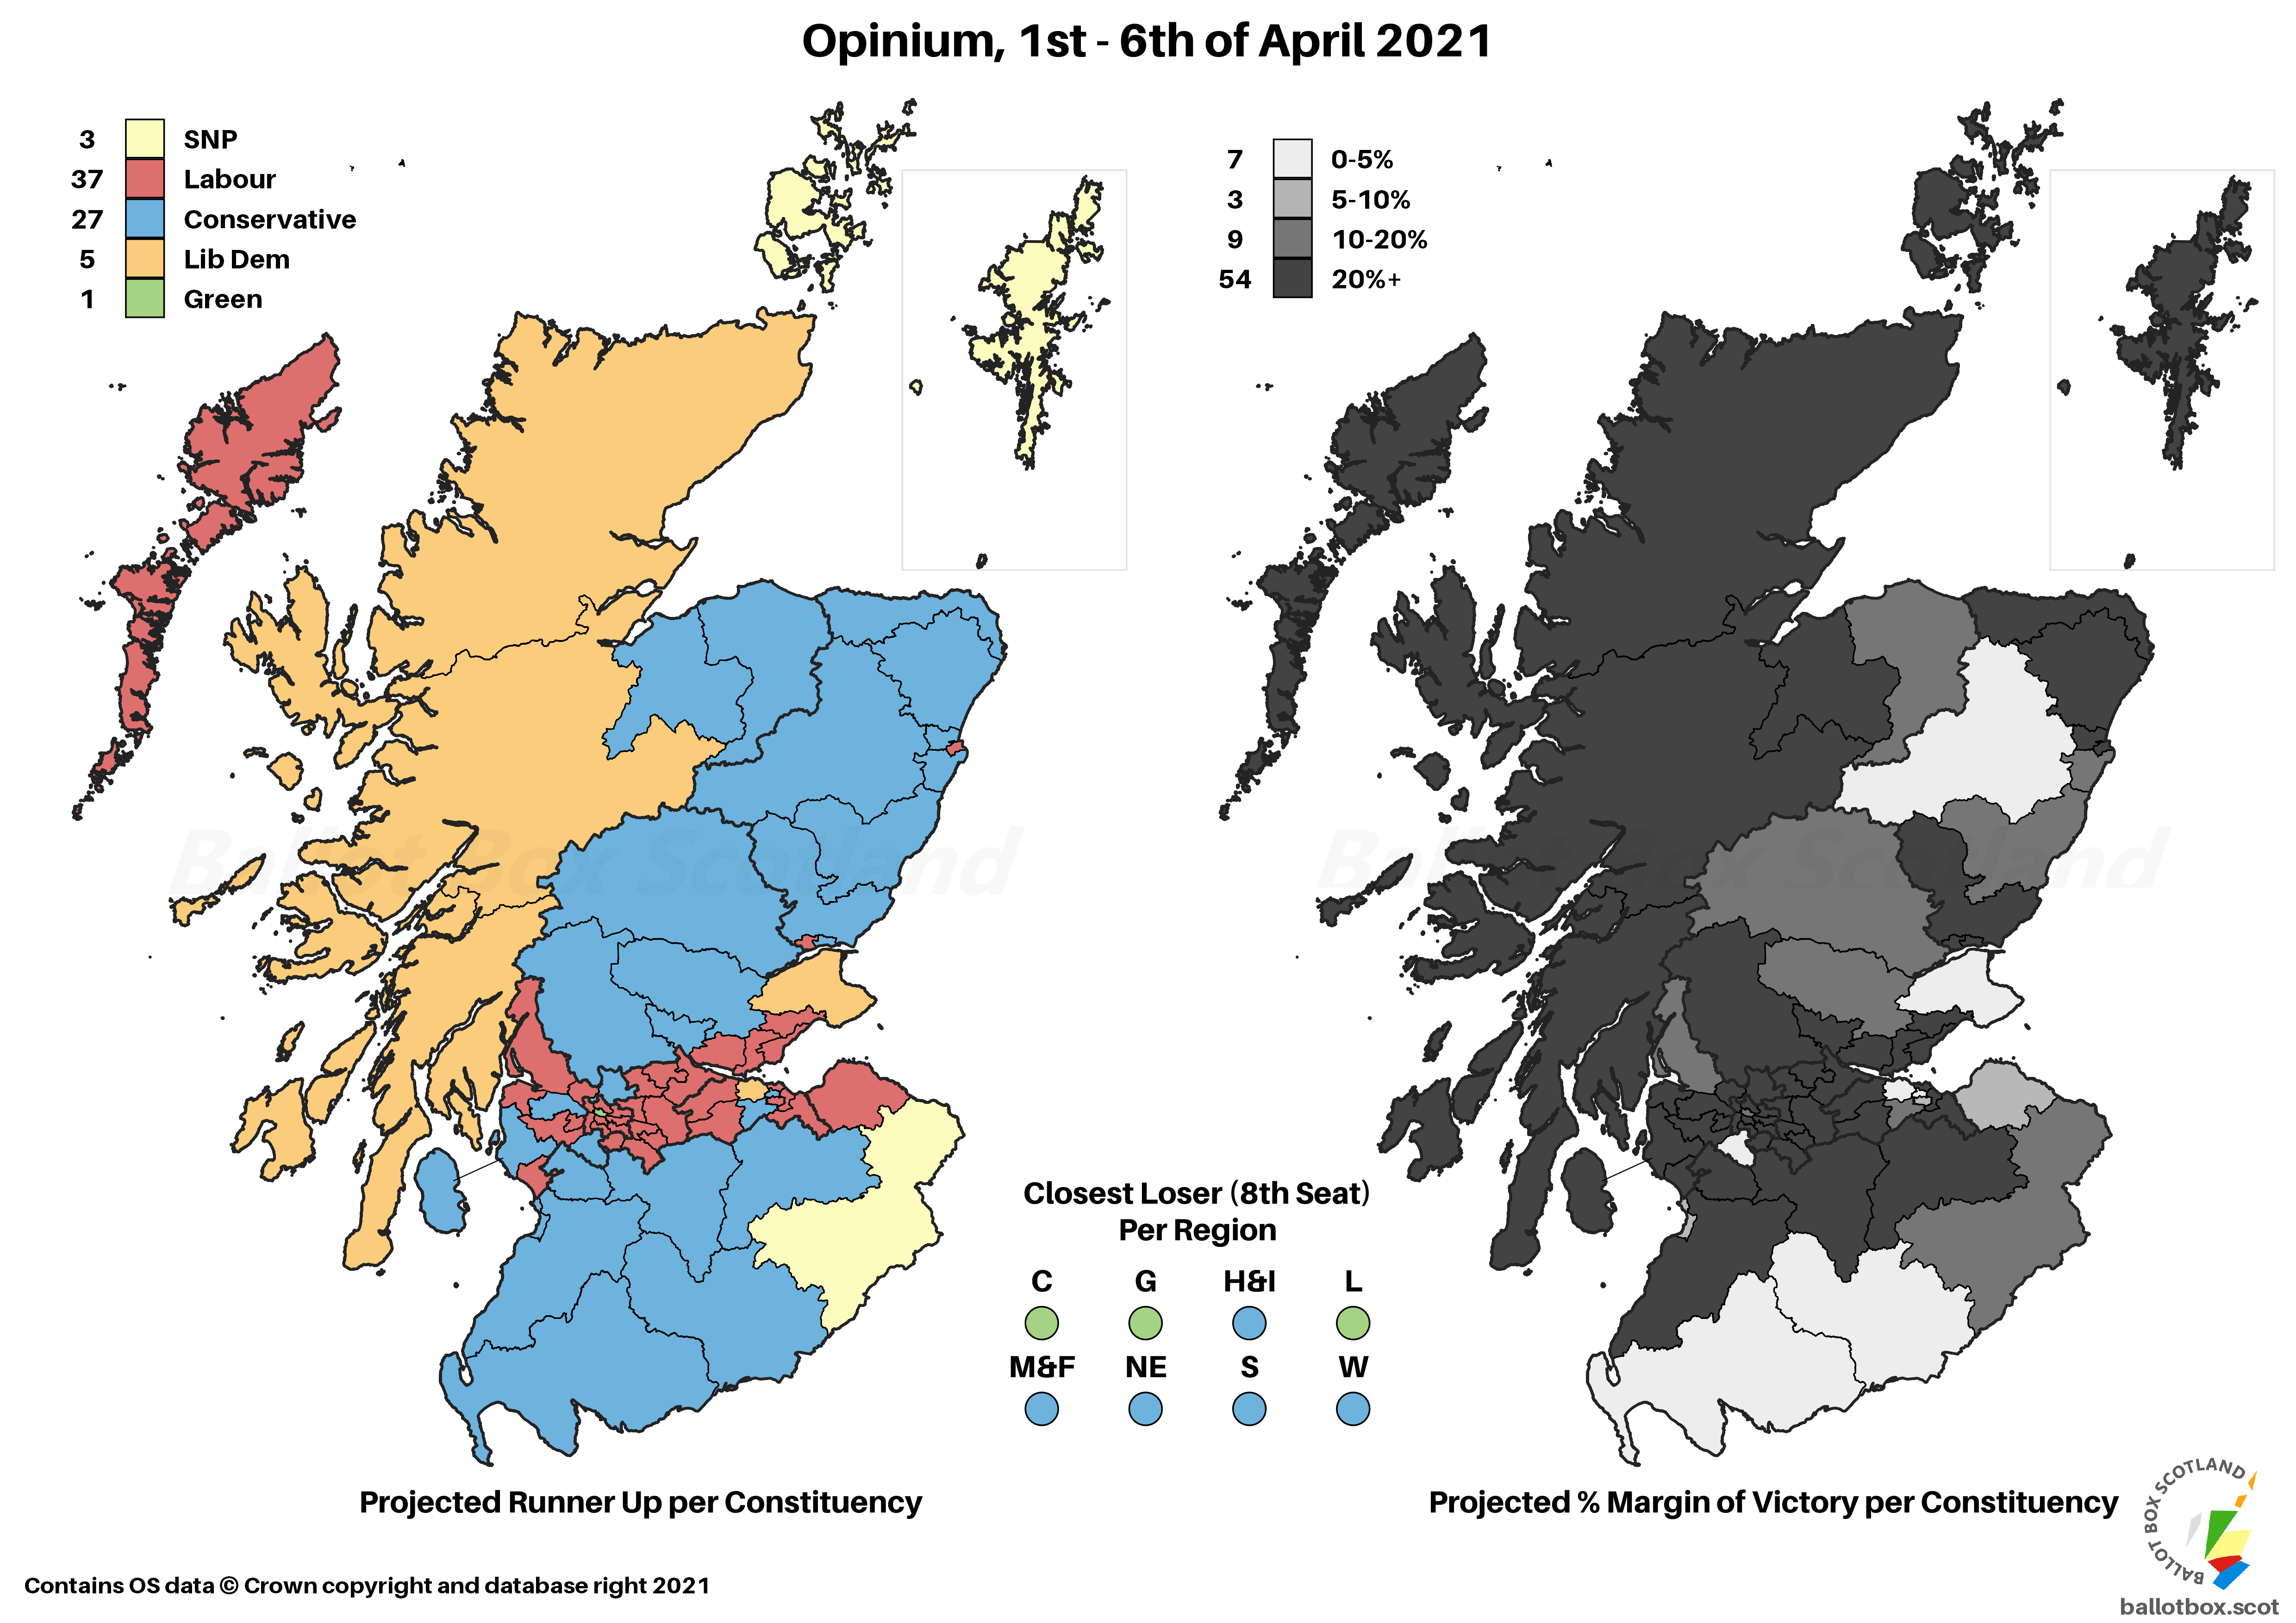
Whereas the previous Opinium was as close to 2016 as any poll has suggested (or at least for quite some time), the projection here is for a very comfortable SNP majority, at everyone else’s expense.
We’re again seeing just 4 seats projected for the Lib Dems, which was also true of Ipsos MORI and Panelbase, plus the Find Out Now from just before the Alba launch. That’s in part a reminder of how fine some of the margins we’re working with are, especially when the SNP are projected to sweep so many constituencies. The Greens often show similar, with a further loss of 1% projecting them at 4 seats too, whereas a gain of 1% would project to 9.
SNP ~ 50% (nc / +5)
Conservative ~ 24% (+1 / -1)
Labour ~ 19% (nc / nc)
Liberal Democrat ~ 4% (-1 / -6)
Green ~ 1% (-2 / nc)
Just some very small changes in the Westminster question, as the Greens drop 2% to end up where they were in 2019, and the Lib Dems also drop a point for their joint worst result since the election. A single point gain for the Conservatives rounds out the changes, though it still has them slightly behind their result at the last election.
Standard Question
Yes ~ 48% (+2)
No ~ 46% (+1)
Don't Know ~ 6% (-3)
(Note: These aren’t directly quoted, I’ve drawn these figures from deeper in the tables, and have excluded the refused numbers.)
Same story as for the past month or so here – it’s margin of error all the way down. Scotland remains indecisive, though we’ve gotten marginally more decisive about being indecisive, due to a slight reduction in Don’t Knows.
Excluding Don't Knows
Yes ~ 51% (nc / +6)
No ~ 49% (nc / -6)
Removing those remaining Don’t Knows however still has us on the same 51-49 lead for Independence as the last poll. I think I actually like this particular split less than the 52-48, just because it creates those two weird “complete ties” in the (very basic) projection below.
Council Area Projection
Please see this page for how projections work and important caveats.

On a simple Uniform Swing versus 2014, this is the evenly split point where 15 councils apiece lean one direct, and 2 sit awkwardly bang on the 50-50 mark.
Other Independence Questions
As is quite common at the moment, there were questions on the circumstances and timing of a possible Independence referendum. Starting with “if the SNP win a majority”:
- In the next two years ~ 33% (+1)
- In the next five years ~ 16% (+2)
- Further in the future ~ 13% (-2)
- Shouldn’t be one ~ 33% (nc)
- Don’t Know ~ 5% (-1)
A clear majority of voters do want another referendum at some point if the SNP win a majority, but the lead between those who want one in this term is only narrowly ahead of those who don’t at 49% vs 46%.
Then they were asked about a general Pro-Independence majority of MSPs rather than purely SNP:
- In the next two years ~ 32% (+2)
- In the next five years ~ 17% (+3)
- Further in the future ~ 12% (-3)
- Shouldn’t be one ~ 34% (nc)
- Don’t Know ~ 2% (-2)
This comes out at the same 49% vs 46% in favour of a referendum this term, which marks a change from the previous poll where this framing narrowly reversed the overall preference. Whether that’s just some margin of error stuff, or recent spotlighting of parliamentary arithmetic might have changed some minds, it’s hard to say.
Finally, if it was a pro-Union majority:
- In the next two years ~ 26% (-1)
- In the next five years ~ 17% (+4)
- Further in the future ~ 14% (-2)
- Shouldn’t be one ~ 37% (+1)
- Don’t Know ~ 6% (-2)
This breaks 51% vs 43% against having one this term. It shouldn’t really be a surprise that a majority is opposed to a referendum in those circumstances, albeit that there is clearly a large core that just wants to get to vote regardless. That core even seems to have increased slightly compared to the last poll too.
Hypotheticals
As ever, the last little bit of analysis concerns those hypothetical and more proportional voting systems that I have a bee in my bonnet about here at BBS. The fact Westminster uses pure FPTP is an affront to democracy, and though Holyrood fares far better, AMS is still deeply imperfect. The examples here simply transpose the poll findings onto more proportional voting systems – the reality is that different systems would of course result in different voter behaviour.
Changes here are vs AMS / vs same projection for the last poll.
SNP ~ 59 (-13 / +3)
Conservative ~ 30 (+4 / nc)
Labour ~ 23 (+1 / -3)
Green ~ 10 (+5 / nc)
Liberal Democrat ~ 7 (+3 / nc)
As the election approaches and polls are coming out more frequently, I’m jettisoning the actual map for this one for now. I still think it’s a fun and useful exercise, but it’s also time consuming to manually change 129 bubbles! (The AMS projection is only 56 bubbles, because the 73 constituencies are driven from a spreadsheet).
Anyway, this would act like a proper PR system should, showing no change in seats versus the last poll for parties with no change in votes! Though the SNP would naturally fall short of a majority in this more proportional system, there’s still a 69:60 balance in favour of the pro-Independence parties overall.

Scandinavian Style Westminster
Changes here are only versus the same projection on the last poll, given my aversion to doing projections on pure FPTP.
SNP - 30 (+1)
Conservative - 15 (+1)
Labour - 12 (+1)
Liberal Democrat - 2 (-1)
Green ~ 0 (-2)
Obviously this would be massively different to FPTP where the SNP would likely achieve an almost clean sweep on these figures. Versus the last poll, the Greens are below threshold so come up with nothing, whilst the Lib Dems would be down a seat too given their very low figure. The other three parties would all benefit to the tune of a single seat.
If you find this or other Ballot Box Scotland output useful and/or interesting, and you can afford to do so, please consider donating to support my work. I love doing this, but it’s a one-man project and takes a lot of time and effort. All donations, no matter how small, are greatly appreciated and extremely helpful.
(About Donations)


