

Keep tabs on all the latest polling, articles and information ahead of the 2021 Scottish Parliament election in the Ballot Box Scotland Holyrood Hub!
The second part of Thursday’s polling double whammy, Panelbase have been remarkably quiet for the past while. After a spell of monthly polls, they’d been out of sight since early July. That was to a certain degree quite welcome given how dominant they’d become in the average, but we still need the occasional bit from them! They’ve delivered that with a poll running one day to either side of the YouGov, from the 5th to the 11th of November.
Display format for this post:
- Party/Option – Vote% (Change vs last poll by agency 30th of June – 3rd of July / vs last election or referendum)
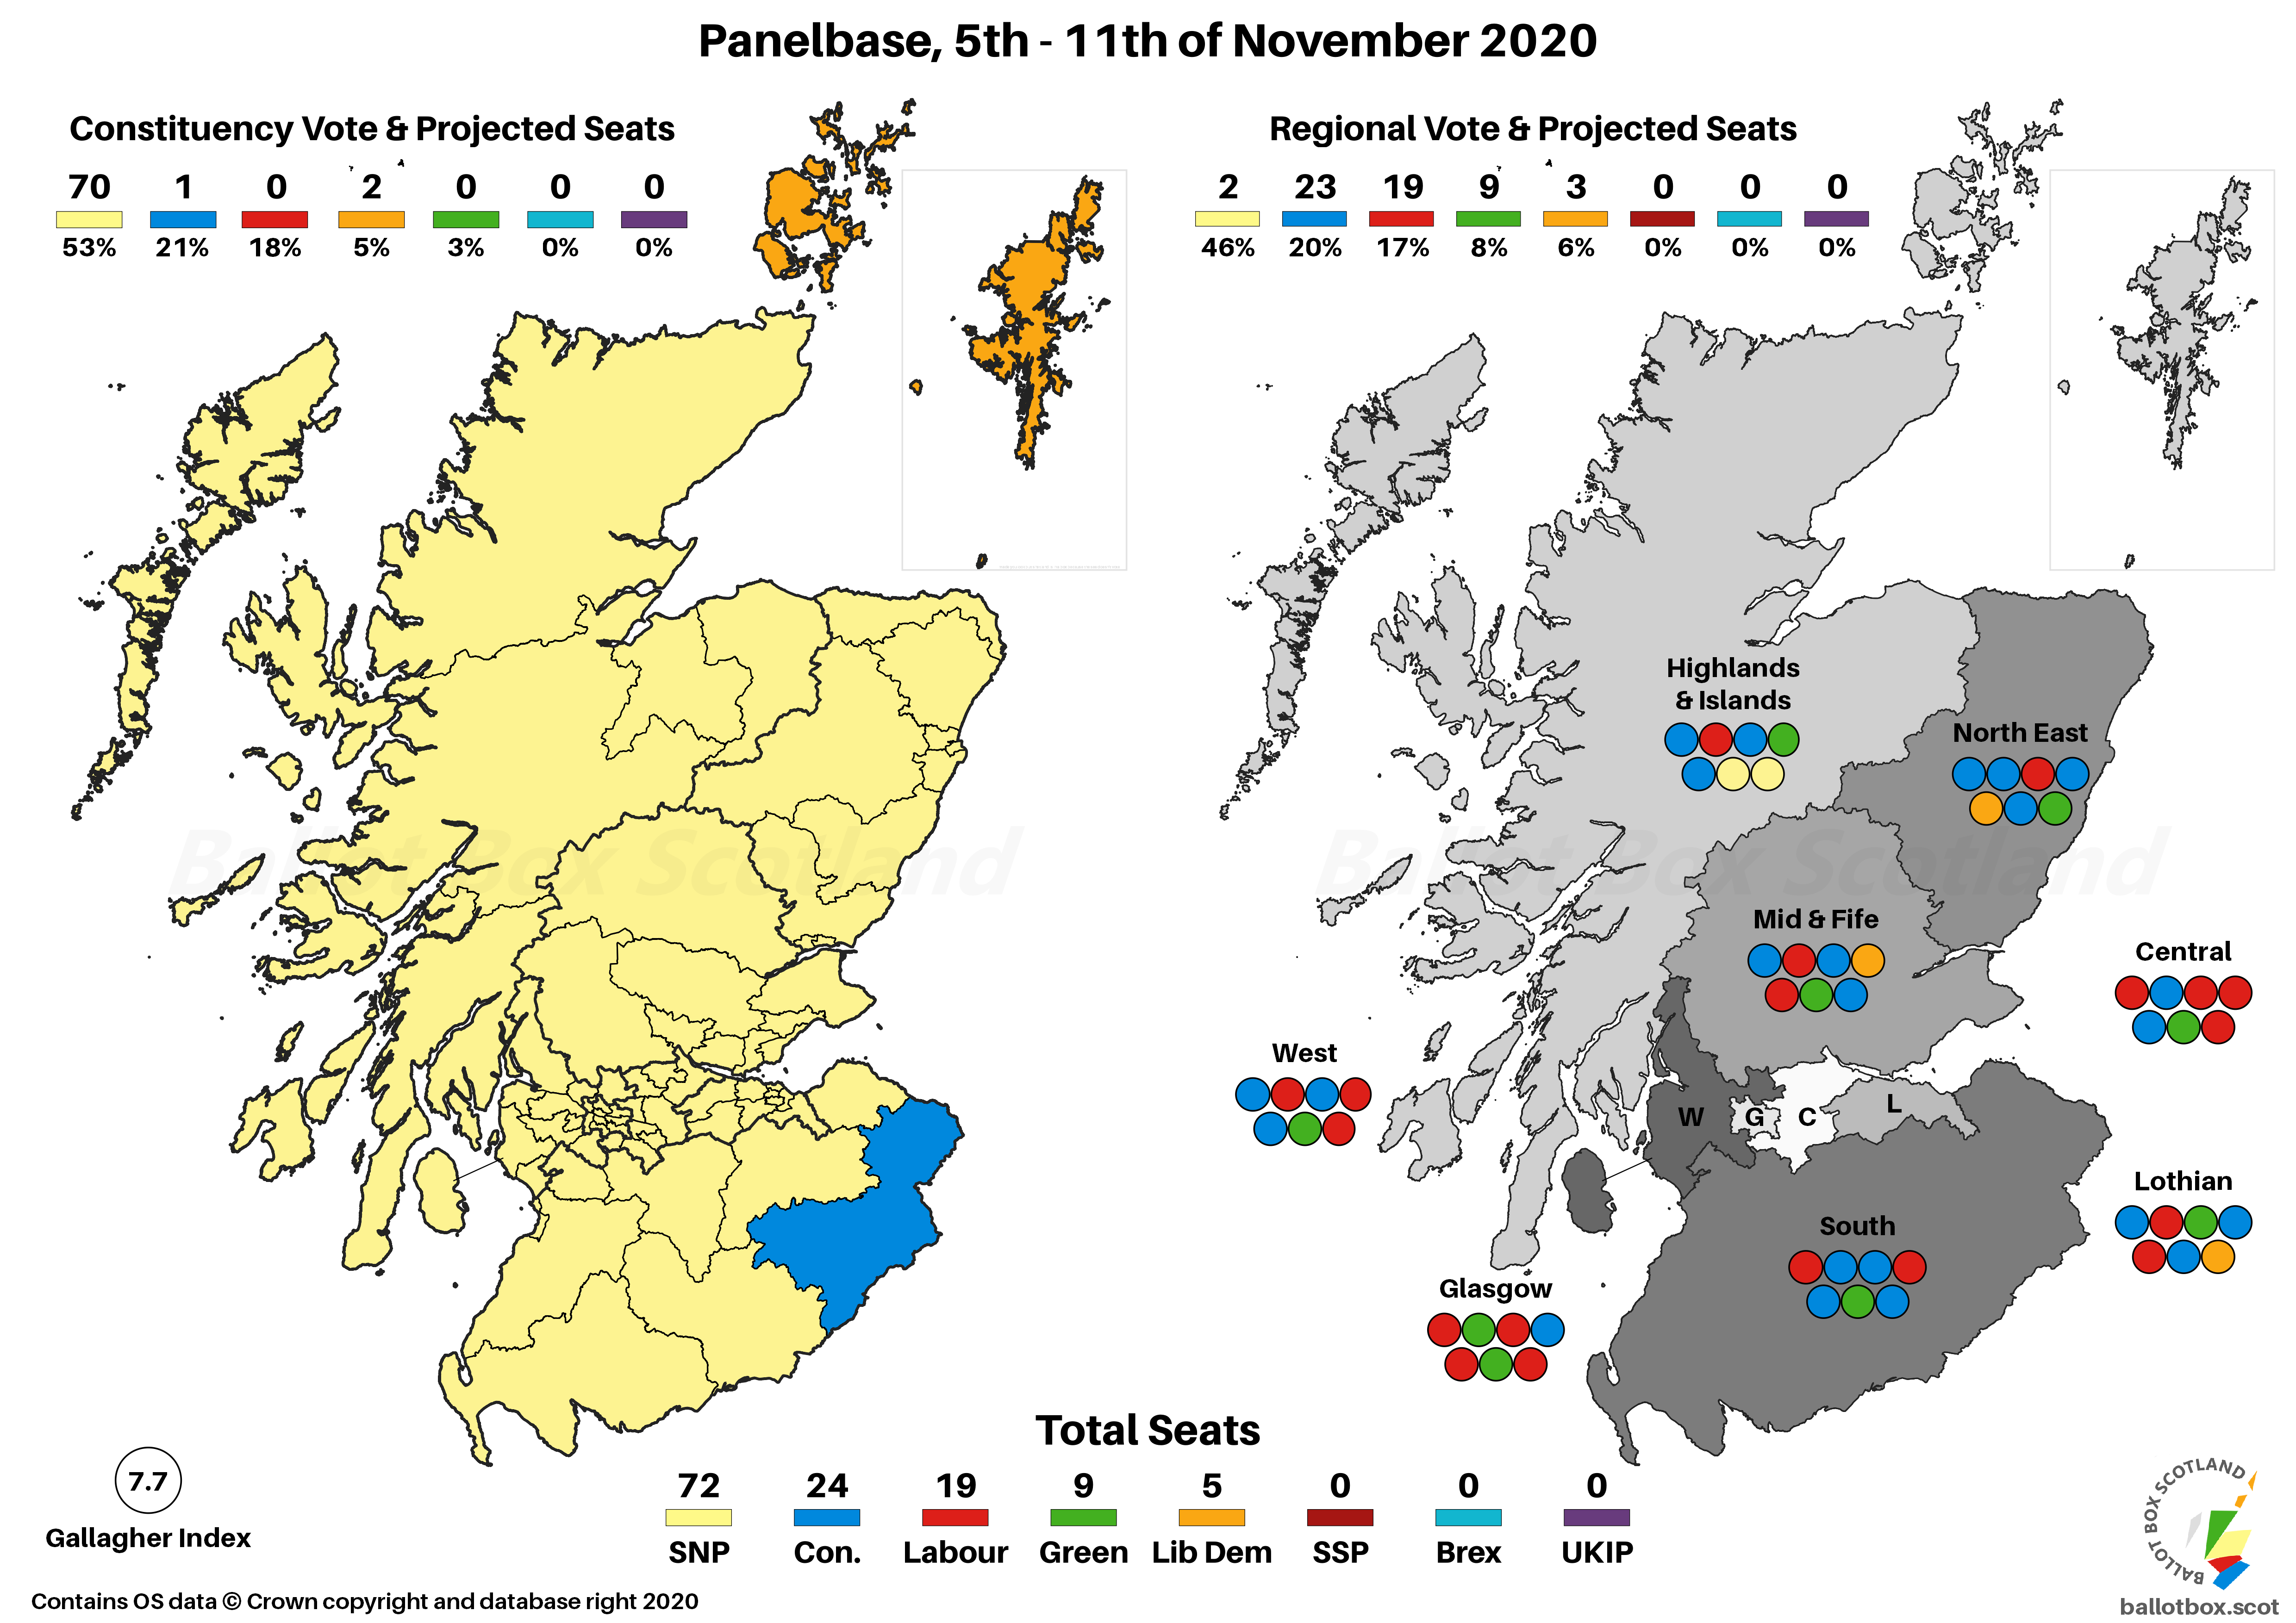
Regional Vote
SNP - 46% (-4 / +4)
Conservative - 20% (+2 / -3)
Labour - 17% (+2 / -2)
Green - 8% (nc / +1)
Liberal Democrat - 6% (nc / +1)
A smattering of reasonably weighty changes compared to the previous poll in this one. The SNP have one of, if not the, largest dip(s) in any recent poll at 4% down. It still has them comfortably above their 2016 result though, and Panelbase had been at the higher end of the polling for this ballot.
That’s balanced by gains of 2% apiece for the Conservatives and Labour. For the latter in particular this is the big difference with YouGov. Green and Lib Dem figures are largely comparable, both coming in below other recent pollsters. Panelbase have typically been the least favourable to the Greens though, so holding steady at the highest they’ve found suggests a trend in line with the other agencies.
Constituency Vote
SNP - 53% (-2 / +6)
Conservative - 21% (+1 / -1)
Labour - 18% (+3 / -5)
Liberal Democrat - 5% (-1 / -3)
Green - 3% (nc / +2)
A slightly more modest drop for the SNP here still has them with a clear majority of the vote. Labour are mounting a stronger recovery here as well compared to the last poll, though still notably down on 2016. The Lib Dems meanwhile drop back into what is their joint lowest figure since that election.
Panelbase do tend to find larger Green constituency votes which, given the party’s focus on the list vote, is very unlikely to come to fruition, but they aren’t far behind. Even if only in polling, dropping the Lib Dems to fifth on this vote too would be a shock.
Seat Projection
Please see this page for how projections work and important caveats.
SNP - 72 (-2 / +9)
Conservative - 24 (+1 / -7)
Labour -19 (+2 / -5)
Green - 9 (-1 / +3)
Liberal Democrat - 5 (nc / nc)

Unsurprisingly, yet another SNP majority projected out of this poll. Given they drop two seats and the Greens drop one, that does result in a small boost for the Pro-Union parties total, though still leaving a vast constitutional chasm of 81 vs 48.
SNP - 50% (nc / +5)
Conservative- 21% (+1 / -4)
Labour - 20% (+1 / +1)
Liberal Democrat- 5% (-1 / -5)
Green - 2% (+1 / +1)
A bit less movement on the Westminster figures here – the SNP static, Labour and Greens up a point, Conservatives and Lib Dems down a point. It’s not as bad as the 4% in the YouGov, but the Lib Dems haven’t come close to matching their 2019 performance in any poll since.
Standard Question
Yes - 51% (nc)
No - 40% (-2)
Don't Know - 9% (+2)
All the movement here is from No to Don’t Know, rather than between the options. Apart from the outlying Ipsos MORI poll, Panelbase have tended to find the highest Yes figures recently, being the only other pollster to find it with a majority even with Don’t Knows included.
Excluding Don't Knows
Yes - 56% (+1 / +11)
No - 44% (-1 / -11)
Take those Don’t Knows out though and that does give a very slight boost to Independence, bumping it up to the second highest figure this year. This is slightly above the polling average, but as already noted in the YouGov that was below average, so overall polling is basically static. The (totally arbitrary) 5-poll measure on my tracker went from 54.6% to 54.4% Yes as the net effect of these two.
Council Area Projection
Please see this page for how projections work and important caveats.

On a simple Uniform Swing versus 2014, this might put a total of 26 Councils in the Yes column, an increase on the 4 in 2014. That’d leave 6 for No, down from 28 at the referendum.
Hypotheticals
As ever, the last little bit of analysis concerns those hypothetical and more proportional voting systems that I have a bee in my bonnet about here at BBS. The fact Westminster uses pure FPTP is an affront to democracy, and though Holyrood fares far better, AMS is still deeply imperfect. The examples here simply transpose the poll findings onto more proportional voting systems – the reality is that different systems would of course result in different voter behaviour.
Changes here are vs AMS / vs same projection for the last poll.
SNP - 61 (-11 / -5)
Conservative - 26 (+2 / +2)
Labour - 23 (+4 / +3)
Green - 11 (+2 / nc)
Liberal Democrat - 8 (+3 / nc)

This does the usual thing of taking an SNP AMS majority and turning it into a minority, though still with a clear lead for Pro-Independence parties of 72-57. Unlike the YouGov, the Greens are proportionally meant to have 11 here, so the system has worked properly!

Scandinavian Style Westminster
Changes here are only versus the last poll, as I don’t do pure FPTP projections.
SNP - 31 (-1)
Conservative - 13 (+1)
Labour - 12 (+1)
Liberal Democrat - 3 (-1)

A slight majority of the above-threshold vote naturally translates to a majority of seats for the SNP, though as always far fewer than would be the case under FPTP.
If you find this or other Ballot Box Scotland output useful and/or interesting, and you can afford to do so, please consider donating to support my work. I love doing this, but it’s a one-man project and takes a lot of time and effort. All donations, no matter how small, are greatly appreciated and extremely helpful.
(About Donations)


