

Part two of the usual annual review takes us to Parliamentary polling. The big difference compared to last year is that, of course, we actually had a Scottish Parliament election in May. That was without a doubt the biggest and most exciting vote since Ballot Box Scotland launched in early 2018, and by far the most involved. You can remind yourself of the overall results here, or you can look back through the various in-depth articles I pulled together both before and after the election.
As always for these annual reviews, the assessment of where we’ve ended the year comes from averaging out the polls through the final quarter. That’s not ideal, but given the relative dearth of Scottish polling, it’s the best we have to go on. For Holyrood we have a total of four polls, all from different pollsters. Westminster is a bit different – though it also has four polls, they come from three different agencies, so there’s a doubler in there.
Updated 27th of December: Just to spite me personally, Opinium and the Sunday Mail published some polling data on Boxing Day. This included Westminster and Independence data, but not Holyrood. The Westminster section of this article has been updated accordingly.
All changes in this section are versus May’s election / versus Q4 2020.
Regional Polling Average Since Election
This isn’t an especially exciting chart to look at, as it obviously only covers the post-election period. For the flurry of polling before the election, which allowed a more nuanced averaging out of different pollsters rather than individual polls, you can check the Holyrood Hub. This isn’t as useful to include as part of the same series, as pollsters generally have to re-weight based on results and potentially re-assess methodologies based on learning after each election. Note that the average here is across the last 5 polls, whenever those were, so don’t match the quarterly average below.
Regional Poll Average Q4 2021
Let’s take this as three neat pairs, each conveniently with one party from either side of the constitutional divide. The first pair are the SNP and Labour, who basically haven’t budged from their May result. There are tiny changes shown here, but we’re talking fractions of a percentage point, well within margin of error. Versus the end of last year however, the SNP are down a fair bit, whilst Labour are up a smidge.
In the negative swing stakes we turn to the Conservatives and Alba. These are the two parties who have suffered clear decreases, just outwith the margin of error, so most likely very real. Alba continue to cruise towards just being utterly eliminated from regular coverage here on BBS, as they barely cling to existence.
On the other hand, the Conservatives might actually be getting off lightly in this average, as though we had some polls following the sleaze and second jobs episode, we haven’t had any since the Christmas Party revelations. For the meantime, they may take some consolation from being marginally ahead of where they were at the end of last year.
Our final pair are the Greens and Lib Dems. These are the parties likely to be happiest with their current polling on this ballot, showing reasonable increases since the election. In both cases these are just above margin of error (remember, that gets smaller the further away from 50% a polled share is) and are also higher than their average at the end of last year, more substantially so in the Greens’ case. That means although both parties have a bit of a tendency to poll better than they perform, they can be relatively confident they are currently on the up.
At this point, it might be worth talking about polling in the immediate aftermath of these parties joining the government. The spectre of the Conservative-Lib Dem coalition still haunts UK politics, and there was a degree of expectation that the Greens would mirror the Lib Dems with an immediate collapse after joining the cooperative government with the SNP.
Whilst 2026 is a long way off yet, thus far that doesn’t appear to be the case. Polling here runs to about three months after the Greens joined government. At the equivalent point in 2010 (mid-late August), the Lib Dems had already almost halved their support, dropping from 23% to around 13%.
It’s not that the Lib Dems are a bad comparison, but instead that people might be comparing with the wrong government. Remember, the Lib Dems spent the first two Holyrood terms in government with Labour. They started that period with 17 seats and ended with 16, so didn’t seem to suffer much at all for being the junior partner.
My theory is that whereas Lab-LD was an expected pairing, Con-LD was not, and that’s why the latter caused collapse. Labour and the Lib Dems had cooperated closely to deliver devolution in the first place, and had developed something of a united, anti-Conservative front in Scotland by the 90’s. Given similar constitutional alignment and budget deals every year of the last term, SNP-Green is almost certainly a similarly expected partnership in voters’ eyes.
Constituency Polling Average Since Election
Constituency Polling Average Q4 2021
On the constituency side of things we are staying rather more within the bounds of error overall, though here it’s only the Lib Dems with a tiny fractional change we can discount entirely, and only a slightly higher gain versus the end of last year. Both the SNP and Greens are up by about a point compared to May, though for the SNP that represents a heavy decline from the end of last year. Back then they appeared to be in the peak of a pandemic confidence bounce, which has long since dissipated.
For the Greens, I’m increasingly of the view there isn’t much use in their constituency polling figures. On the one hand, it often overestimates what they’d win nationally given their limited range of contests – only 12 of 73 constituencies this year. On the other, it almost certainly underestimates what they’d win if they did contest them all – they won 7.8% across the 12 they did stand, and my rough estimate extrapolating that nationwide is in the region of 5.5% to 6%.
In terms of losses, there are decreases of about 2% for both the Conservatives and Labour on this ballot. If this did happen at an election it’s the kind of shift that could flip a constituency or two, which would further reinforce the SNP’s dominance of the FPTP element of AMS. Compared to last year though Labour are still much healthier, whereas the Conservatives are a little bit worse off.
Seat Projection
Projecting these averages into seats might give us something like this:
Please see this page for how projections work and important caveats.
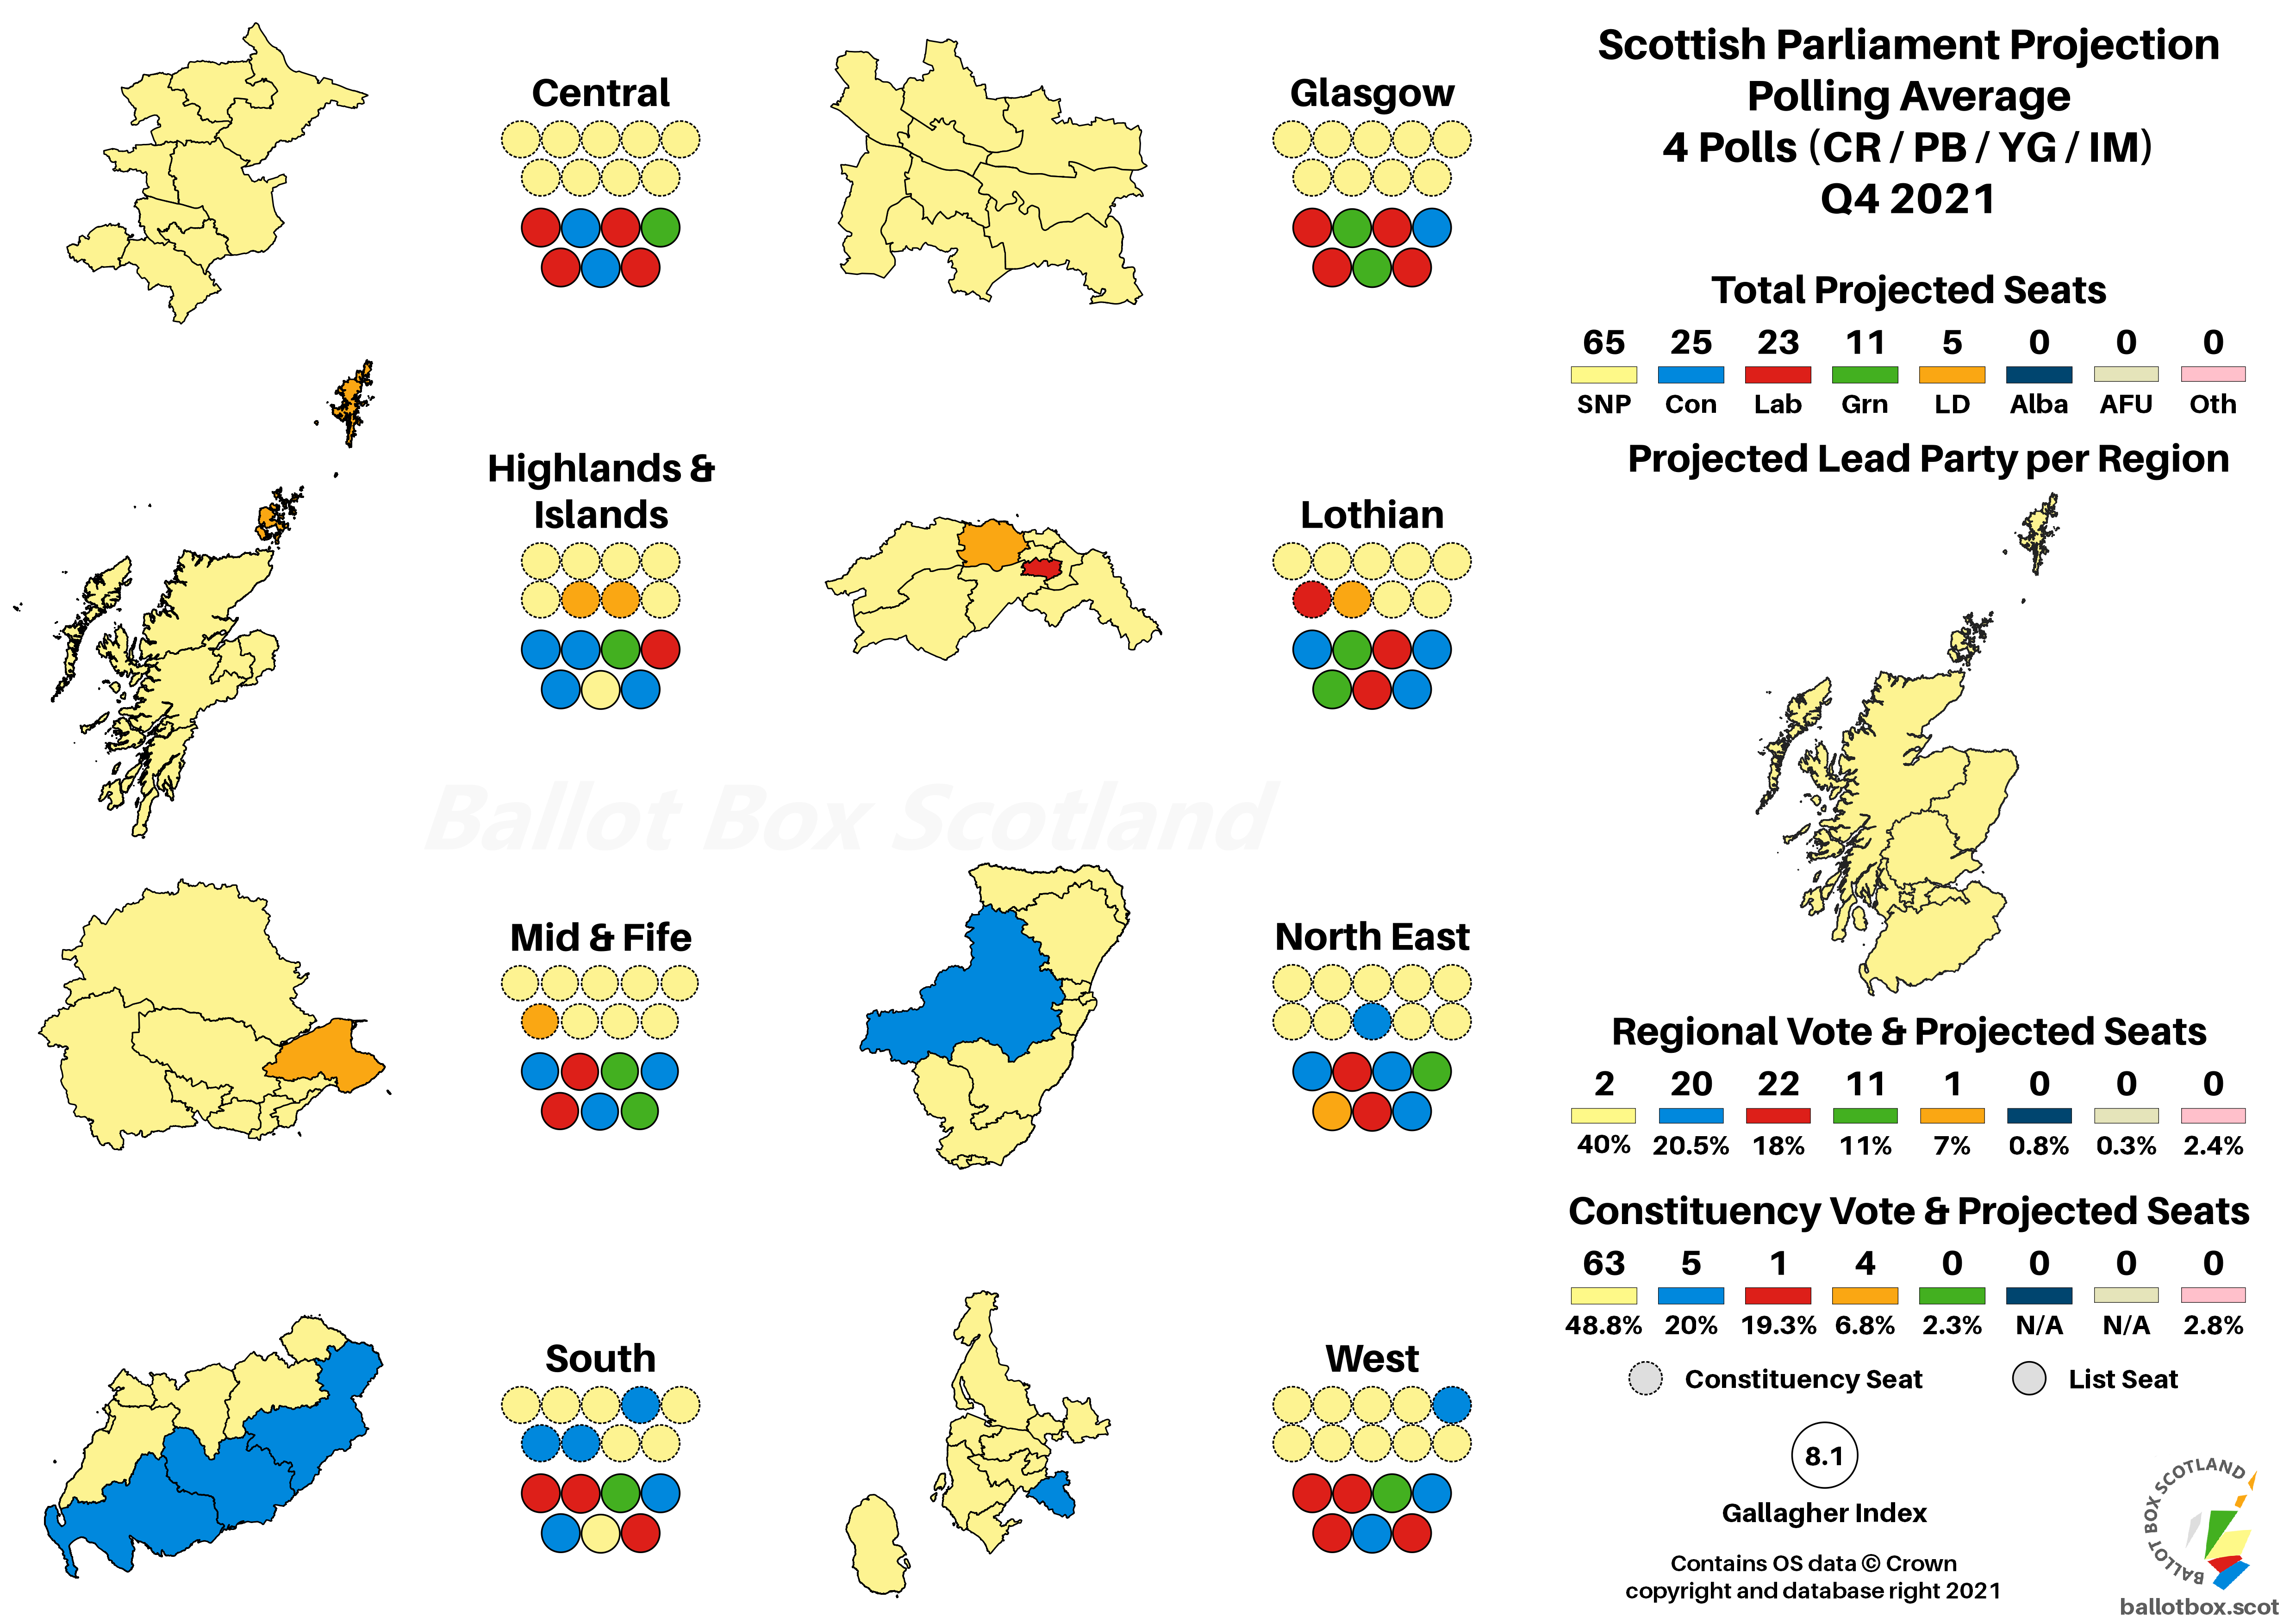
Those constituency shifts are what narrowly seal an SNP majority here, bang on the bare minimum 65 seats – though at the end of last year they looked on track for a much bigger one. The decisive seat here is Dumbarton which likewise spent much of the last term looking like Labour would lose it, but Jackie Baillie is a proven survivor, so at this point I’m far more inclined to bet for than against her. However, model says what model does.
Since the Conservative vote has the largest dip that naturally leads to them shedding a few seats, which allows Labour to squeak a net gain versus the election in this projection. Both are better off than their gloomy polling towards the end of last year, especially Labour.
The Lib Dems similarly make a gain, returning to the North East. Overall it’s the Greens making the largest gains with three extra seats, or one more than their end of 2020 estimate, though they’d no longer be necessary for a governing majority. Both parties are a hair’s breadth from further gains though, with the Greens next in line for a list seat in three regions, and the Lib Dems in two.

As is so often the case with this particular model, despite the additional seats up for grabs none of them go to the SNP. Equalising the proportional element with the FPTP side would help even things out to the benefit of the other parties.
There would still however be a pretty comfortable majority for the SNP-Green cooperative government, with 81 seats to the 64 for the pro-Union bloc. That’d be a net gain for the government compared to what they’d have had in this model in May, with only the Lib Dems gaining amongst the opposition parties.
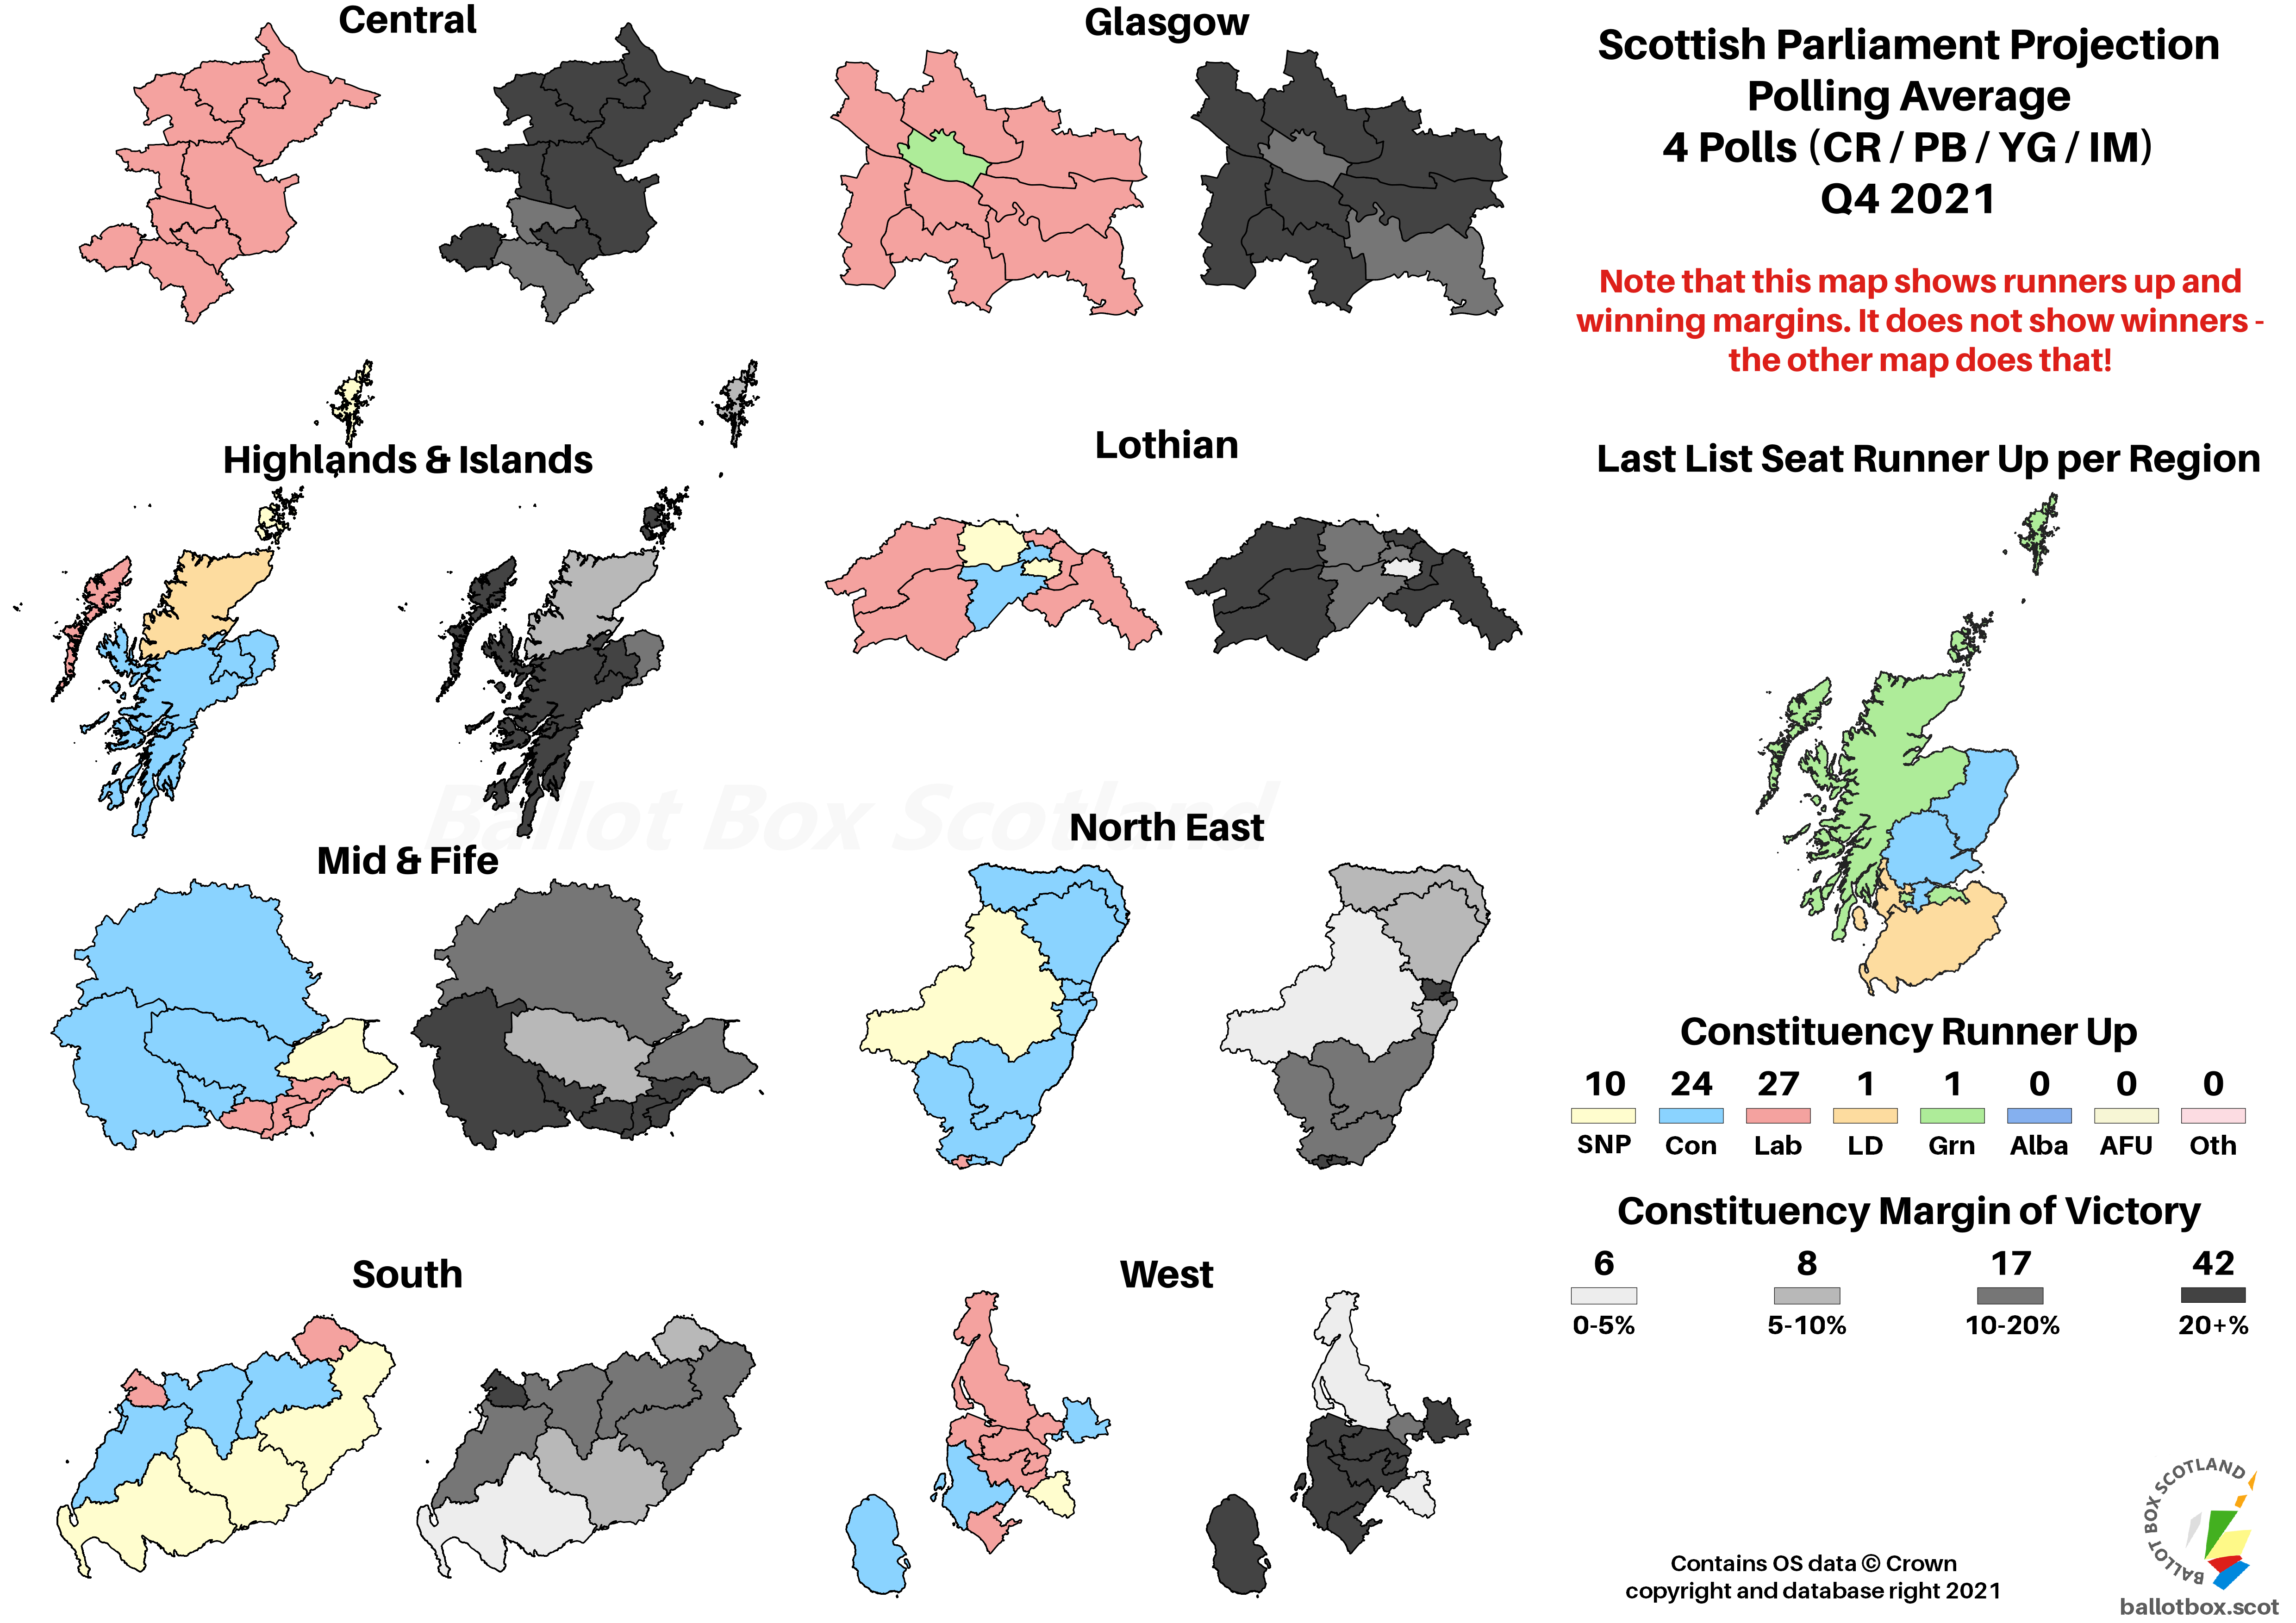
As an annual review treat I’ve also popped this onto an actual map. I’d stopped doing these maps for the hypothetical (or rather, even more hypothetical) parts of polling analysis pieces, given how time consuming they are. Since this is the once in a year review piece, it seemed like a good place to give you the full “and this is what you could have won” experience.

Turning to the even more proportional model, we find a slightly different story again. It’s still a boosted majority for the cooperative government, but that’d come entirely from Green gains, whilst the SNP move backwards compared to May. On the opposition benches, it’s the same story of decline for the Conservatives and gains for the Lib Dems, but Labour complete a full set of projected outcomes through different models, as they’d be completely static.
These don’t come with attached maps or commentary, as that would be pure chaos. Instead, these just give an indication of a range of different models, demonstrating how important electoral design is to the final outcome.
Westminster Polling Average Through 2021
Although we can look back over the whole year for Westminster since it wasn’t interrupted by a pesky election, it’s also not especially exciting. Most parties are roughly where they were at the start of the year, though what was a very narrow Labour lead over the Conservatives has flipped to an even narrower lead for the Conservatives. Otherwise, it’s the same big SNP lead as you’d expect based on Holyrood polling.
Westminster Poll Average Q4 2021
Changes here are versus Q4 2020 / versus 2019 election.
Again, bear in mind this quarterly average has one fewer poll in it than the rolling five-poll average in the time series above. That means that Boxing Day poll showing Labour making solid gains at the Conservatives’ expense in light of recent events has a bigger impact on the overall figure.
It’s big enough, in fact, to squeak Labour into second place for this quarter. That makes them the only party bar the Greens, who frankly don’t matter for Westminster, to have gained both versus last year and the 2019 election. Although the Conservatives are up oh-so-marginally compared to the final quarter of 2020, it’s still a huge slump on what they achieved at the election.
The SNP and Lib Dems meanwhile have mixed figures, up on one measure and down in the other. For the SNP it’s perhaps the better way round, which is lower than their pandemic peak, but improving versus the last election. Less positively for the Lib Dems, a recovery from last year’s very poor figure still has them heavily adrift of their 2019 share.
Usual reminder here that I don’t do pure FPTP projections – however, for annual reviews, I have tended to refer to Electoral Calculus just for an indication. That suggests an SNP clean-sweep of all 59 seats, which I have to say definitely feels like an error in their modelling. At the very least I can’t imagine how Edinburgh South could possibly change hands in this scenario.
Less of an issue with modelling and more one of thinking how elections would actually go, even with the Conservatives being down on their 2019 result I reckon they’d hold two or three of their seats, whilst the Lib Dems are likely to have bedded in very firmly in at least two of theirs. Hazarding a more precise guess might be something like 52 SNP, 3 each for Conservative (the two covering the Borders plus Banff and Buchan) and Lib Dem (their current haul except Caithness, Sutherland and Easter Ross), and 1 Labour (obvious).
Scandinavian Style Westminster

As you’d expect, a proportional version of Westminster couldn’t possibly give an (almost) complete SNP sweep, much more accurately and democratically modelling to 30 seats here. That’s still just a majority of Scotland’s MPs, mind you.
Compared to where the parties were last year, that represents a shift of a single seat from the SNP over to Labour, reflecting a bit of a recovery from recent lows for the latter and overtaking the Conservatives. That’d also make them the only party on the pro-Union side of the constitutional divide to make any gains.
Remember this is just a snapshot of the picture at the end of 2021. For Holyrood especially, there’s a long way to go until the next election. Expect all kinds of twists and turns in politics, and in polling, between now and then. Speaking of twists and turns, there’s one final bit of this review – and of BBS’ 2021 output overall. Keep an eye out for that in the next couple of days, where we’ll be looking at polling on the big constitutional question.
If you find this or other Ballot Box Scotland output useful and/or interesting, and you can afford to do so, please consider donating to support my work. I love doing this, but it’s a one-man project and takes a lot of time and effort. All donations, no matter how small, are greatly appreciated and extremely helpful.
(About Donations)


