

For the second entry in our usual end of year wrap up, let’s dive into parliamentary polling. This is the first full year since the 2021 Scottish Parliament election, and so the first one where we can track opinion across a whole year and compare with an election result. Hopefully, unlike last year, I won’t have any other papers or pollsters deciding the last week of the year is when they desperately need to get out any further data… (Edit: Hahah, nope, there was a late release of data, which I only remembered to address when it came to writing the 2023 review. I’ve changed this piece to fit, but it’s irritating as despite the marginal shifts it was quite impactful.)
As a reminder, these annual reviews work on the basis of averaging out polling across the final quarter. Obviously, that’s not ideal, but given how much variability there is in the number of polls each year, I’ve opted for being able to compare over the same window of time each year. For Holyrood, we had a total of six polls through the past three months – two apiece from YouGov and Savanta, plus one each from Ipsos and Panelbase. Westminster has an additional Panelbase plus a Redfield & Wilton, for a total of eight polls. All changes are versus Q4 2021 / versus previous election. (Edit: The late data release was Panelbase, so it’s two Panelbases.)
Regional Polling Average Through 2022
Undoubtedly the most interesting aspect of this chart is following the Labour and Conservative lines. The fact the Conservatives seemingly started the year ahead of Labour is more to do with this simple 5-poll average measure than actual reality. What you can see here is all the damage that was done at the very end of 2021 (sleaze, corruption, lockdown parties – there was a lot on!) slowly filtering into the average. By the time it’s exclusively including 2022 polls, Labour have clearly overtaken the Conservatives.
This seems to settle into a roughly 3% advantage by the time of the local elections in May, and that persists right through Boris Johnson being dragged kicking and screaming from Number 10 in the summer. It’s only when the Mini Budget, may it rest in peace along with Liz Truss’ premiership, enters the scene that a further Conservative slide takes place, leading to an eventual ~8 point gap between the two parties. Remember though that as this is a 5-poll tracker and the next section is quarterly, the two figures don’t entirely match up.
Regional Poll Average Q4 2022
Looking at where we stand across the quarter, and the SNP are a little bit down from this time last year, where they’d been basically unchanged since the election. This is a relatively minor slump however, and it’s worth bearing in mind the SNP have a real tendency to weaken in between Scottish Parliament elections then bounce back for a clear victory. It’s never guaranteed they will do so, but be aware of the pattern.
Labour are ending the year on a high note, having recovered enormously since the election. Indeed, this equates to having grown their vote by roughly a third. It’s still below their pre-referendum worst (26.3% in 2011), but when combined with a Conservative collapse of a similar magnitude, losing about a third of their vote since the election, it puts them very comfortably in position to reclaim second place at the next election if they can keep this up.
There’s been much less movement for both the Greens and Lib Dems, with both up by not even a full percentage point since the end of last year, though more strongly since the election. For the Greens this represents the best polling in their history, confounding some expectations they’d be damaged by entering government. I wrote a little on that topic in last year’s entry, about how I didn’t think that was ever likely to be the case – in short, the SNP-Green pair up was like the 1999 Labour-Lib Dem coalition, not the 2010 Conservative-Lib Dem one. That analysis continues to be thoroughly vindicated, it seems.
Constituency Polling Average Through 2022
In all honesty, analysis of the Constituency trend through the year would be largely repeating what I said about the Regional (“what’s interesting is what has happened to the Labour and Conservative votes”), so just imagine me saying that again.
Constituency Poll Average Q4 2022
The SNP decrease is substantially lower on this vote, and is in fact basically unchanged relative to the election. Whereas for most other parties it’s the list that matters most, the SNP hold on government is easier to maintain when they’ve got a strong constituency vote, so in that sense they’ll be quite content with this.
Meanwhile, it’s a similar story Labour and the Conservatives as on the other vote – big gains for Labour, a woefully poor figure for the Conservatives. The Lib Dems are up very slightly too, whilst the Greens are down a touch. Again re-emphasising a Green note from last year, that’s partly down to not all pollsters asking for the Greens on this question, and it’s difficult for them to get Green support “correct” – those that do ask sometimes have a figure that’d be too high when considering where Greens have historically stood in constituencies, but too low relative to what they get when they do.
Seat Projection
Projecting that into seats might give us something like this:
Please see this page for how projections work and important caveats.
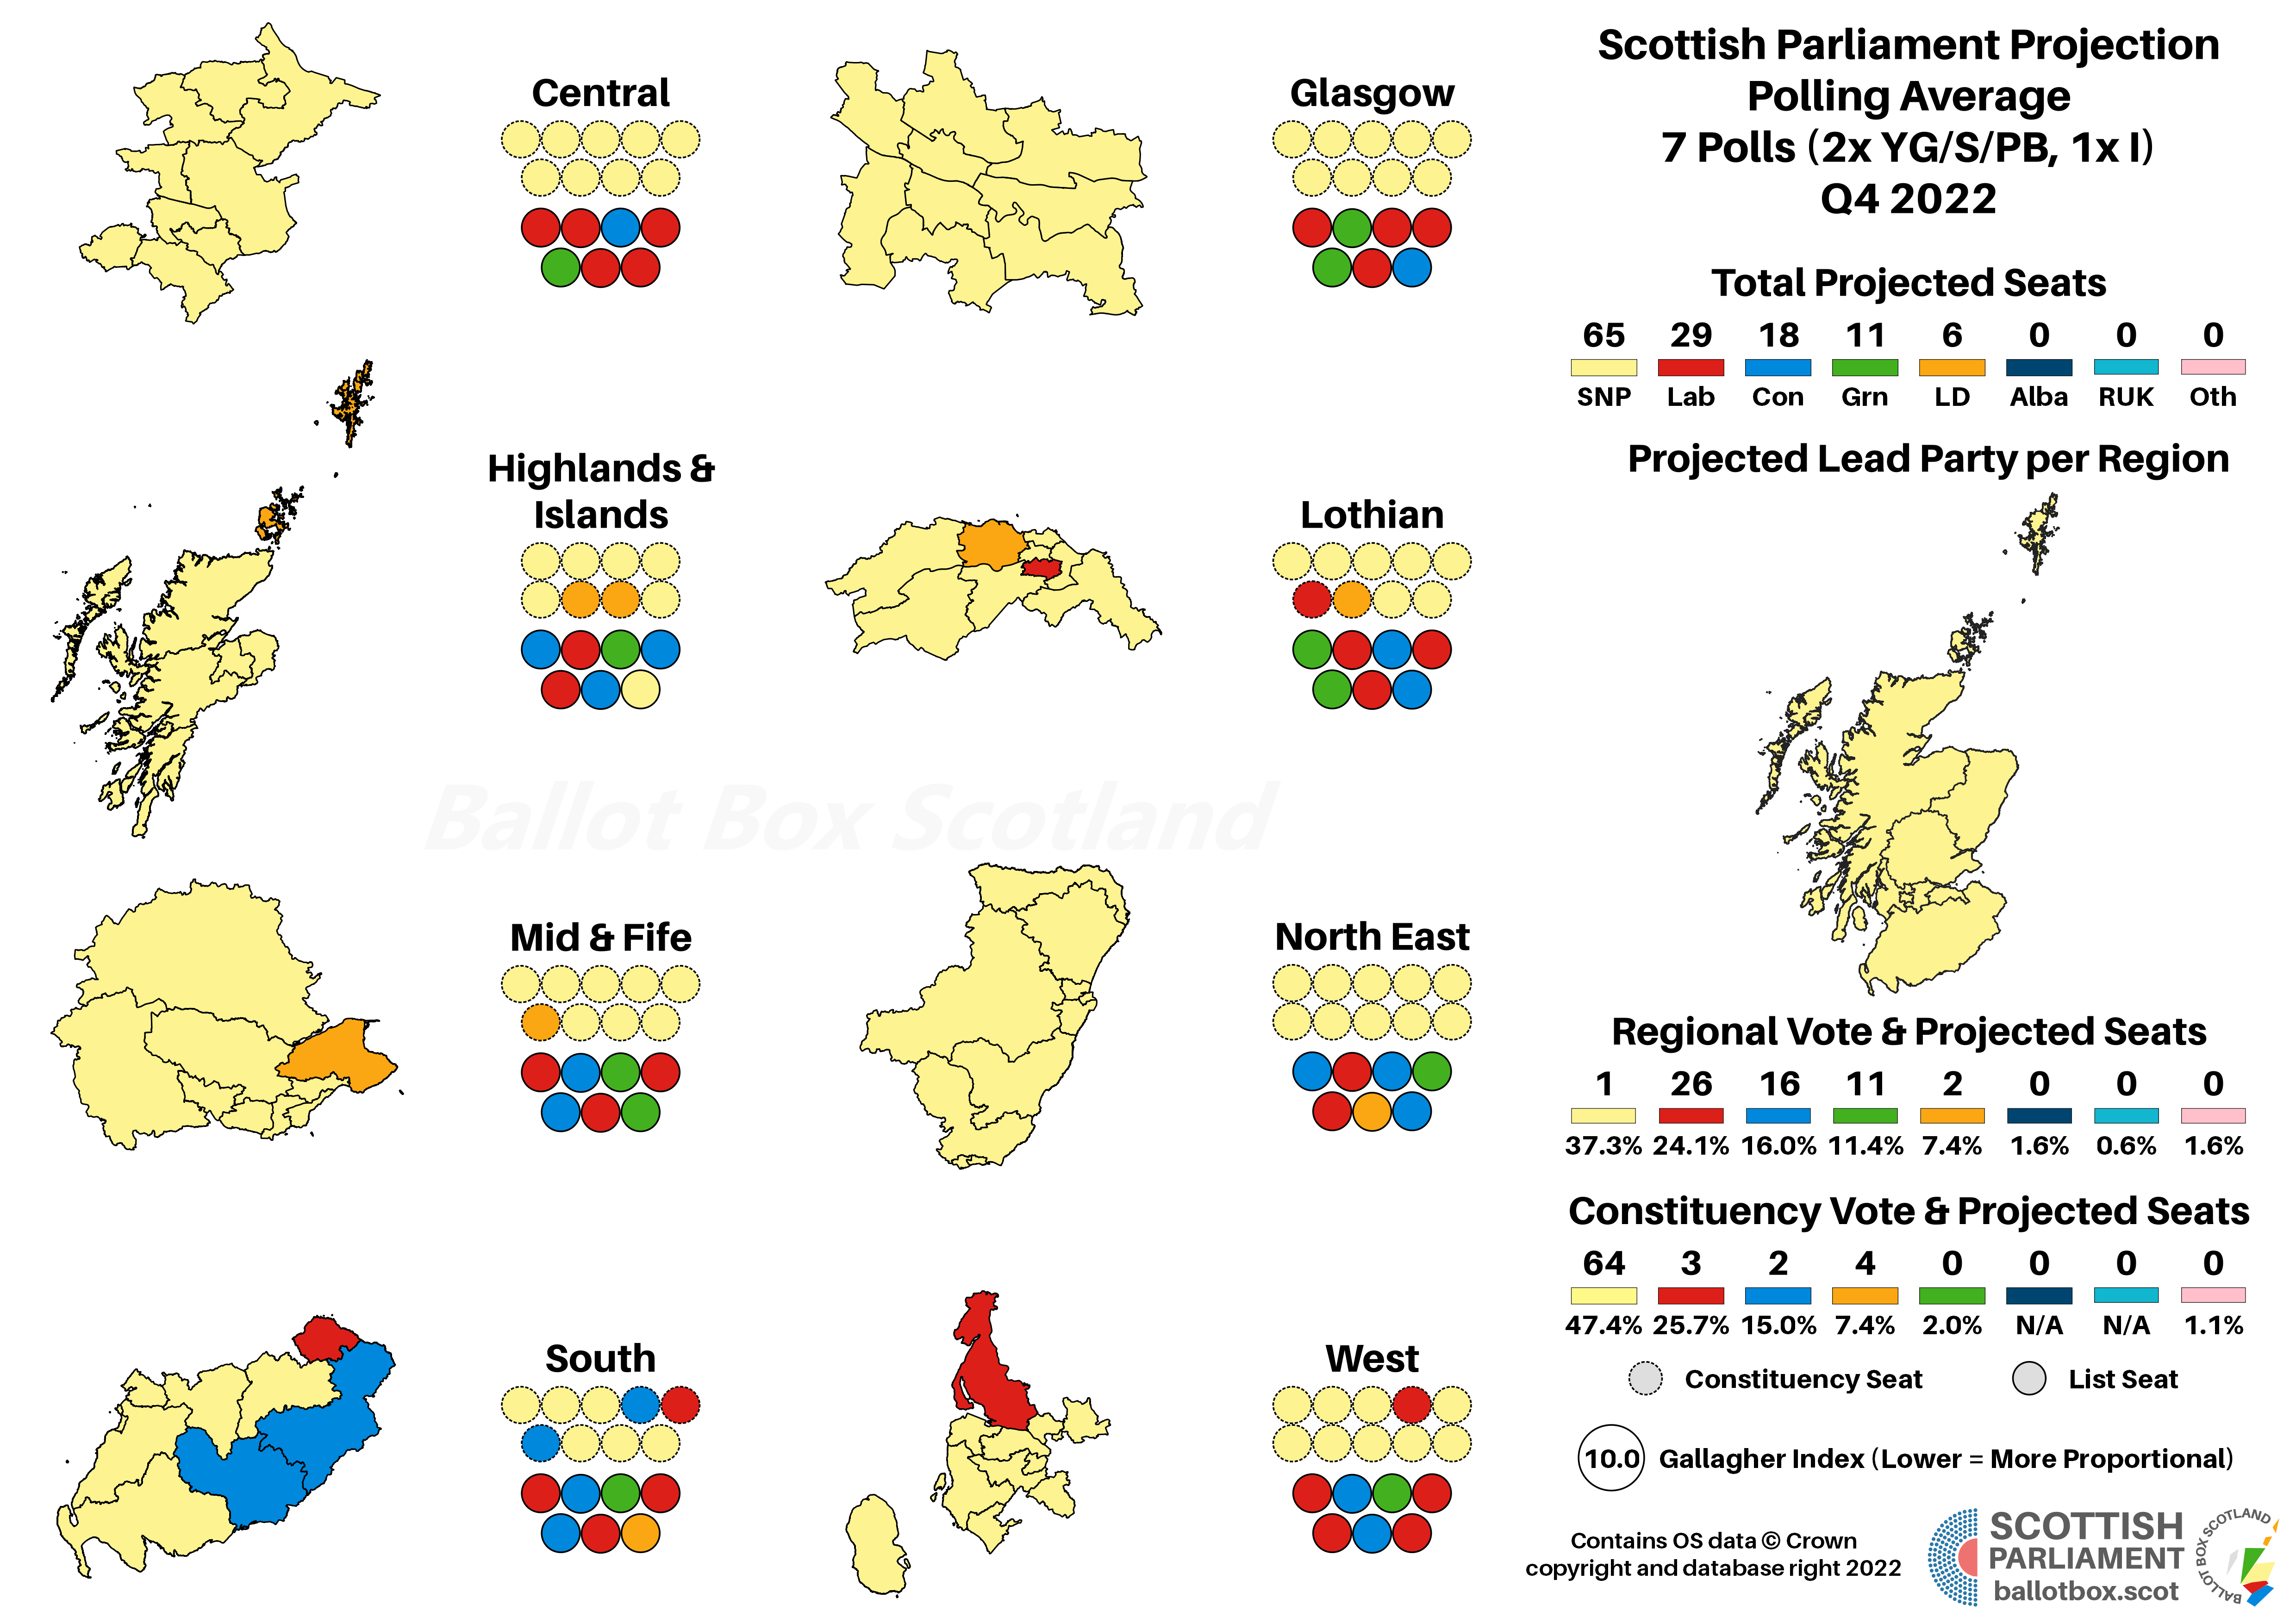
Emphasising that point about how much the constituency vote matters to the SNP, they remain completely dominant and one seat short of a majority on constituencies alone. They manage to make up that majority via a single list seat in the Highlands and Islands, matching their Q4 2021 tally. That is however the difference between the barest majority and the same minority they won in May last year. Given the Greens are unchanged versus last year’s projection, and that was up four compared to the election, there’d be a comfortable majority for the co-operative government between the two Pro-Independence parties than at present. They’d have 76 seats to the 53 for Pro-Union parties. (Edit: This is where the key difference after integrating the missing poll comes from; flipping a seat from the Greens to the SNP.)
Amongst those three other parties, there’s almost a direct transfer from the Conservatives to Labour since last year. Labour are projected to win almost twice as many seats as the Conservatives, who would barely exceed their second-worst ever haul in 2007. Conservative weakness also helps to slip an extra seat the Lib Dems’ way relative to last year, a gain of two compared to the election.

Turning, as I so enjoy doing, to the hypotheticals, we first look at a reformatted version of AMS. This maintains the same constituency seats as the real system does, but adds a further 16 list seats, divvied up between redrawn regions and with one per region allocated based on the national vote. This gives a more proportional outcome without massively changing the workings of the system. Although these maps are too fidgety to do for every post, you do get them as a Christmas treat to see how they shake out.
Unlike AMS-as-is, this ends up with a slight change for the SNP and Greens since last year, dropping one seat to the Pro-Union bloc though there’s a net gain (mostly to the Greens) of 5 seats relative to the May 2021 outcome in this model. That would help ensure the government’s re-election. The Lib Dems are also unchanged versus last year, meaning the rest of the movement since then is from Conservative to Labour.

If we get rid of the FPTP element entirely, replacing it with a more fully proportional model, the SNP advantage further erodes. As they’ve lost support on the list since last year, they would be down three seats. Adding the unchanged total for the Greens gives the barest majority possible of of 65 to 64, making the government three-for-three on imaginary re-elections. As you’d expect given the vote patterns, it’s again the Conservatives who are losing out the most, to Labour’s benefit.
No wonk-y analysis for this chart, it’s just a visualisation of a range of different changes we could make to the voting system, and how those might pan out on current figures.
Westminster Polling Average Through 2022
Looking at Westminster throughout the year, and it shouldn’t surprise anyone to see the same sort of outlines as in the Holyrood constituency vote, with that spanner-shape to the Labour and Conservative votes after the mini budget. One thing that’s more evident here than in the other charts though is how the Lib Dems seemed to gain from the earlier phase of Conservative difficulty, before dropping back down as Labour surged. Again, remember this is a five-poll average, so the final figure differs from what is about to be covered below.
Westminster Poll Average Q4 2022
Here, the SNP have notably slipped from where they were at the end of 2021, but it’s barely below their 2019 result. That means despite big gains for Labour, into the double-digits relative to 2019, the SNP are still far enough ahead it’s hard to see all that many seats changing hands. By contrast, the Conservatives take such a blow that they end up on a par with their worst ever vote share in 2015. That means most, if not all, of their seats would be in the firing line. Finally, the Lib Dems are largely unchanged since last year, but that represents a significant decrease compared to the election. Unlike the Conservatives, given how concentrated that’s likely to be in their key constituencies, it might not be too harmful for them.
One particular point I want to pick up on is how this is easily the strongest part of polling for Labour at the moment. Whereas they were 8.4% ahead of the Conservatives on the Holyrood Regional vote and 11% on the Holyrood Constituency, at Westminster it’s 14.5%. Their gap with the SNP is also notably smaller at -15% than for the Holyrood Constituency vote, where it’s -21.5%. What this may suggest is a partial return to the norm around the very early 10’s, when voters proved much more willing to vote Labour at Westminster and SNP at Holyrood.
It’s possible that some SNP (and Green) voters are eyeing up Westminster with an increasing view towards chucking the Conservatives out rather than as a constitutional proxy. If so, that’s a double-edged sword for both sides. It diminishes the prospect of meeting the stated threshold for a “de facto referendum” and boosts Labour’s prospects at Westminster, but it doesn’t actually mean those voters giving up support for Independence and that they wouldn’t comfortably re-elect an SNP-Green government at Holyrood. Though parties and politicians are loathe to admit it, the Scottish electorate can be a messy lot, and this might be the beginning of a particularly confusing period.
As ever, I avoid doing detailed projections when we’re dealing purely with FPTP. Annual reviews are my one partial break with that policy, when I refer to Electoral Calculus for an indication. They reckon this comes out at 52 SNP, 5 Labour and 2 Lib Dem, versus the clean 59-seat SNP sweep they suggested from last year’s final quarter figures. If we run the numbers for the proposed new boundaries, with two fewer seats up for grabs, the split is instead 51 SNP, 5 Labour and 1 Lib Dem.
That’s probably not too far off reality, though I personally figure the Conservatives are so embedded in the Borders they’ll hold at least one seat. Likewise, the Lib Dems should have North East Fife on lock by this point, which would give them 3 seats.
Scandinavian Style Westminster

Just like Holyrood though, I do always like to look at Westminster if it wasn’t mortifyingly, miserably, indefensibly undemocratic. Applying a highly proportional model to these figures would give a much more modest haul for the SNP. A quirk of vote distribution means that’d actually give them one seat more than the model suggests for 2019, but it’s two less than last year when they were just scraping a majority of seats. (Edit: Unlike Holyrood, the slight difference in vote shares after incorporating the missing poll didn’t change any seats here, so I haven’t bothered with the marginal tweaks to the graphic above.)
No prizes though for guessing that most of the difference is Labour making big gains at Conservative expense. Since they’ve got twice the vote, they get twice the seats, as the Conservatives dip into single-digits. That’s where the Lib Dems live, unchanged since last year and down two versus 2019. It’s also where I guarantee you the Greens would live in reality, given PR would free them of the tactical deflation in their vote, certainly enough to get three or four seats.
And that’s a wrap for 2022’s parliamentary polling! There’s one more part of the annual review left here on Ballot Box Scotland though. Tomorrow I’ll be desperately squeezing out a Christmas Eve delivery that goes through constitutional polling for the year, so don’t pack your political brain away for the holidays just yet!
If you find this or other Ballot Box Scotland output useful and/or interesting, and you can afford to do so, please consider donating to support my work. I love doing this, but it’s a one-man project and takes a lot of time and effort. All donations, no matter how small, are greatly appreciated and extremely helpful.
(About Donations)


