

Keep tabs on all the latest polling, articles and information ahead of the 2021 Scottish Parliament election in the Ballot Box Scotland Holyrood Hub!
The other part of our Sunday double whammy of polling came from BMG. They (or rather, the folk who tend to commission them) have been one of the less prolific pollsters over this term, this being only their third published poll – Panelbase published more than that in April alone! That diversity is nonetheless welcome, especially as this gives us another pollster in the Alba era.
Tables for this aren’t yet available, but the election is in three (!!!) days, so I can’t really wait any longer to roll this one out.
Display format for this post:
- Party/Option – Vote% (Change vs last poll by agency 16th – 19th of March / vs last election or referendum)
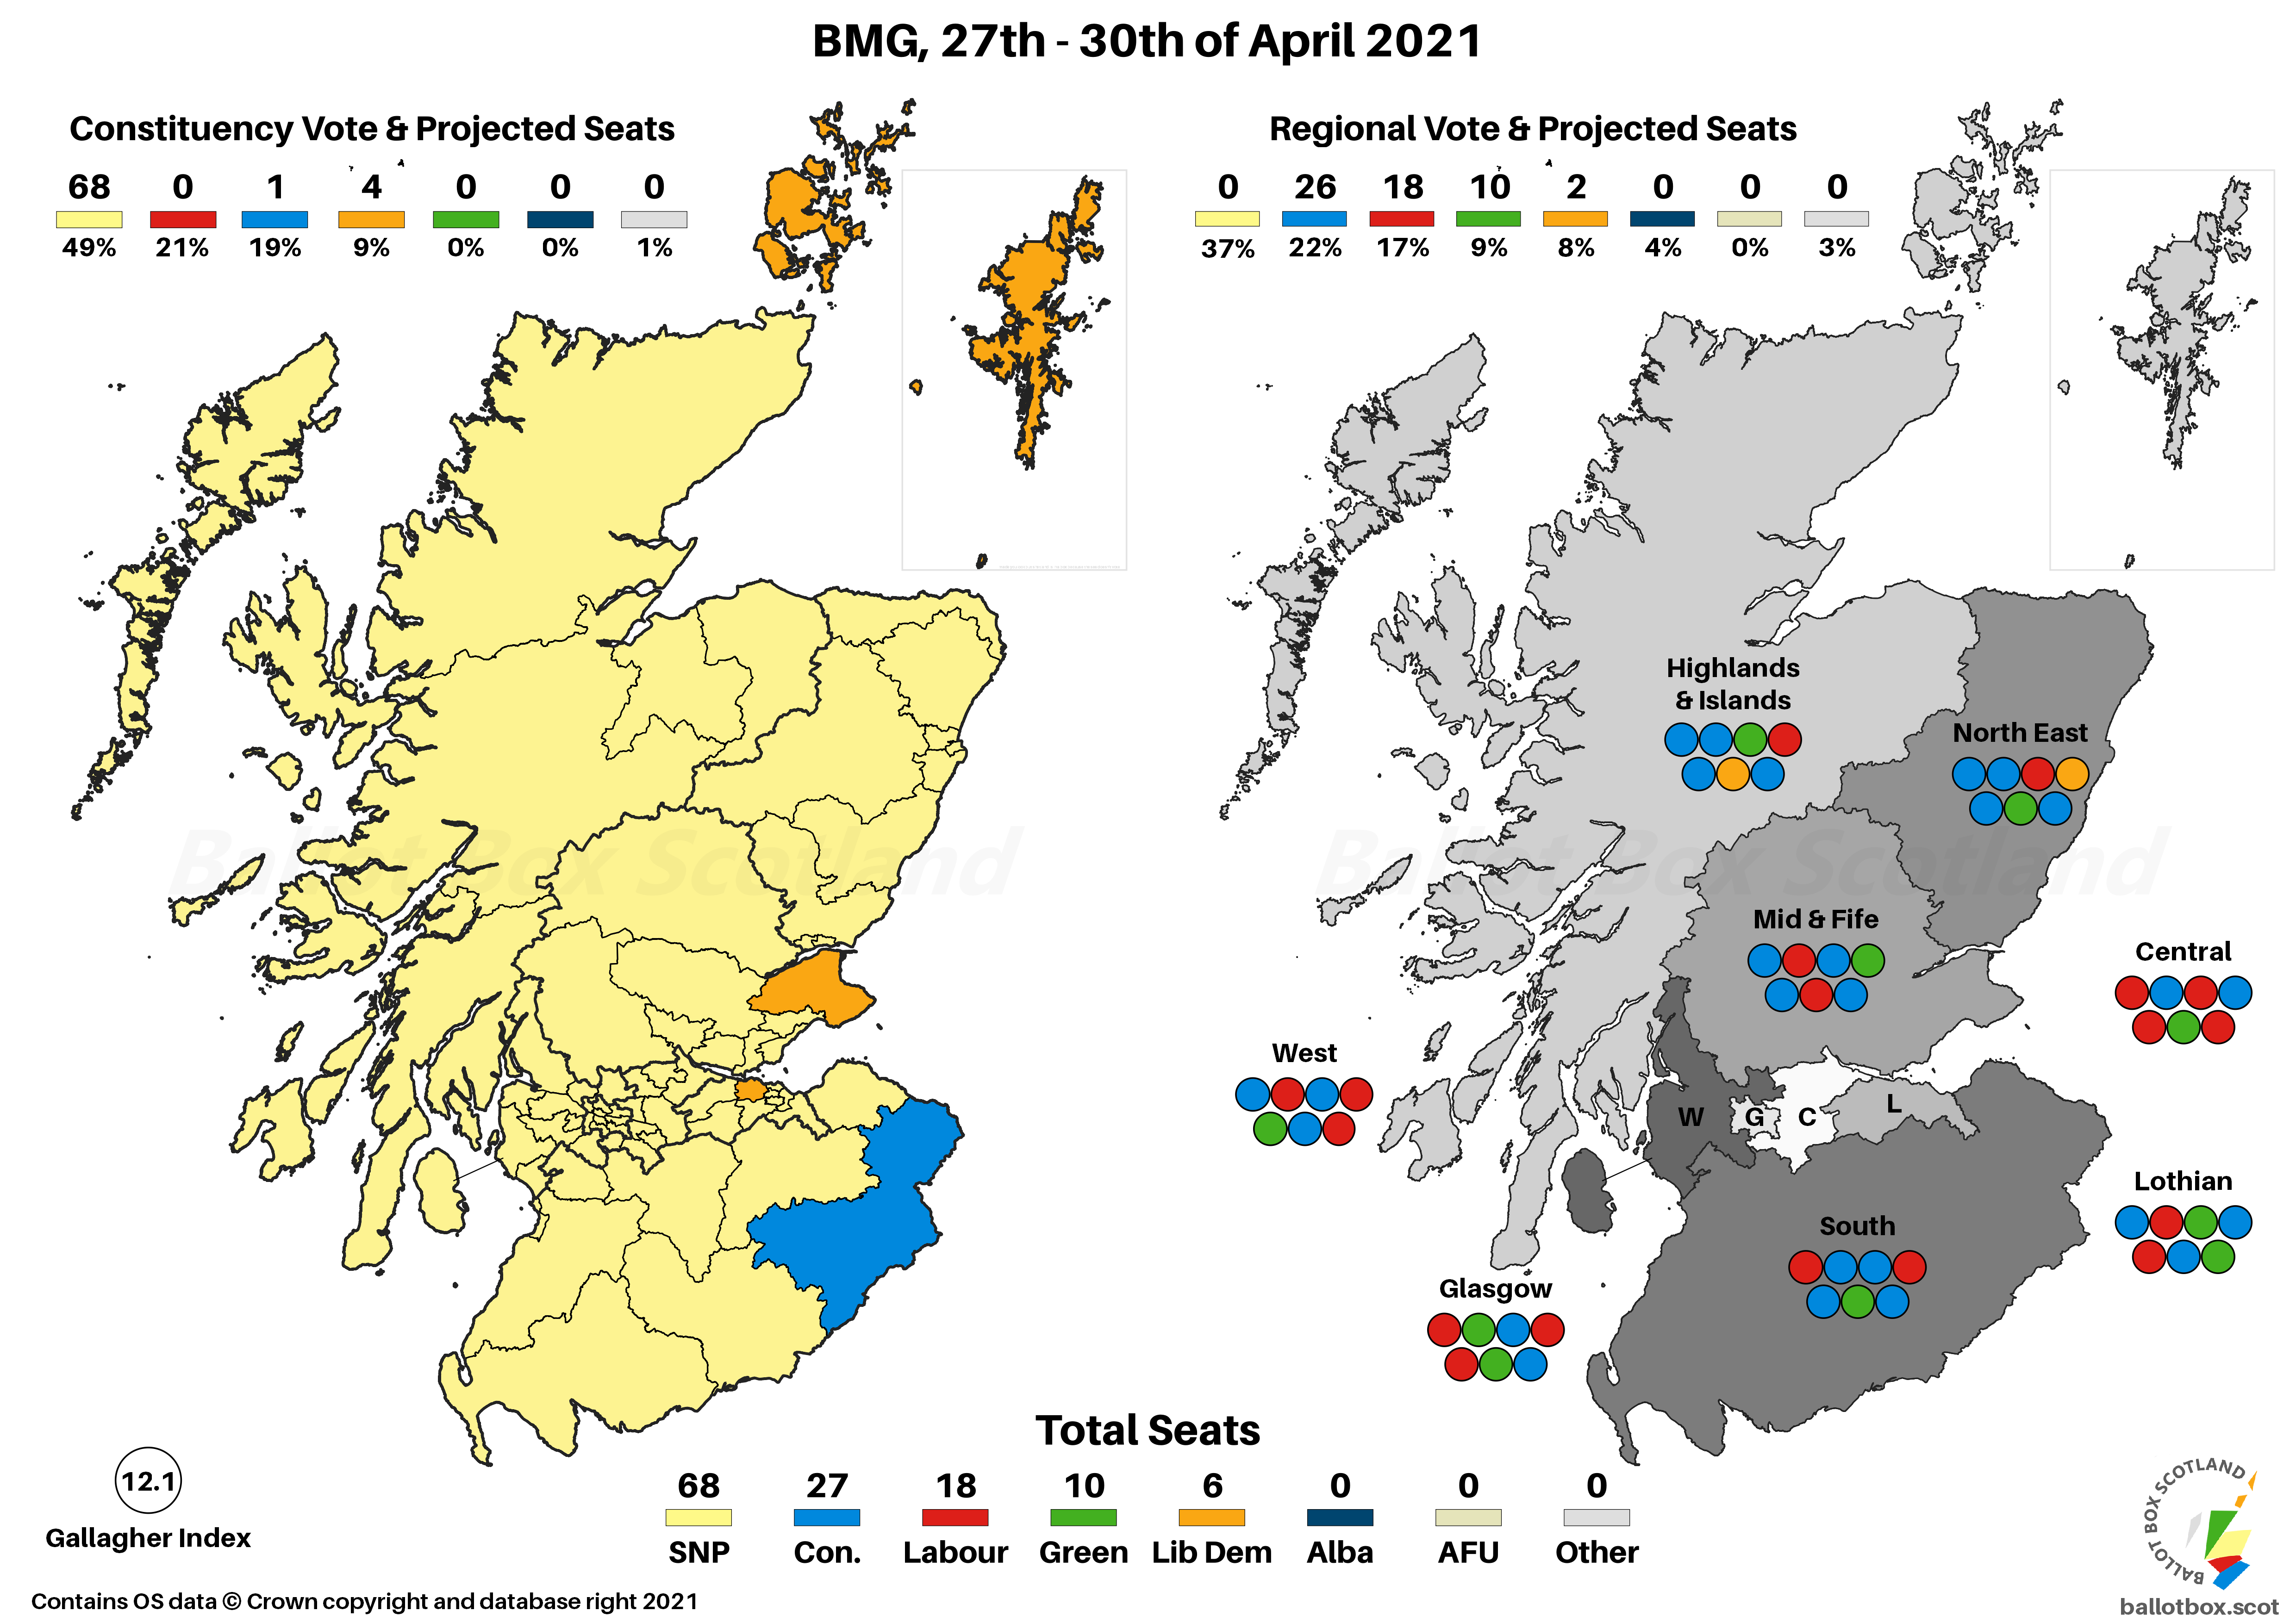
Regional Vote
SNP ~ 37% (-5 / -5)
Conservative ~ 22% (nc / -1)
Labour ~ 17% (nc / -2)
Green ~ 9% (+1 / +2)
Liberal Democrat ~ 8% (nc / +3)
Alba ~ 4% (+4 / +4)
The movement here is entirely amongst the pro-Independence bloc, as the SNP drop a weighty 5% compared to the last poll. That does look like a particularly sharp decrease, but it’s broadly reflective of the overall change in polling average since then, which has been seen as a more gentle slide with pollsters who’ve done more regular polling.
Most of the counterbalance to that goes to Alba, who at 4% are on the upper end of their polling range – indeed, BMG are only the second firm out of the seven currently in the average to find them above 3%. The Greens also experience a slight uptick, which is again something that’s broadly in line with recent trends.
Though there isn’t any movement for the three pro-Union parties since the last poll, it is worth noting the large gap between the Conservatives and Labour, and that BMG are the most optimistic pollster for the Lib Dems.
Constituency Vote
SNP ~ 49% (+1 / +2)
Labour ~ 21% (+1 / -2)
Conservative ~ 19% (-2 / -3)
Liberal Democrat ~ 9% (+1 / +1)
In contrast to the list figures, the SNP are actually up very marginally on the constituency vote, which will help to pad out their projected seats. Labour place second ahead of the Conservatives here, but from the perspective of wanting to come second in seats, they’ve got their ballots the wrong way round. Just as they did on the list, BMG also put the Lib Dems at their strongest.
Seat Projection
Please see this page for how projections work and important caveats.
Projecting that into seats might give us something like this:
SNP ~ 68 (+2 / +5)
Conservative ~ 27 (+1 / -4)
Labour ~ 18 (-1 / -6)
Green ~ 10 (nc / +4)
Liberal Democrat ~ 6 (-2 / +1)

Relative to some of the other recent polls, this projects to one of the larger SNP majorities, which comes mostly at the expense of the Lib Dems. Projections are not an exact science, but this emphasises the often odd nature of AMS once you start inducing overhangs, as that’s what denies the Lib Dems a couple of seats even though this is their recent best polling. It’s not the best system, folks.
As I noted for the Panelbase poll, I’d actually expect 4% for Alba to lead to seats – if it didn’t, it’d be the best vote share performance of a non-seat winning party in the history of Holyrood. It’s just that in the absence of solid prior evidence of support distribution, my model struggles to determine where those would come from.
SNP ~ 48% (+1 / +3)
Conservative ~ 20% (-1 / -5)
Labour ~ 20% (+1 / +1)
Liberal Democrat ~ 7% (nc / -3)
Green ~ 3% (nc / +2)
Although polling is prolific at the moment, Westminster questions are harder to come across. BMG have one of the few recent Westmintser figures, which are only very slightly different from last month’s poll. The SNP are up marginally to give them an advantage on 2019, the Conservatives down a bit and quite substantially since the election, Labour marginally up on both counts, and no movement for the Lib Dems or Greens versus last poll, but the former worse and latter better off than their previous performance.
Standard Question
Yes ~ 47% (-2)
No ~ 47% (+1)
Don't Know ~ 7% (+2)
At this point, regular readers should be able to reel off, word-for-word, what my analysis of this is. It’s on a knife-edge, totally margin of error, who knows which way Scotland would go in an actual referendum right now? This is the absolute peak of that trend, as it’s an even split – down from a slight lead for Yes back in March.
Excluding Don't Knows
Yes ~ 50% (-2 / +5)
No ~ 50% (+2 / -5)
Even split above, even split below. What more is there to say for this one?
Council Area Projection
Please see this page for how projections work and important caveats.

On a simple Uniform Swing versus 2014, it’s not quite evenly split, with 17 Councils leaning No (down from 28) and 15 towards Yes (up from 4).
Hypotheticals
As ever, the last little bit of analysis concerns those hypothetical and more proportional voting systems that I have a bee in my bonnet about here at BBS. The fact Westminster uses pure FPTP is an affront to democracy, and though Holyrood fares far better, AMS is still deeply imperfect. The examples here simply transpose the poll findings onto more proportional voting systems – the reality is that different systems would of course result in different voter behaviour.
As the election approaches and polls are coming out more frequently, I’m jettisoning the actual map for this one for now. I still think it’s a fun and useful exercise, but it’s also time consuming to manually change 129 bubbles! (The AMS projection is only 56 bubbles, because the 73 constituencies are driven from a spreadsheet).
Changes here are vs AMS / vs same projection for the last poll.
SNP ~ 49 (-19 / -6)
Conservative ~ 29 (+2 / nc)
Labour ~ 22 (+4 / -1)
Green ~ 13 (+3 / +2)
Liberal Democrat ~ 11 (+5 / nc)
Alba ~ 5 (+5 / +5)
The SNP’s overhang is quite substantial under the AMS projection, so that makes the reduction in seats in this purely proportional hypothetical particularly substantial, whilst everyone else would be better off. As we’ve seen with a few of these in recent polls, there’d be a pro-Independence majority, but it would be dependent on those Alba MSPs as the SNP and Greens fall short.

Scandinavian Style Westminster
Changes here are only versus the same projection on the last poll, given my aversion to doing projections on pure FPTP – and, given pressures of looming Holyrood election, again no accompanying map.
SNP ~ 29 (+1)
Conservative ~ 12 (-1)
Labour ~ 12 (nc)
Liberal Democrat ~ 4 (nc)
Green ~ 2 (nc)
A more modest though still large SNP group than we’d expect FPTP to return, and far more MPs from every other major party.
If you find this or other Ballot Box Scotland output useful and/or interesting, and you can afford to do so, please consider donating to support my work. I love doing this, but it’s a one-man project and takes a lot of time and effort. All donations, no matter how small, are greatly appreciated and extremely helpful.
(About Donations)


