
Background
Thursday’s other two by-elections were a double-dunter in Highland Council, both caused by Independent resignations. Highland are typically the best council are reporting on their by-elections, and they took things to the next level by running a live stream on Twitter through the morning, complete with incredibly dramatic music. They fell at the final hurdle however when the first declaration was made without audio on the feed, alas!
Let’s first look at that silent result from Inverness West, where it was Graham Ross standing down. The Liberal Democrats have maintained a degree of strength in the city despite their collapse and would have quite easily won a single seat election in 2017. I hedged my bets a bit here though, as it can be hard to determine whether remaining local support for Lib Dems is vested in the councillor or the party, and therefore had this as just leaning their way.
First Preferences - Inverness
I’d say that turned out to be the right call – especially given I’d heard the Lib Dems had been putting a lot of effort into the area. Despite that effort, they picked up around about as much of the vote going spare from 2017 as the SNP did, meaning the latter retained a first preference lead. Of course, that isn’t the whole story under STV, but more on that shortly.
For the Conservatives, the only other returning party from 2017, there was a moderate increase in their share. They weren’t a million miles ahead of Independent candidate Duncan McDonald, who proved strongest of the newcomers. Independents may rule the rural Highlands, but the capital is much more party-political, and that held in this by-election. The Greens too made a respectable showing – by their own standards, this is a pretty solid performance.
That left the Independence for Scotland Party and Libertarians bringing up the rear. This is the third time the ISP have appeared on the ballot, and the highest vote they’ve polled so far. I’d be inclined to say that’s nothing but coincidence, as they remain largely unknown outside of the Twitter political bubble.
Transfers - Inverness
As no candidate had an outright majority of the vote, transfer rounds were necessary. The quota to reach here was 1066 votes.
Looking at where things stood by the final head-to-head at stage 6 (changes vs final head-to-head stage in 2017 election re-calculation):
Liberal Democrat - 970 (45.5%, -6.5)
SNP - 869 (40.8%, +7.0)
Didn't Transfer - 292 (13.7%, -0.4)
Through the transfer rounds, the SNP’s lead is initially reinforced by the Green elimination, but the Lib Dems then receive more of McDonald and the Conservatives’ transfers, allowing them to pull ahead and win the seat. Going back to my earlier assessment of this “leaning” Lib Dem, we can see that compared to the 2017 re-calculation things were much closely run.
Previously, the Lib Dems effectively took the lead as soon as transfers began and grew it throughout the process, whereas this time it took until the final other candidate elimination to overtake the SNP. Whereas they’d had a very comfortable 18.3% lead previously, that’s fallen to just 4.7% here. Given that the proportion of votes that didn’t transfer barely budged, that shows something of a swing towards the SNP.
Detailed Data - Inverness
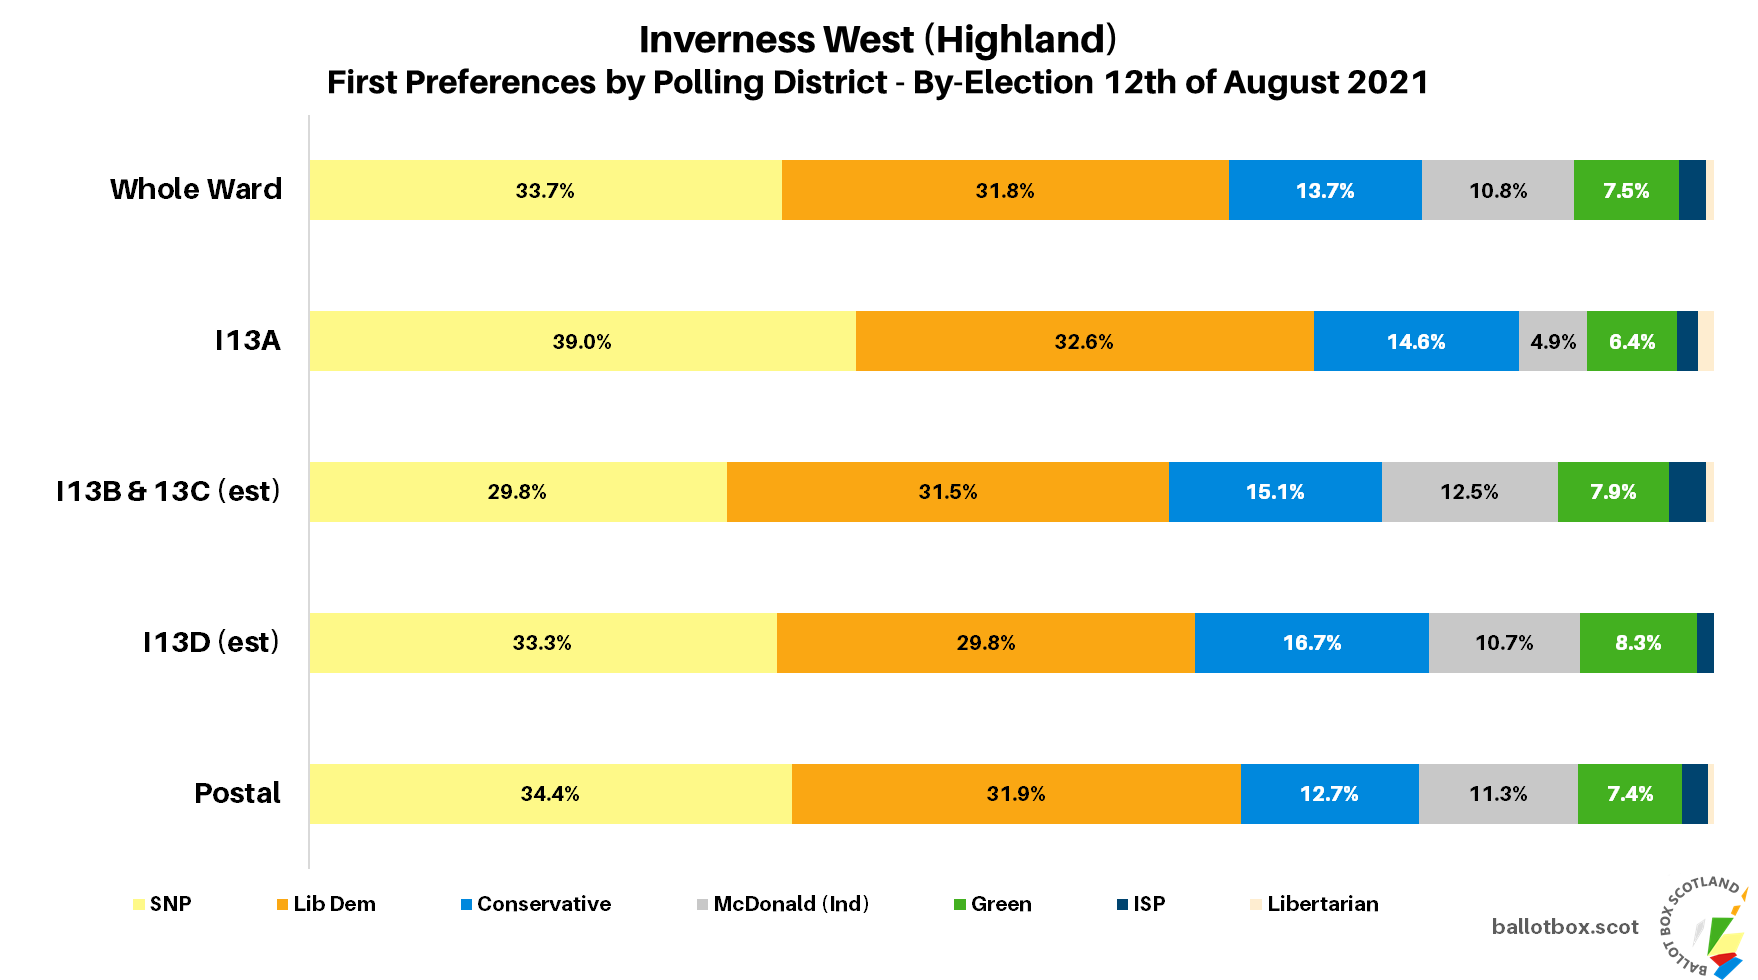
Machine counts typically mean some really juicy data, starting with the breakdown of results per polling district. However, strict ballot secrecy rules require the “merging” of ballot boxes containing fewer than 200 votes. That has perhaps limited the utility of this data for both the Highland by-elections.

I did attempt to tease out an estimate of the votes in the I13D district, separate from the B and C with which it had been merged, but admitted defeat in attempting a similar separation of those two. According to that chart, we can say that the SNP and Lib Dems both had their best results in the district covering Kinmylies. With 2017 results in mind, I’d say that in the unmerged votes we’d probably have seen the Lib Dems doing best in Scorguie and Clachnaharry again, but being merged with Balifeary dragged that share downwards.
The Conservatives have their best share in that merged district, as did McDonald. Based on my attempt at estimating the share around the small chunk of Dalneigh in the ward (the D district), that’s where the Greens did best, though it was the area with lowest turnout. For the ISP and Libertarians, their vote shares were just too low to really take anywhere as a clear leading area for them.
Now, let’s wrap up Inverness West by having a look at the second preference votes, bearing in mind we can’t get those simply from the transfer chart.
I don’t think there are very many surprises in this batch of votes. Strong mutual preferencing between the SNP and Greens? Pretty normal. Similar between Conservatives and Lib Dems, though stronger from former to latter than vice-versa? Also standard. An Independent’s voters going Lib Dem might make sense in the local context, and of course the ISP would lean towards the SNP.
First Preferences - Wick
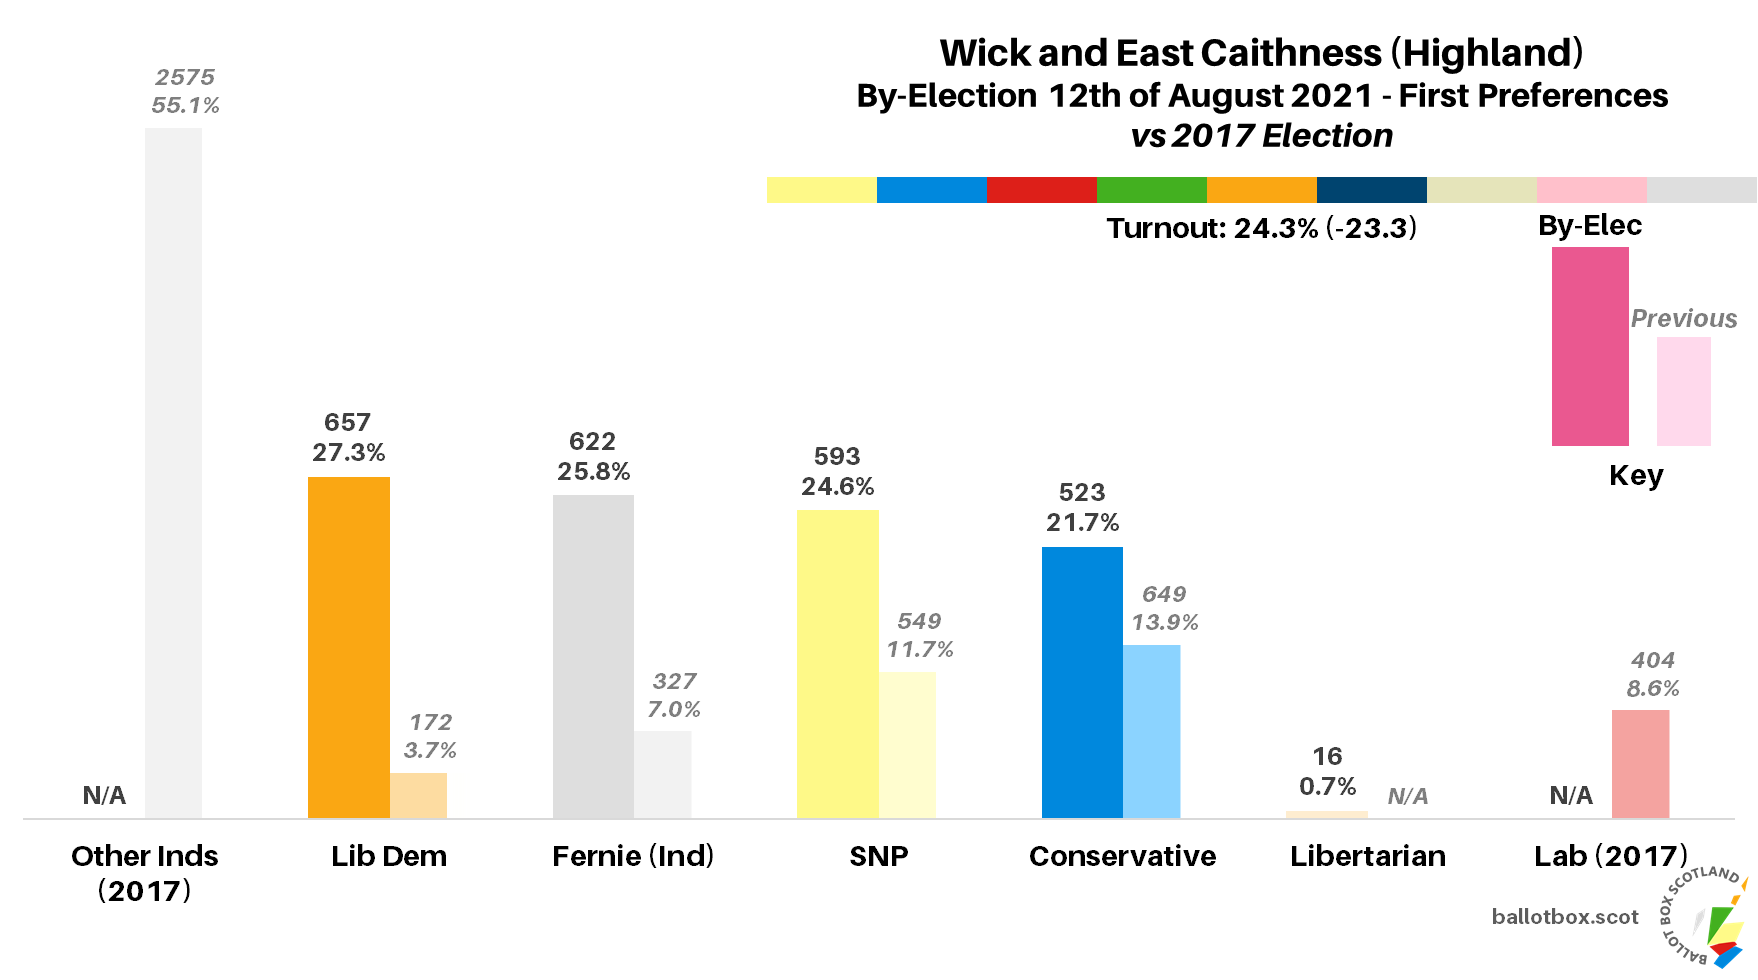
Heading much further north for Wick and East Caithness, the departing Independent here was Nicola Sinclair. This is a classic rural Highland ward in that Independents were utterly dominant in 2017, winning over 60% of the vote – plus nearly 9% went to Labour, who were absent this time.
With just one of those Independents returning, former Wick councillor Bill Fernie, this was a rather chaotic one to attempt to predict. Nonetheless I’d stuck my neck out and said I thought it may lean his way, given the general Independent tendency of the area, with the SNP or Conservatives the other competitors.
With almost two-thirds of the 2017 vote up for grabs, the swings here need to be taken with an entire warehouse full of salt. Those votes, mathematically speaking, had to go somewhere! That said, it’s perhaps interesting that the four major contenders here all fell pretty close to one another in the 20% band.
Although I wasn’t wrong to think Fernie had a good chance, his weighty share of the gains were outstripped by the Lib Dems, who seemingly surprisingly topped the poll having been dead last in 2017. With just 35 votes between them, I spent a few seconds of the declaration wondering whether the Lib Dems may have found themselves in the opposite situation to Inverness West…
Transfers - Wick
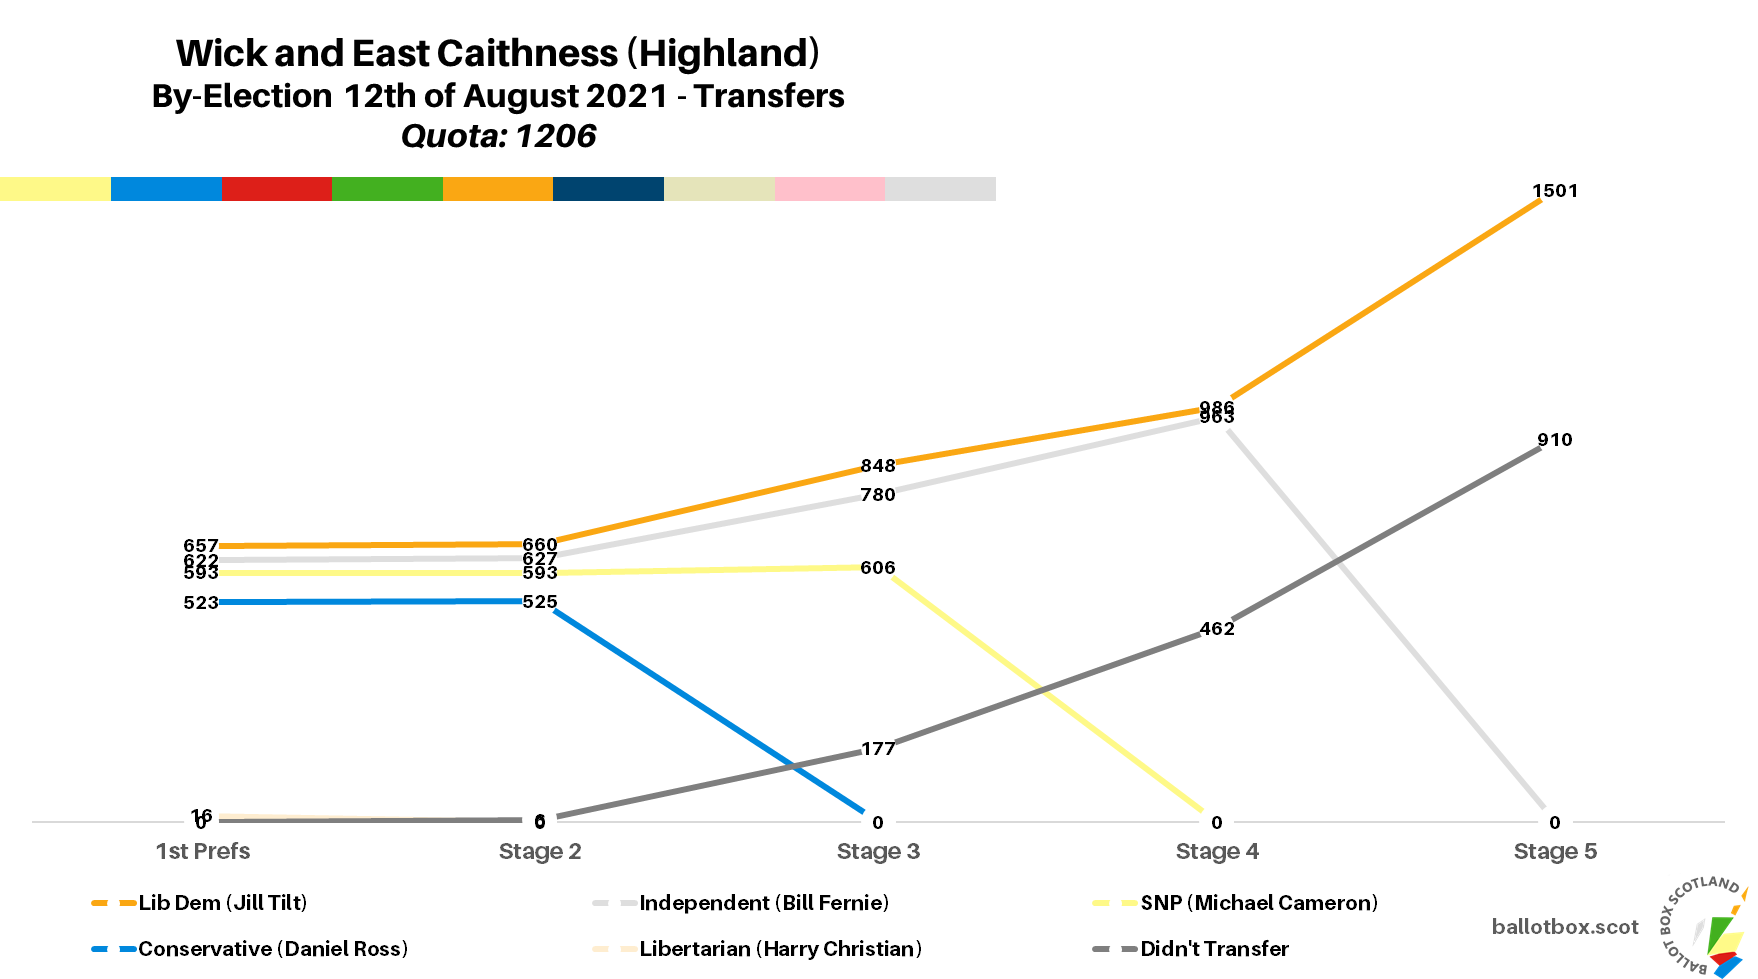
As no candidate had an outright majority of the vote, transfer rounds were necessary. The quota to reach here was 1206 votes.
Looking at where things stood by the final head-to-head at stage 4 (changes here are via a re-calculated Fernie vs Lib Dem outcome in 2017):
Liberal Democrat - 986 (40.9%, +24.5)
Fernie (Ind) - 963 (39.9%, +2.5)
Didn't Transfer - 462 (19.2%, -26.9)
As it turned out, the Lib Dems held onto their lead at every stage, though it remained pretty knife-edge throughout, finishing at just 1% ahead of Fernie. That rounded off a very good day for the party in the Highlands, and coincidentally means that (by my reckoning) they are now the only one of the major parties that currently have as many councillors nationally as they elected in 2017, as losses since then have now been offset by defections and by-election gains.
I’ll be honest and put my hands up and say I should have been more aware of the prospects for Lib Dem success here. That’s especially true given I’ve spent the past few weeks drafting and then tweaking a piece about the party’s electoral base, due to publish when their leadership contest – or rather, coronation! – finally draws to a close. Caithness is part of one of the constituencies they hold at Westminster, and one which they were clearly gunning for at Holyrood. Naturally, the effort put in at other levels bled through to local elections.
Detailed Data - Wick
As a large rural ward, the ballot secrecy rules have done even more of a number on how useful the ballot box level data is for this by-election, with a huge range of districts merged into just three blocks.

It’s very hard to tease anything out of this, and it looks quite odd that the colouration of the map is entirely the third and fourth placed parties. If we were able to see individual boxes, I’d put money on at least one in Wick showing Fernie ahead, and a rural box or two with a Lib Dem lead given that across the rural Conservative-led districts they were just 2 votes behind.
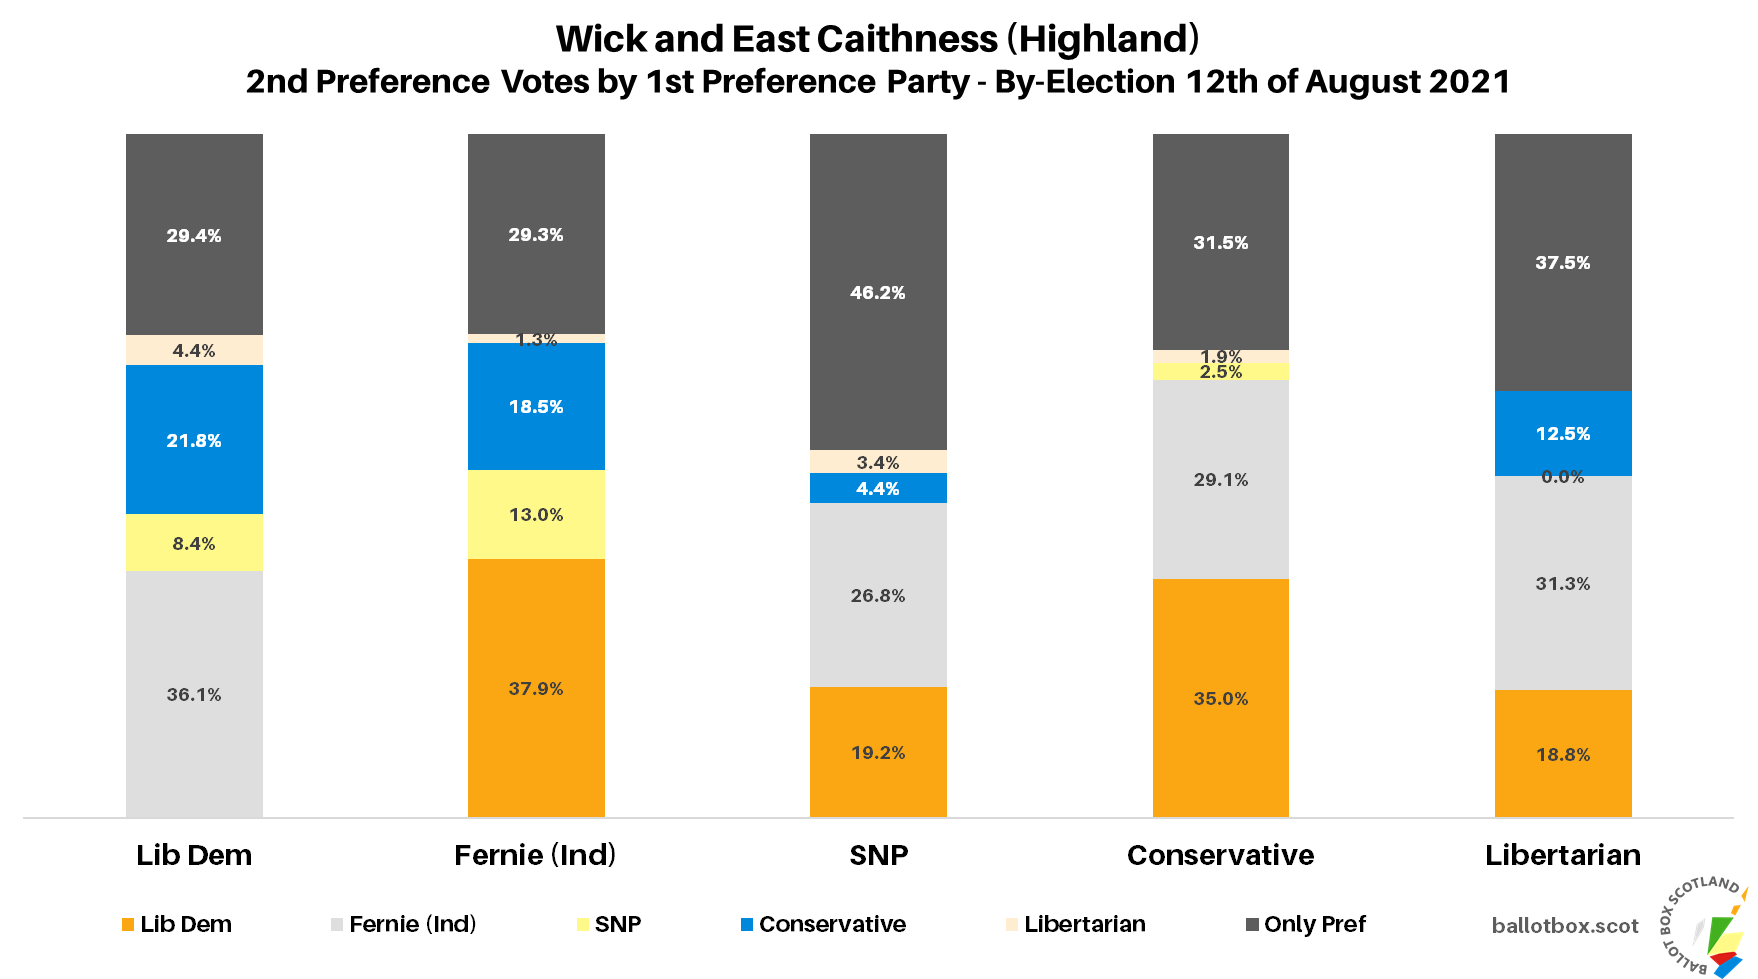
Finally, we’ll look at second preferences.
Voters for the top-two candidates also proved very favourable to the other in the pair, with almost exactly as many Lib Dem voters marking Fernie second as went the other way. The Conservatives relatively narrowly preferred the Lib Dems over Fernie, whilst the SNP and what few Libertarian voters there were leaned more towards the Independent option.
That brings us to the end of the data marathon of Thursday’s by-elections! We’ve got one more by-election due this month, in Aberdeenshire’s Mid-Formartine ward. The full elections are looming next May, so although I’m aware of one more due later this year, we may be expecting councillors running out of steam to be thinking more of retirement than resignation at this point. That means that, hoping of course that we do not see any deaths amongst councillors, we won’t have many of these left to go.
If you find this or other Ballot Box Scotland output useful and/or interesting, and you can afford to do so, please consider donating to support my work. I love doing this, but it’s a one-man project and takes a lot of time and effort. All donations, no matter how small, are greatly appreciated and extremely helpful.
(About Donations)


