

Keep tabs on all the latest polling, articles and information ahead of the 2021 Scottish Parliament election in the Ballot Box Scotland Holyrood Hub!
Thursday gave us two poll releases in the one day because, of course, the election is approaching and it is time to exhaust me! We covered the YouGov in yesterday’s piece, so today we’re looking at the monthly ComRes poll. This is the last of a trio of polls that all kicked off fieldwork within a day of each other – Panelbase starting on the 3rd, YouGov on the 4th, and this on the 5th, so covering a similar period.
Display format for this post:
- Party/Option – Vote% (Change vs last poll by agency 4th – 9th of February 2021 / vs last election or referendum)
Regional Vote
SNP ~ 40% (-3 / -2)
Conservative ~ 24% (+3 / +1)
Labour ~ 18% (nc / -1)
Green ~ 10% (nc / +3)
Liberal Democrat ~ 6% (nc / +1)
There was some chatter on Twitter about what looks like a direct SNP to Conservative vote transfer here, since the SNP are down 3% and the Conservatives up by that much. Whilst we shouldn’t pretend such swings don’t exist – 2016 and 2017 showed us as much – remember this sort of thing can hide “churn” whereby e.g. some SNP voters leak away to Labour, but are balanced by Labour voters trickling to the Conservatives.
Anyway, ComRes remain on the lower end of polling for the SNP, whilst the Conservatives have mounted an absolutely remarkable comeback since January’s poll where they were on a record low of just 16%, now polling just above their 2016 result. No shift for the other parties, with the Greens a bit above average as per usual for this pollster, whilst Labour and the Lib Dems sit roughly on their own averages.
Constituency Vote
SNP ~ 48% (-6 / +1)
Conservative ~ 23% (nc / +1)
Labour ~ 20% (+4 / -3)
Liberal Democrat ~ 8% (+3 / nc)
The SNP experience a much more severe decline on the constituency ballot, to the benefit of Labour and the Lib Dems. This is on the better end of polling for both of those parties, whereas for the SNP it’s only the second poll since before the 2019 UK election to have them below 50% on this vote.
Seat Projection
Please see this page for how projections work and important caveats.
SNP ~ 64 (-7 / +1)
Conservative ~ 29 (+5 / -2)
Labour ~ 21 (+2 / -3)
Green ~ 10 (-1 / +4)
Liberal Democrat ~ 5 (+1 / nc)
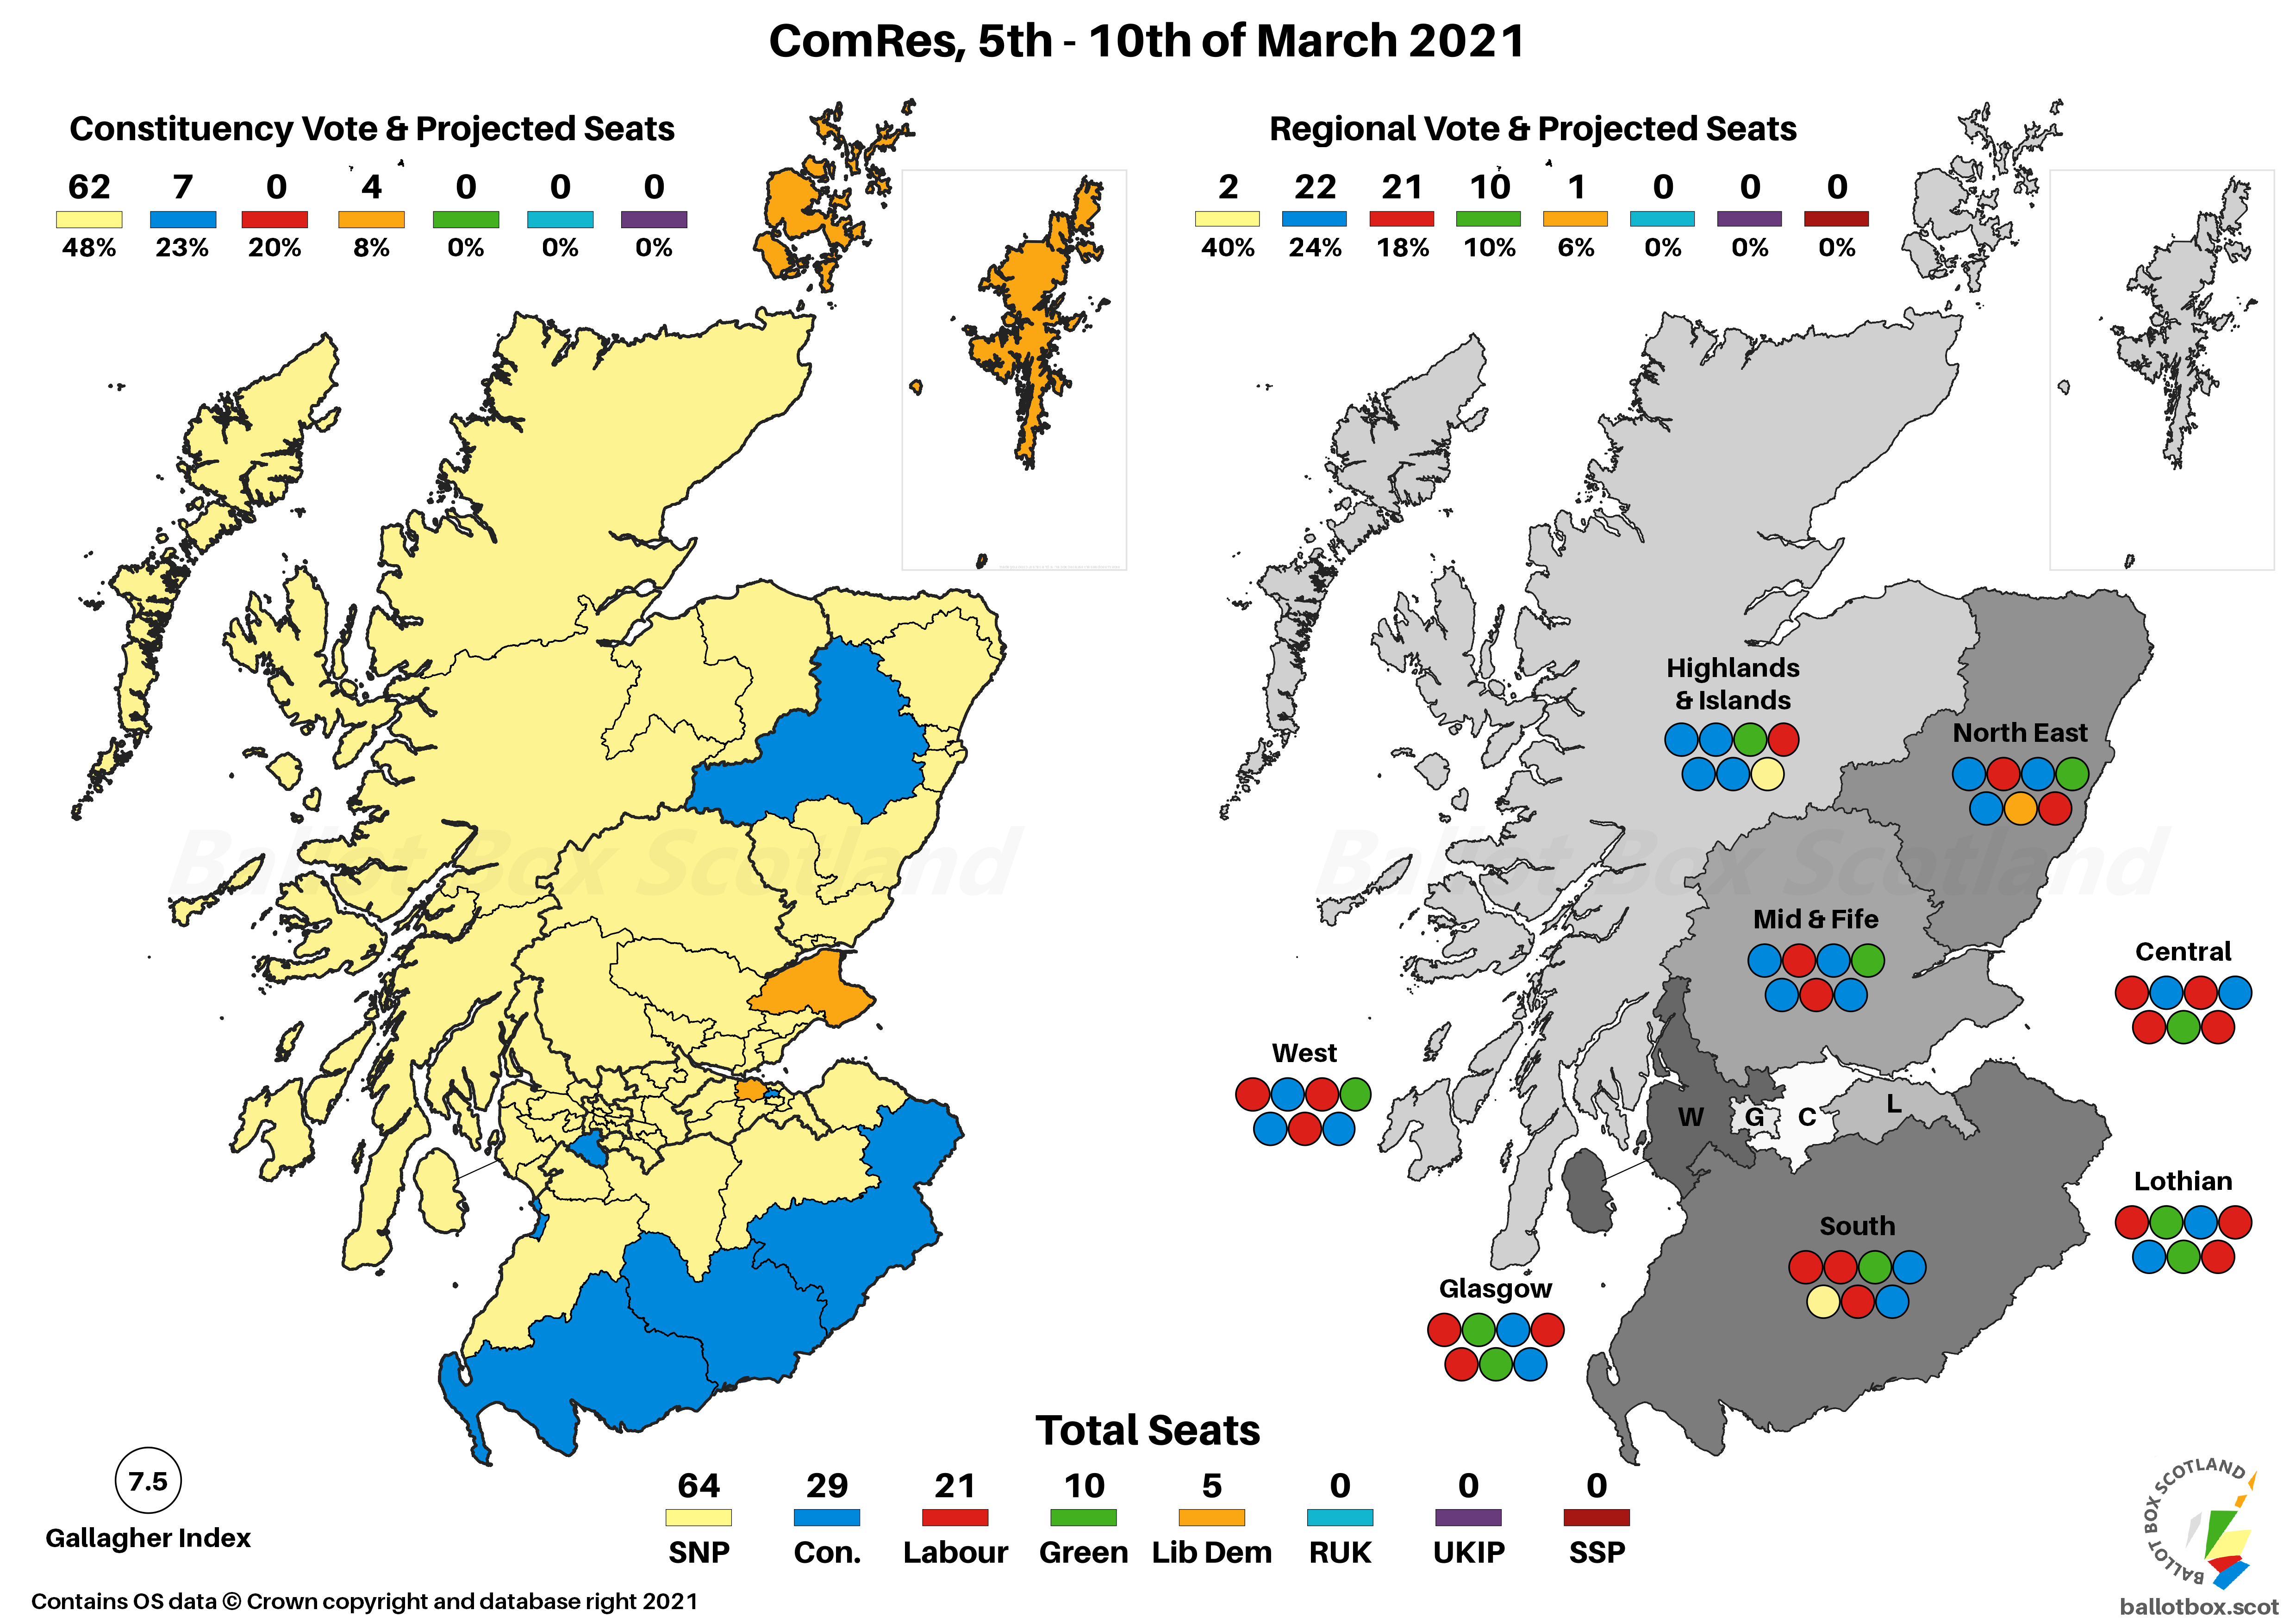
In contrast to the YouGov and to complement the similarly knife-edge Panelbase but in the other direction, the SNP find themselves short of a majority on this projection. This is the first time my calculator has suggested this since January 2020, though they are just one seat short. However, there’s still a clear lead for the pro-Independence parties, at 74 to 55.
ComRes don’t include Westminster VI in this series of polling, alas.
Standard Question (changes here vs 18 - 22 Feb)
No ~ 47% (+3)
Yes ~ 45% (-3)
Don't Know ~ 8% (nc)
As with the YouGov poll, this both gives us a “proper” lead for the Union, whilst remaining within tight margin of error territory. What slightly differentiates this is the more decisive nature of both figures – YouGov has both slightly higher “Don’t Know” and “Refused” figures, the latter of which I’m not sure why they don’t just omit.
Excluding Don't Knows
No ~ 51% (+4 / -4)
Yes ~ 49% (-4 / +4)
We end up with an identical result to that other poll when we take it down to pure No vs Yes. According to the (totally arbitrary!) 5-poll average the tracker page follows, we’re now at 50.2% vs 49.8% in favour of Independence at this point – so if the next poll is a draw or lead for No, that’ll flip the overall average back towards the Union.
Council Area Projection
Please see this page for how projections work and important caveats.

On a simple Uniform Swing versus 2014, this might put a total of 20 Councils in the No column, a decrease from 28 in 2014. Yes could be on 12, up from 4 at the referendum.
Hypotheticals
As ever, the last little bit of analysis concerns those hypothetical and more proportional voting systems that I have a bee in my bonnet about here at BBS. The fact Westminster uses pure FPTP is an affront to democracy, and though Holyrood fares far better, AMS is still deeply imperfect. The examples here simply transpose the poll findings onto more proportional voting systems – the reality is that different systems would of course result in different voter behaviour.
Changes here are vs AMS / vs same projection for the last poll.
SNP ~ 52 (-12 / -4)
Conservative ~ 32 (+3 / +4)
Labour ~ 24 (+3 / nc)
Green ~ 13 (+3 / nc)
Liberal Democrat ~ 8 (+3 / nc)

If you’re a long-time follower of BBS, you’ll know the story for this hypothetical – the SNP do a lot worse in terms of seats, everyone else does a lot better.
What I’m enjoying this time though is a small degree of PR chaos. So, if we look back at the projections for the overlapping Panelbase poll, it gave an AMS majority of 1 seat for the SNP, but a Scandi majority of 1 for the pro-Union parties. The projections for this ComRes give us an almost exact opposite, where the SNP fall 1 seat short of an AMS majority, but there’s a Scandi majority of 1 for the pro-Independence parties.

If you find this or other Ballot Box Scotland output useful and/or interesting, and you can afford to do so, please consider donating to support my work. I love doing this, but it’s a one-man project and takes a lot of time and effort. All donations, no matter how small, are greatly appreciated and extremely helpful.
(About Donations)


