
Background
Thursday was a truly bumper day for by-elections, as we had four different votes to grapple with. Two of them were here in Glasgow, both resulting from shock disqualifications of councillors for failing to attend meetings for six months.
In Baillieston it was a Labour councillor, the longest serving member of the Council, who fell foul of the rule. I reckoned this was all but guaranteed to be an SNP win.
The more exciting contest was in Partick East/Kelvindale, albeit that I was mostly excited because that’s the ward I live in. Here, a Conservative-turned-Independent councillor had been given the sack. I deemed this one to be a likely SNP win, which basically means although it wouldn’t be jaw-dropping if someone else won it, I would be pretty surprised…
First Preferences
… and surprised I was! That’s not immediately apparent from the first preference chart here, as the SNP maintained a lead. Of course, we all know that’s not all there is to STV, but we’ll get onto that shortly. First preferences in full:
SNP - 2084 (32.1%, -2.2)
Labour - 1836 (28.3%, +10.7)
Green - 1200 (18.5, +2.1)
Conservative - 1084 (16.7%, -5.5)
Liberal Democrat - 259 (4.0%, -4.5)
UKIP - 33 (0.5%, +0.5)
Note that in the 2017 election an Independent won 1%.
Labour had a massive increase in their first preferences versus 2017, whilst the SNP suffered a slight decrease. In 2017 the SNP had won nearly twice as many votes as Labour, but that 16.7% gap was slashed to just 3.8% this time. That catapulted Labour into a clear second place.
The corresponding counterweight to that surprise is how badly the Conservatives did, dropping 5.5% and slipping from second to fourth place. Especially given the demographics of by-election turnout I had expected them to remain in second place, not to be overtaken by the Greens who were the only other party to increase their vote share versus 2017.
This is also a pretty disastrous result for the Lib Dems, who lost over half of their vote. As I noted in the preview piece, this had been their best ward in the city in 2017, and overlapped with the three single-member wards they’d won back in the last FPTP election in 2003. If they had a serious prospect of recovery in Glasgow, they’d have been sinking effort into this ward even before the by-election. Evidently, they haven’t been doing so.
Transfers
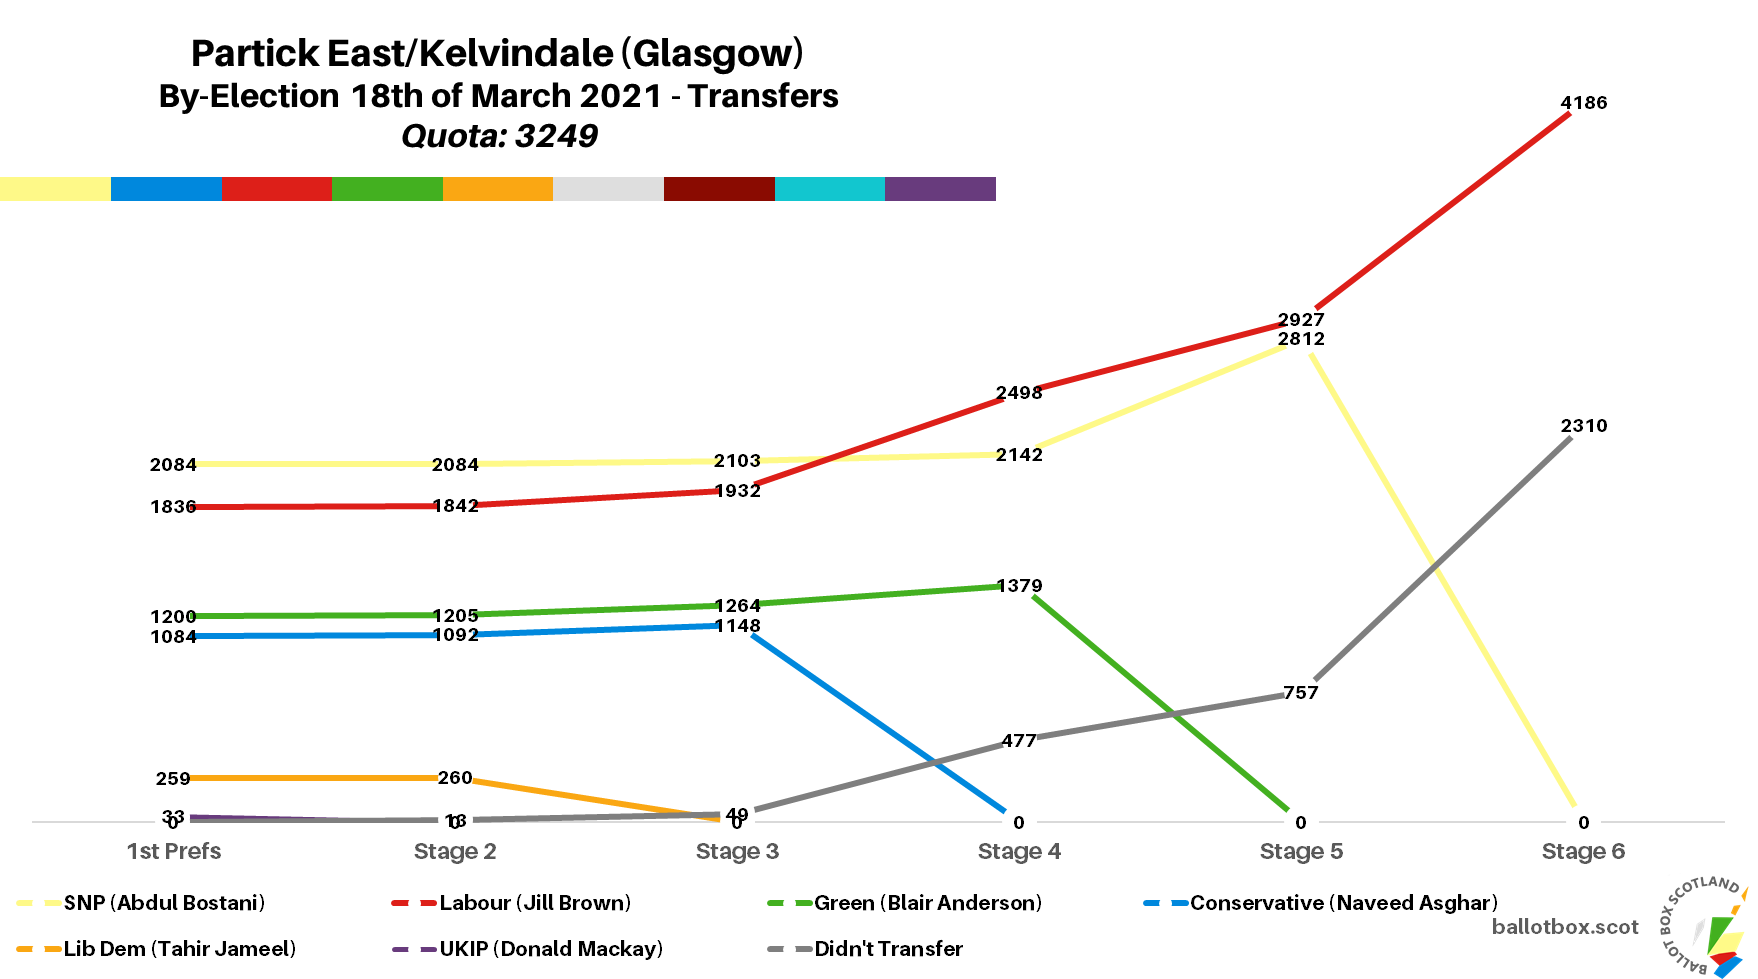
As no candidate had an outright majority of the vote, transfer rounds were necessary. The quota to reach here was 3249 votes.
Looking now at the transfers for the final head-to-head at stage 5 (changes vs final head-to-head stage in 2017 election re-calculation):
Labour - 2927 (45.1%, +8.7)
SNP - 2812 (43.3%, -1.3)
Didn't Transfer - 757 (11.7%, -7.4)
With the first preference gap having been massively reduced, it was far easier for Labour to close it via transfers this time around. That’s exactly what happened, giving Jill Brown a margin of victory of 1.8%, and making her one of my four councillors – for the time being anyway, as I’m aiming to move once the pandemic allows! Having said I was surprised by this result, I wasn’t the only one.
A good few of the local Labour folk I know were also (pleasantly, from their perspective) rather stunned, as were the SNP (less pleasantly for them). I think all of us were working on unusually low info this time around, due to the almost complete absence of traditional campaigning. Unpaid leaflet deliveries were still suspended until Monday the 15th, and canvassing was still completely off the table. It’s bloody typical I’d get the fun of a by-election where I live and none of the ability to scrape local contacts of various parties for useful intel during it!
Detailed Data
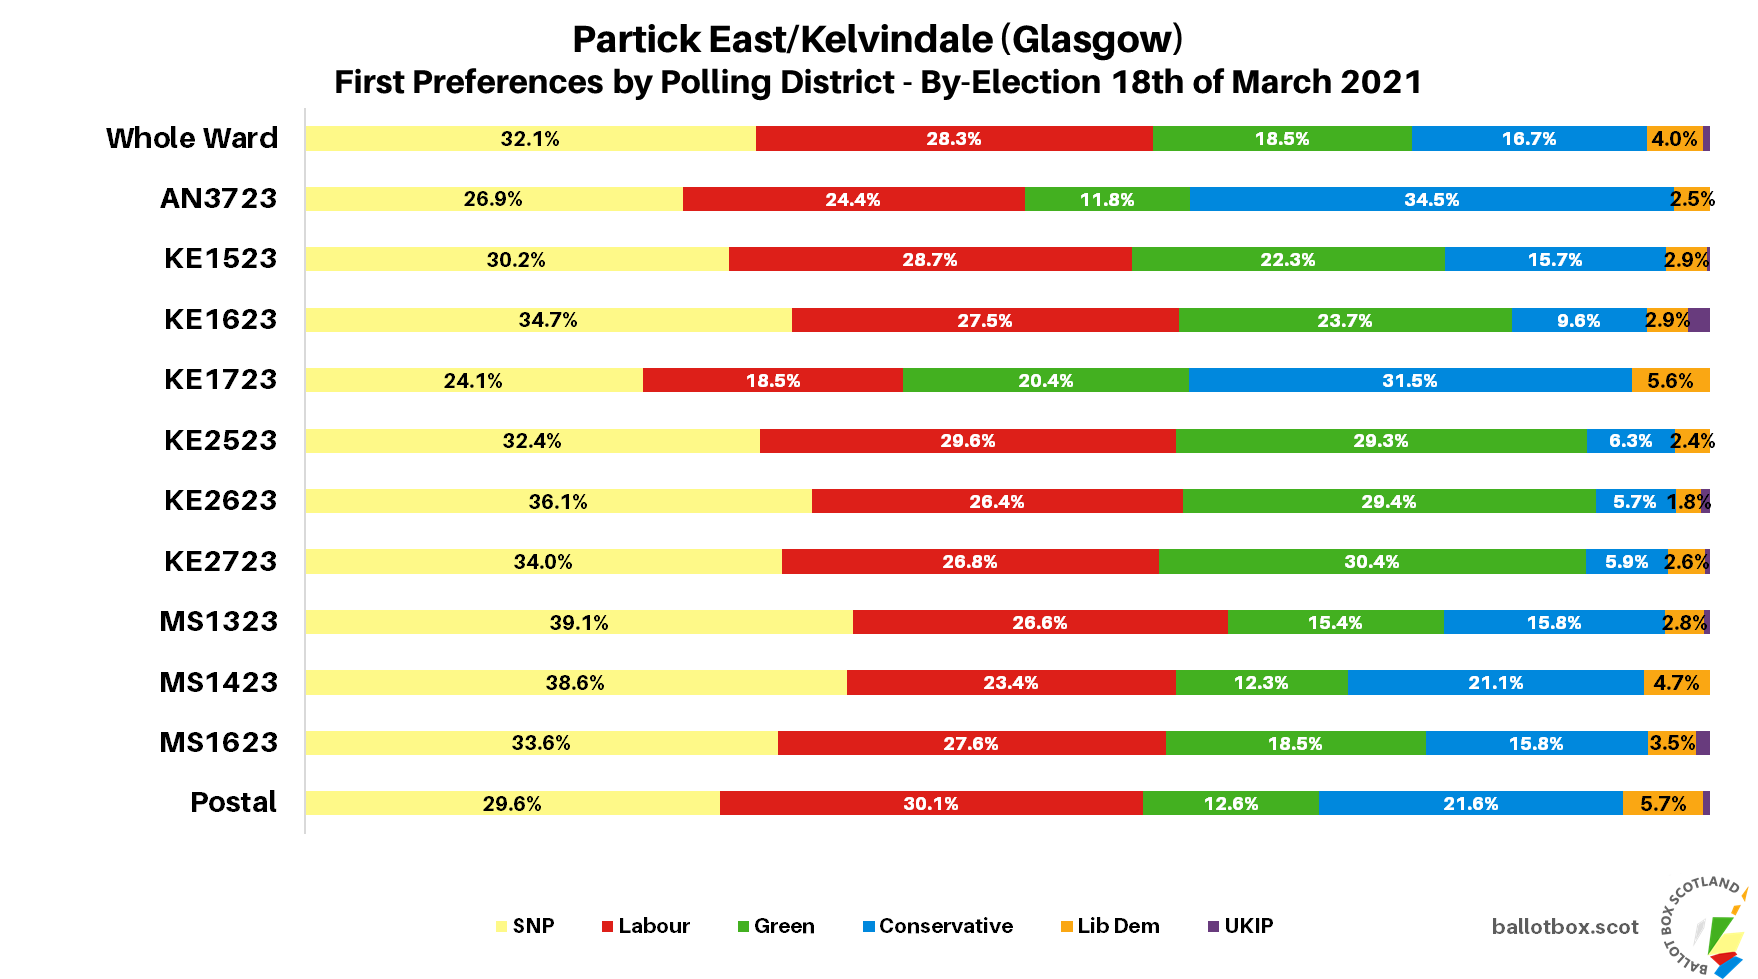
Machine counts mean some really juicy data, starting with the breakdown of results per polling district. Note that if comparing this to 2017, I had much clearer data about box breakdowns within districts this time around.

The SNP ended up leading in almost every district, with their strongest result coming from western Kelvindale. That’s a turnaround from 2017 when the Partick end of the ward was by far their best area. Despite placing fourth, the Conservatives were the only other party to have a lead in any of the districts, most strongly in Claythorn but also in the Hughenden chunk of Hyndland. Hughenden was also the best bit for the much weakened Lib Dems.
Labour’s only lead came from the postal vote, with their strongest result from in-person votes being western Partick. The Greens also performed very strongly in that end of the ward, partic(k)ularly in the district covering the southern ends of Partickhill and Dowanhill.
Turning to direct second preferences, the strongest relationship was once again between the SNP and Greens, with a majority of each party’s voters ranking the other second. The Greens also received the largest share of Labour second preferences. Labour themselves were the most popular next choice for both Conservative and Lib Dem voters.
It’s that increased willingness from Conservatives in particular to give a preference to Labour that tipped the by-election the latter’s way. We can play around with transfer data from both elections for what happens if we bring it to an SNP vs Lab vs Con point, then eliminate the Conservatives to see what happens with their terminal transfers.
In 2017, Labour picked up 40% of those votes, with just 5% going to the SNP and the rest not transferring at all. In this by-election, 52% went to Labour, and still only 5% to the SNP. If those votes had transferred at 2017 rates, Labour would have been 2.2% worse off at the final head-to-head stage, giving the SNP a 0.4% lead.
First Preferences - Baillieston
The high drama of PEK out of the way, let’s move onto Baillieston – remembering that I had this one down as basically guaranteed to go to the SNP.
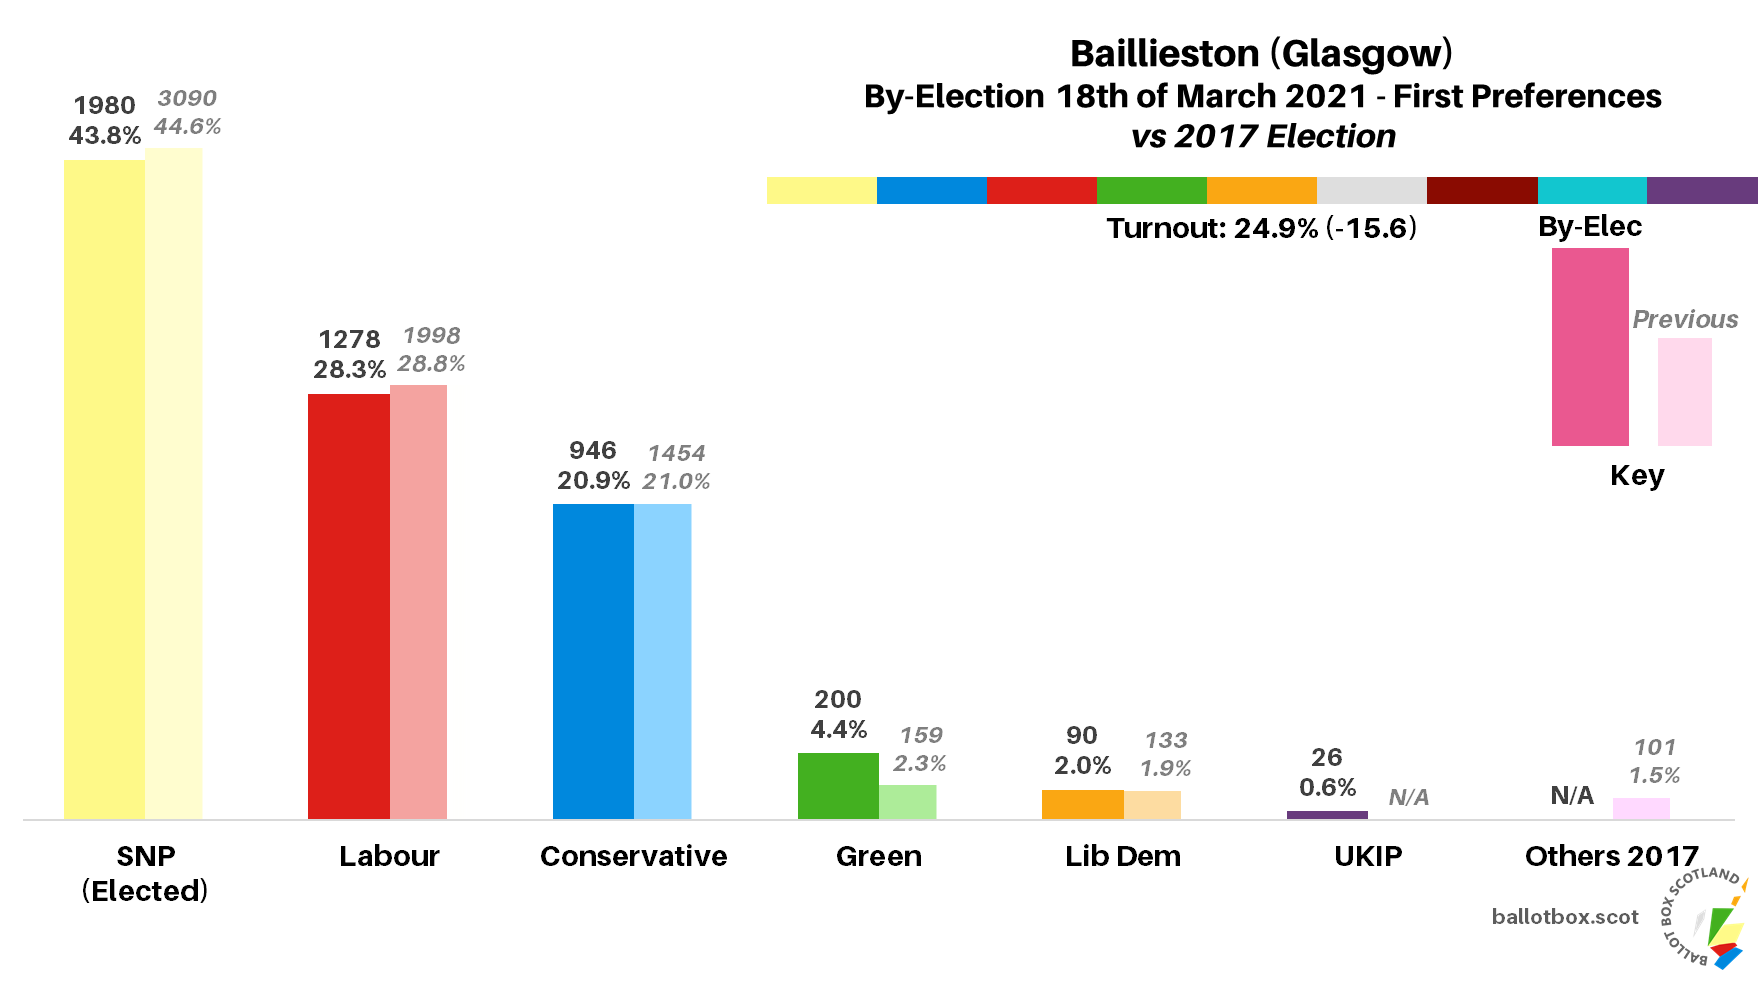
No surprises for me here, as the SNP came out with a pretty hefty lead. First preferences in full were (changes versus 2017 election):
SNP - 1980 (43.8%, -0.8)
Labour - 1278 (28.3%, -0.5)
Conservative - 946 (20.9%, nc)
Green - 200 (4.4%, +2.1)
Liberal Democrat - 90 (2.0%, +0.1)
UKIP - 26 (0.6%, +0.6)
Note that in the 2017 election the SSP won 1.2% and the Libertarians won 0.3%.
In fact, after all the excitement of PEK this one was very quiet indeed. There’s relatively little movement to be seen here, with very slight decreases for the SNP and Labour, a tiny bump for the Lib Dems in vote share, and the Greens almost doubling their vote here though from a much lower base. Eagle eyed readers may notice that the Labour vote share was the same in both of these by-elections, as was the Green share increase.
Transfers - Baillieston
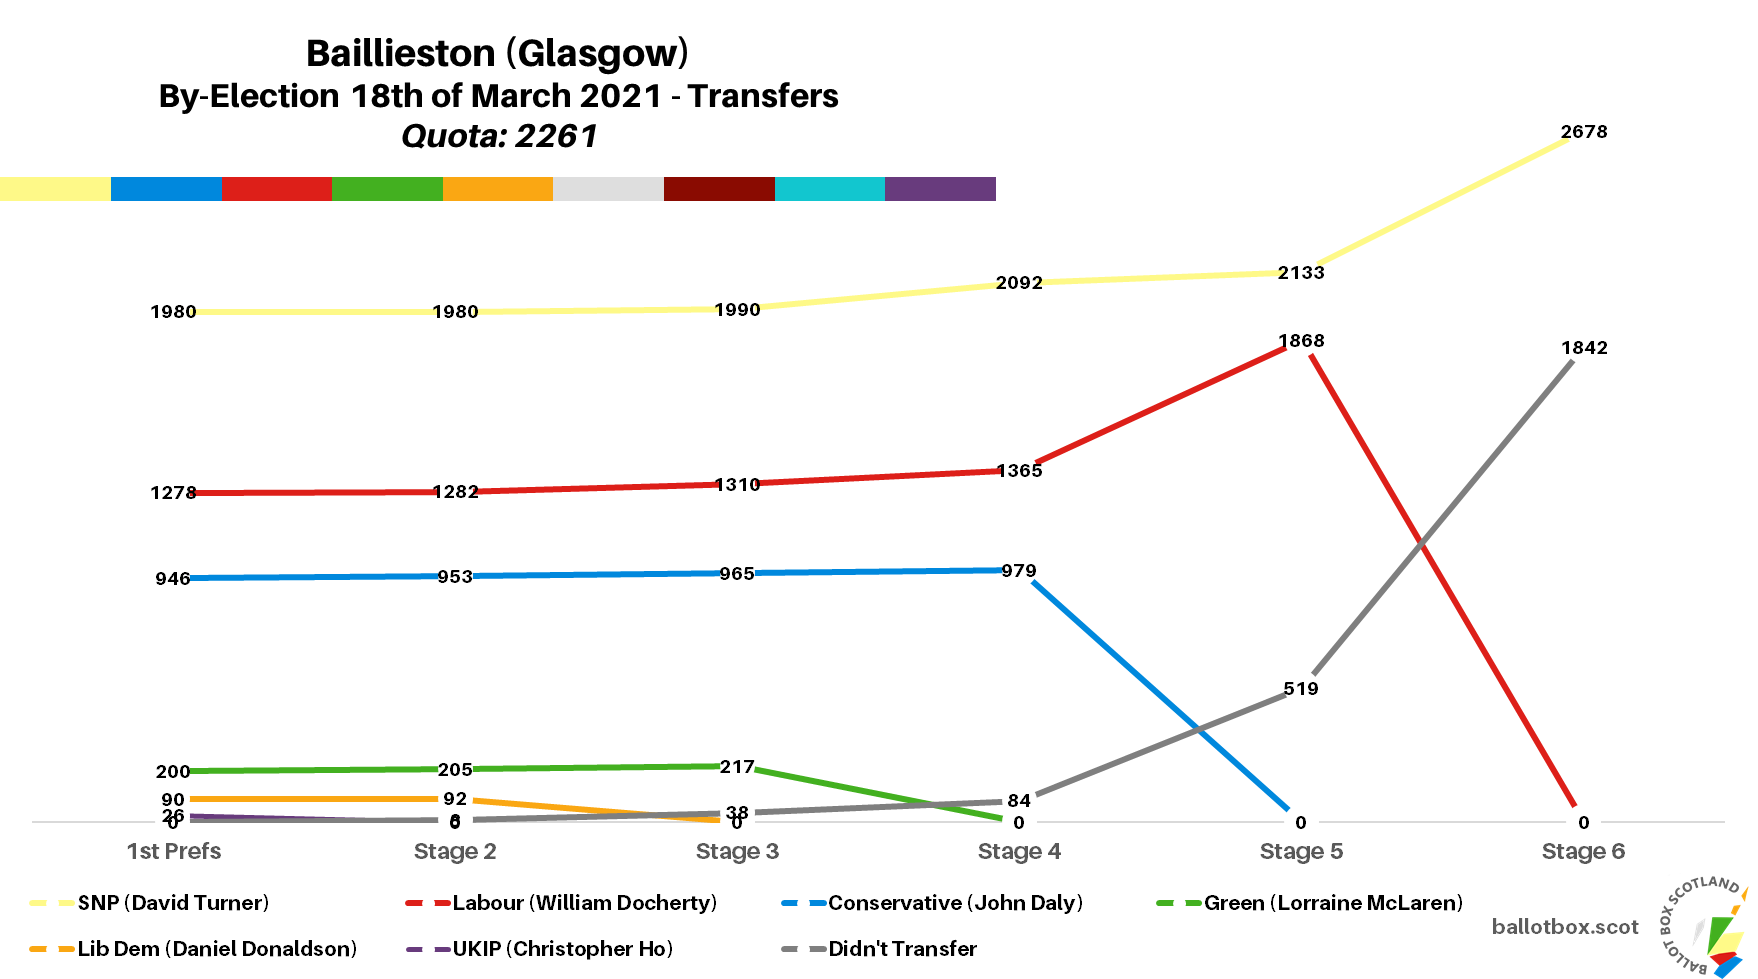
As no candidate had an outright majority of the vote, transfer rounds were necessary. The quota to reach here was 2261 votes.
Looking now at the transfers for the final head-to-head at stage 5 (changes vs final head-to-head stage in 2017 election re-calculation):
SNP - 2133 (47.2%, -0.3)
Labour - 1868 (41.3%, +4.0)
Didn't Transfer - 519 (11.5%, -3.7)
That substantial SNP lead proved resistant enough to hold the entire way through the count, though Labour did close the gap somewhat here too, giving them a positive day overall in the city.
Detailed Data - Baillieston
As with PEK, note that I had access to a better breakdown of boxes by district this time around.

Given the relatively static nature of overall first preferences, it shouldn’t be a shock to see the SNP out in front in every district, same as 2017. Of these, their best area was Queenslie, particularly the eastern end. Labour were once again at their peak amongst postal voters, though the district covering Swinton wasn’t far behind.
For the Conservatives, their most favourable area was the small district at the very western edge of Baillieston itself, whilst the Greens had the alliterative satisfaction of their greatest share in Garrowhill. Vote shares for the other two parties were simply too low to really notice any real areas of strength.
There was a blip with the data the council made available, so I’ve not been able to do the second preference chart for this one. As soon as I’ve got the data for that I’ll add it here – one chart doesn’t delay a full piece!
Nuances
Oh no, another post with nuances! Two weeks ago the North Lanarkshire by-elections had me (somewhat fruitlessly) trying to remind people to be very careful of applying gain-loss terminology to STV results based on what party had caused the vacancy. Though described by some as Labour gains, they were effective holds based on the recalculated 2017 single-seat winner, and saw the SNP closing the gap.
Then in the results piece for Livingston South last week, I’d cautioned against pinning national theories onto individual by-elections, but wondered if we may have been beginning to see a pattern of the SNP gaining ground at Labour’s expense. If the Glasgow by-elections showed similar dynamics, that would be the key test. I think we can now crumple that theory up and pop it in the bin.
Partick East/Kelvindale ended up the exact opposite of Livingston South. In first preferences the latter ward had been a small SNP increase and big Labour decrease, and an SNP gain over Labour in terms of re-calculated 2017 result. PEK was Labour’s vengeance, giving them an effective gain based on the 2017 result. Meanwhile, unlike the North Lanarkshire examples, it was Labour closing the gap with the SNP in Baillieston.
So, what does this mean for national politics? Answer: no idea, that’s why we have opinion polls! You can keep tabs on those via the Holyrood Hub.
If you find this or other Ballot Box Scotland output useful and/or interesting, and you can afford to do so, please consider donating to support my work. I love doing this, but it’s a one-man project and takes a lot of time and effort. All donations, no matter how small, are greatly appreciated and extremely helpful.
(About Donations)

