

Keep tabs on all the latest polling, articles and information ahead of the 2021 Scottish Parliament election in the Ballot Box Scotland Holyrood Hub!
We enjoyed two months on the trot from Ipsos MORI last autumn before they returned to hibernation – but as the first stirrings of spring melted away February’s heavy snows, they awoke with their third poll of the term. That’s another much-desired bit of polling diversity in a period where it’s mostly been ComRes and Survation carrying the Scottish polling torch.
Display format for this post:
- Party/Option – Vote% (Change vs last poll by agency 20th – 26th of November 2020 / vs last election or referendum)
Regional Vote
SNP ~ 47% (nc / +5)
Conservative ~ 22% (nc / -1)
Labour ~ 14% (-2 / -5)
Green - 8% (+1 / +1)
Liberal Democrat ~ 6% (nc / +1)
ISP ~ 1% (+1 / +1)
Although it’s been three months since the last poll from these guys, we’re seeing very little change here. Of the main parties, the SNP, Conservatives and Lib Dems are completely static. Labour drop two points here, and one of those is accounted for by the Greens going up one.
As I often do, at this point it’s worth being aware of particular house effects. Whereas I’m always highlighting that Survation are highly favourable to Labour, Ipsos MORI have tended to be least favourable to them. We won’t really know until polling day who was closest to reality, but it’s important to understand Labour’s result here as being roughly on par for Ipsos MORI rather than a definitive low. Similarly, they also tend to show the smallest gap between votes for the SNP.
You’ll also note a new addition at the bottom there from the ISP – the Independence for Scotland Party. This is the first time they’ve appeared in a poll, and since they round up to 1% I’ve included them here. Emphasis on the “round up” though – the precise figure is 0.65%. At this point I’m going to be rather frank about the party’s prospects.
For a few months now, some folk have been popping up to insist that the ISP (or similar minor parties) should be included in polling. Some of this was “you have to include them, they are a registered party”, apparently unaware there are circa 150 parties registered in Scotland! Some real corkers too, if you want a look – the barrier to registration is not high. More of it though was on the basis that failure to include them was disguising their true level of support.
Well, now they’ve been included, and it’s clear there isn’t all that much support. Lest anyone fall back on 3% margins of error, remember that as explained in the guide on this website, that margin gets smaller the further from 50% you get. At 0.65%, margin of error is less than 1%. In likely outcome, I’d put money on the ISP and their fellow travellers being this election’s RISE. A whole lot of noise in the social media bubble, some people who follow everyone involved with an inflated sense of their size, but zero cut-through to the general voting public.
Constituency Vote
SNP ~ 52% (-3 / +5)
Conservative ~ 23% (+1 / +1)
Labour ~ 15% (+1 / -8)
Liberal Democrat ~ 5% (-1 / -3)
Green - 3% (+2 / +2)
There’s a lot more movement, though largely within margins of error, over on the Constituency vote, with each of the Holyrood 5 experiencing movement. For the SNP and Lib Dems, that’s downwards, dropping 3% and 1% respectively. In contrast to their list figure, Labour are actually up narrowly here, and a 2% jump for the Greens puts them not far off overtaking the Lib Dems on this vote too – but that would require them to stand the constituency candidates to deliver, which is very unlikely.
Seat Projection
Please see this page for how projections work and important caveats.
SNP ~ 72 (-1 / +9)
Conservative ~ 26 (-1 / -5)
Labour ~ 17 (-2 / -7)
Green ~ 9 (+4 / +3)
Liberal Democrat ~ 5 (nc / nc)
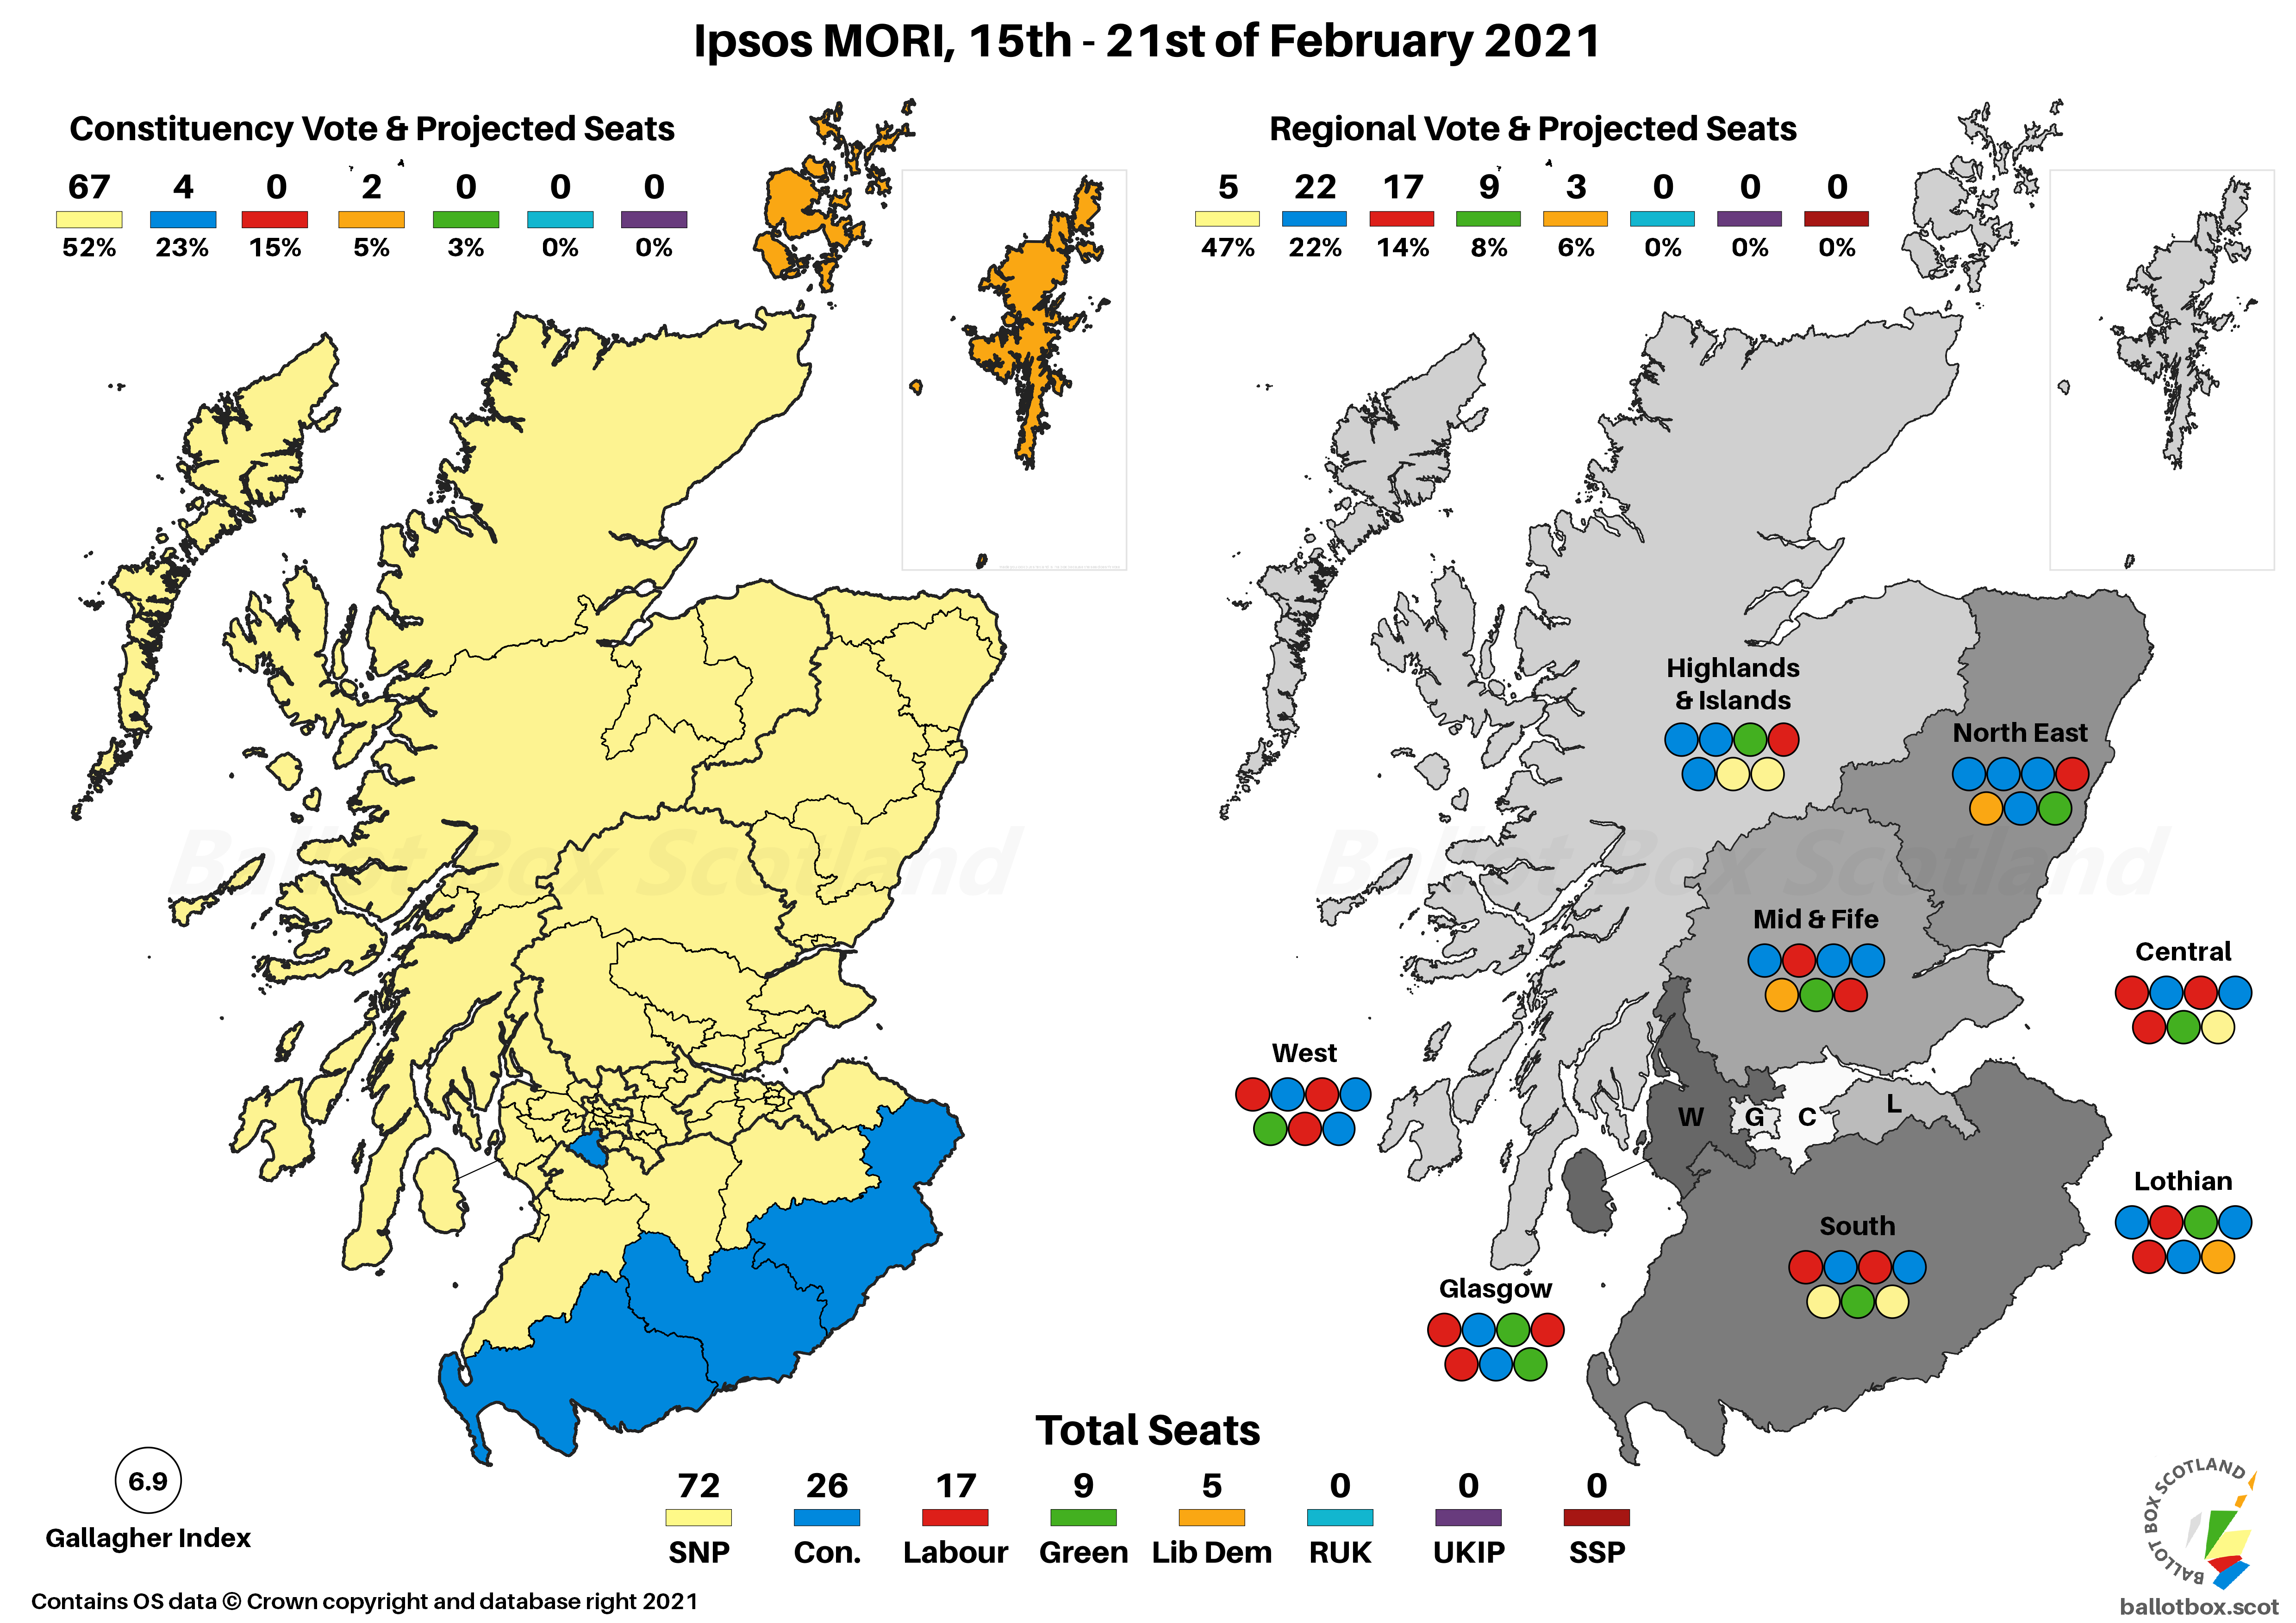
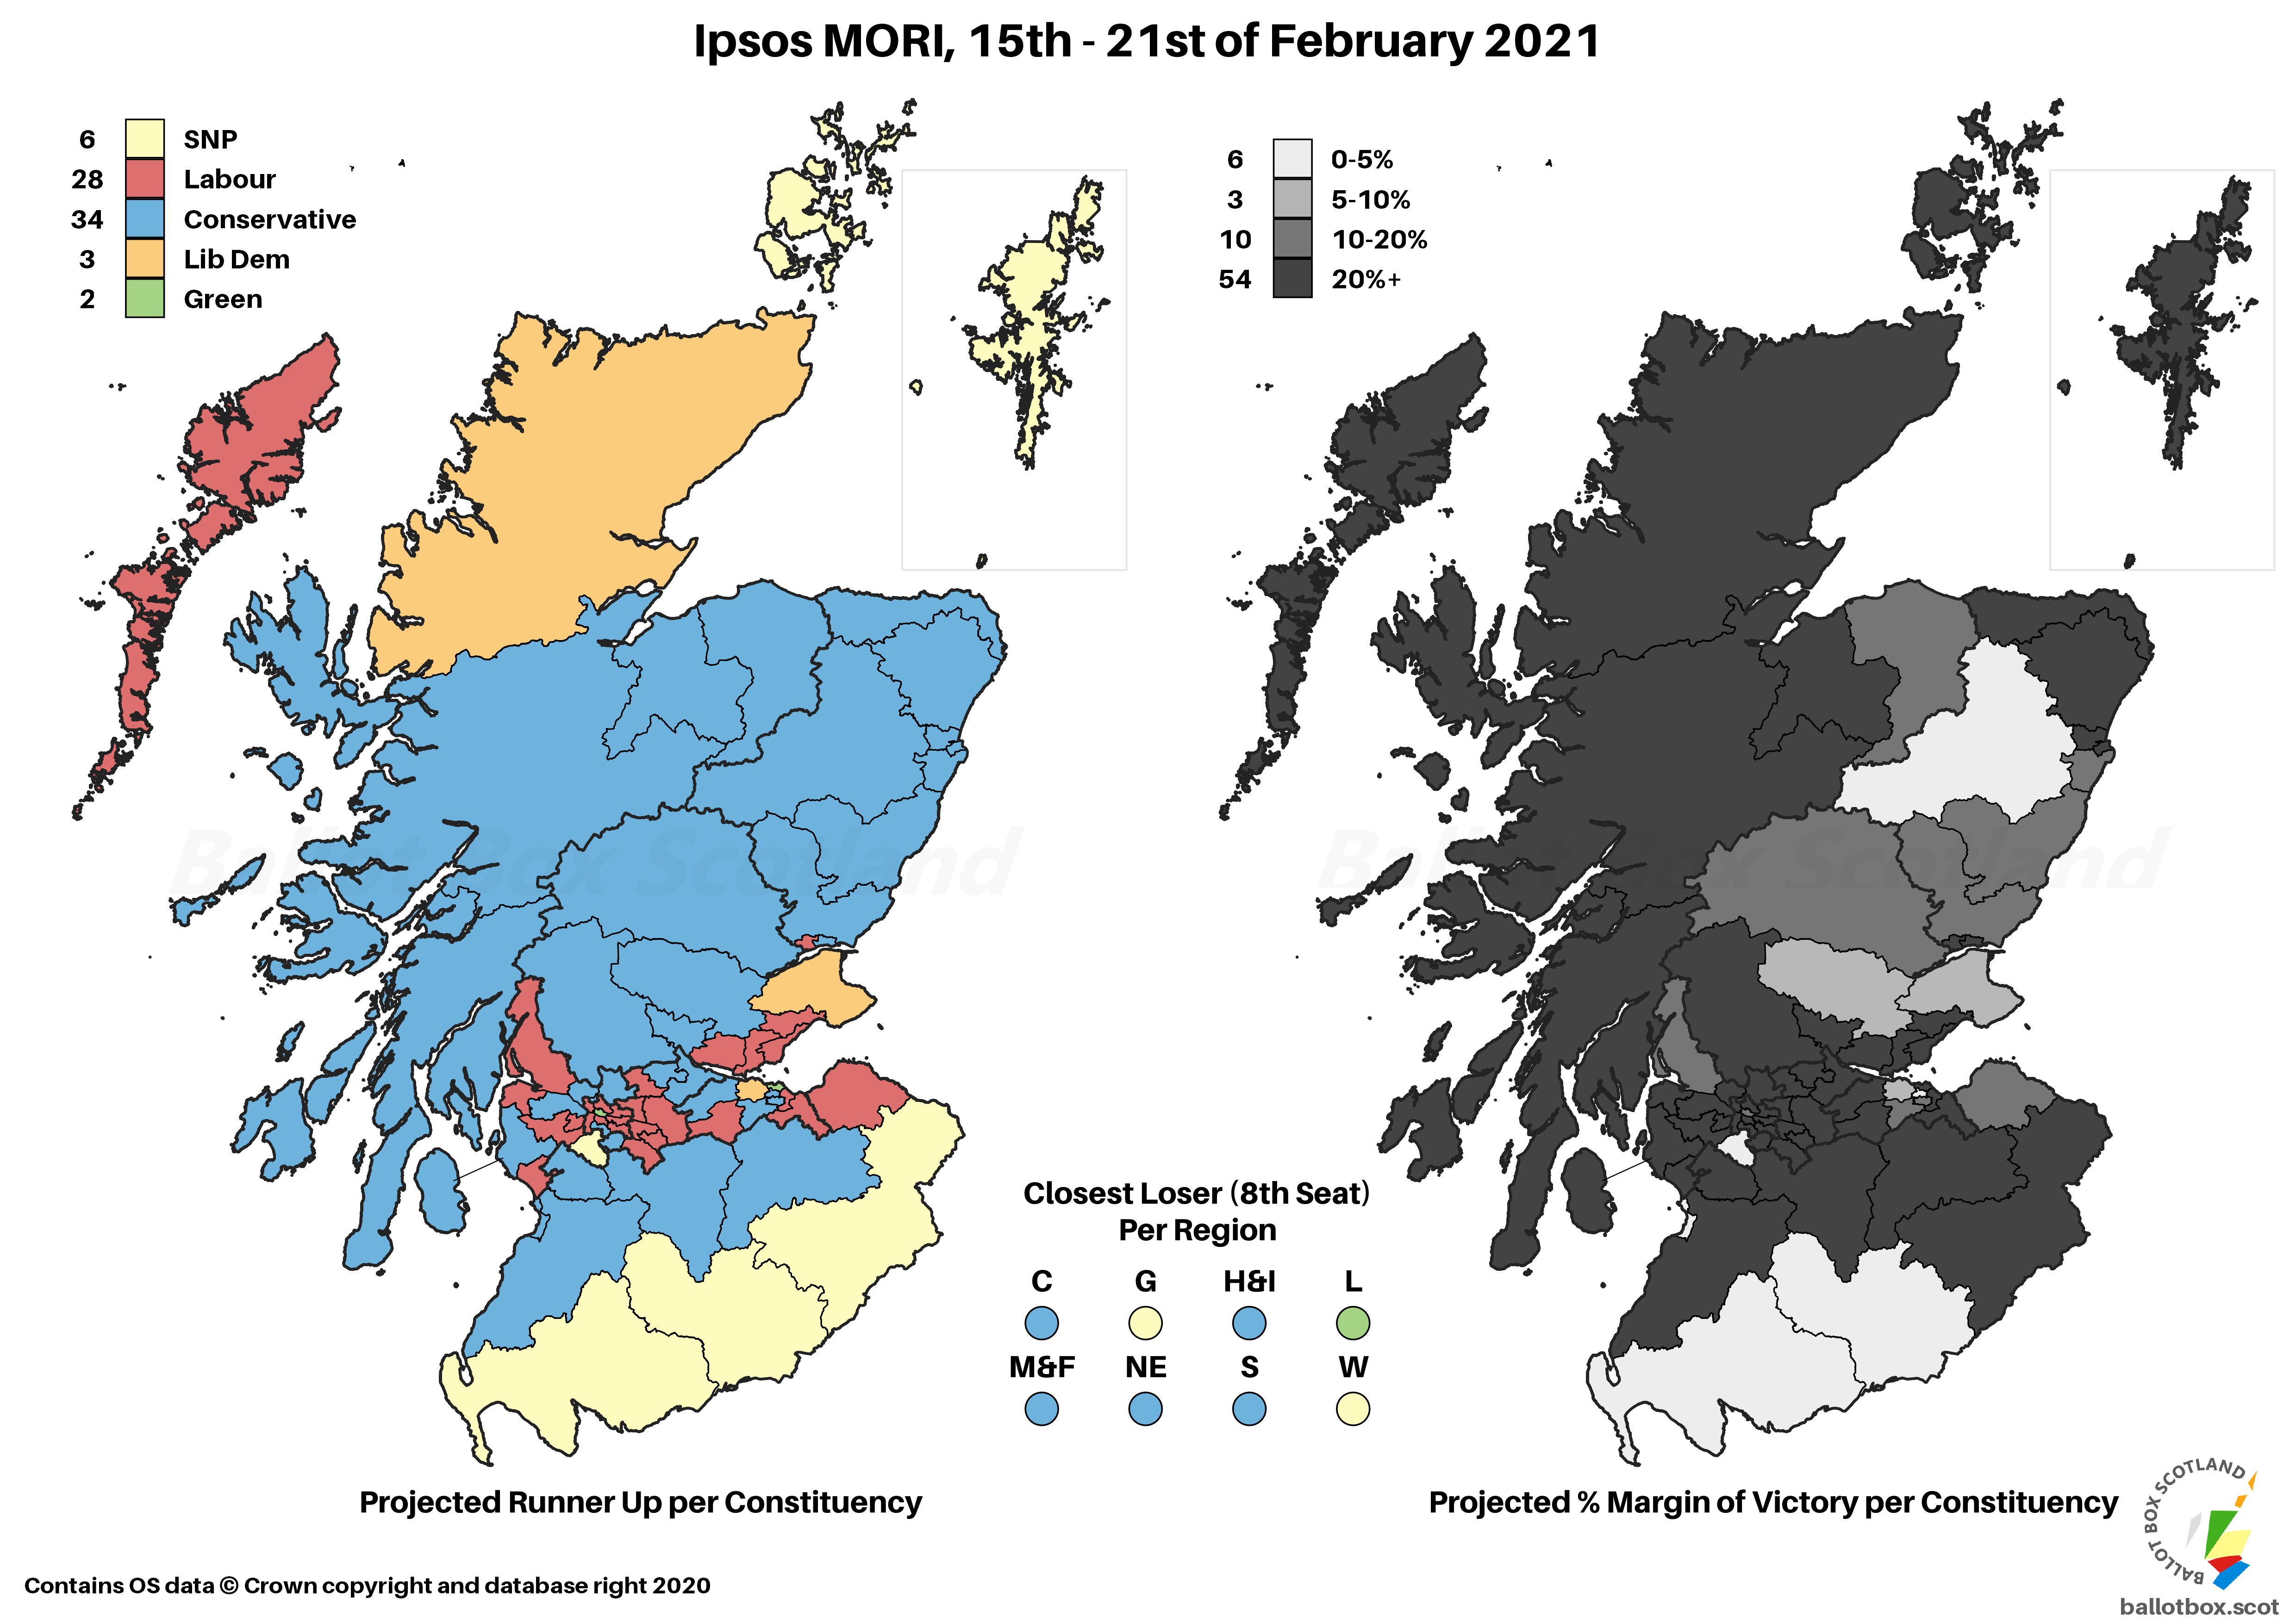
No surprises that this poll continues the trend of stonking SNP majorities – though movement here is all in the Greens’ favour, showing what a difference 1% of the vote makes to the projection, thanks to their relatively even spread of support outside of the two big city regions. Usual caveats about projections apply, but it’s also worth noting that this is the first poll since early October that has the Conservatives projected to win more constituencies than just their Borders stronghold.
No Westminster VI from Ipsos MORI either, I’m afraid!
Standard Question
Yes ~ 48% (-5)
No ~ 44% (+3)
Don't Know ~ 7% (+1)
Another poll with a big dip for Yes, bringing it back below an absolute majority of respondents. It’s still showing a reasonable lead over No, but if this trend continues things will flip towards the Union before long. This is particularly notable given that Ipsos MORI have typically found the most Independence-favourable figures.
Excluding Don't Knows
Yes ~ 52% (-4 / +7)
No ~ 48% (+4 / -7)
That decline brings the cursèd numbers into play for the straight Yes-No result, and is a marked decrease from the (joint) record 58% Ipsos MORI found in October. We’re getting close to the point at which the past year’s remarkable lead for Independence may evaporate.
Council Area Projection
Please see this page for how projections work and important caveats.

On a simple Uniform Swing versus 2014, this might put a total of 17 Councils in the Yes column, an increase on the 4 in 2014. No would be on 15, down from 28 at the referendum.
Holding Another Referendum
I sort of wish pollsters would come to an agreement about some good questions to ask on this front, because it’s rather inconsistent. Anyway, rather than “when should another referendum be held” which has been the ComRes approach, Ipsos MORI have asked whether there should be a referendum if the SNP win a majority of seats. This came out at:
- Definitely Should – 43%
- Probably Should – 13%
- Probably Should Not – 7%
- Definitely Should Not – 34%
- Don’t Know – 4%
So in the scenario of an SNP majority, 56% of people think there should be a referendum, versus 41% who don’t. As ever there’s a point to be made here about whether it’s wise to view the legitimacy of actions in a parliamentary system as riding on a single-party (SNP) rather than whole-parliament (SNP+Green) majorities but that’s a standard BBS democratic structures niggle.
The poll also asked what should happen if the UK Government were to refuse to allow an SNP majority government to hold a referendum:
- Hold it anyway – 18%
- Take the UK Government to court – 34%
- Accept it can’t be held in that term – 42%
- Something Else – 2%
- Don’t Know – 3%
Only a minority would want the Scottish Government to charge ahead anyway, but many more would be content for it to take its UK counterpart to court to try and force a legal referendum. That’s effectively 52% for some kind of “take action” outcome versus 42% for “don’t hold it”, which are pretty close to the figures for whether folk think there should be a referendum at all. Quelle surprise!
Hypotheticals
As ever, the last little bit of analysis concerns those hypothetical and more proportional voting systems that I have a bee in my bonnet about here at BBS. The fact Westminster uses pure FPTP is an affront to democracy, and though Holyrood fares far better, AMS is still deeply imperfect. The examples here simply transpose the poll findings onto more proportional voting systems – the reality is that different systems would of course result in different voter behaviour.
Changes here are vs AMS / vs same projection for the last poll.
SNP ~ 62 (-10 / nc)
Conservative ~ 29 (+3 / nc)
Labour ~ 18 (+1 / -3)
Green ~ 12 (+3 / +3)
Liberal Democrat ~ 8 (+3 / nc)

It’s mostly the usual story here – a fair bit fewer SNP seats, whilst everyone else is better off. However, just as it is with AMS, 8% is something of a tipping point for the Greens thanks to their relatively even vote distribution. 12 seats is marginally too many for them, as the Sainte-Laguë method of apportioning seats stands them in good stead for the directly elected seats. This is after I’d swapped from D’Hondt as it could sometimes be too favourable to the SNP as the largest party!
This would still be far, far better than AMS, but it is worth the note that we’d need either slightly bigger districts or more of the seats to be filled from the national vote to absolutely guarantee complete proportionality in every case. A useful reminder perfection is nigh-on impossible to achieve.

If you find this or other Ballot Box Scotland output useful and/or interesting, and you can afford to do so, please consider donating to support my work. I love doing this, but it’s a one-man project and takes a lot of time and effort. All donations, no matter how small, are greatly appreciated and extremely helpful.
(About Donations)


