

Keep tabs on all the latest polling, articles and information ahead of the 2021 Scottish Parliament election in the Ballot Box Scotland Holyrood Hub!
Though they were missing for most of this term, it’s good to see that Ipsos MORI are back into the swing of Scottish Parliament polling – perhaps thanks to a partnership with STV. Today’s release of data is their second poll, following one in early October. Between them and Savanta ComRes, we’ve had a welcome influx of new sources of polling to join the Panelbase-YouGov-Survation trifecta that had dominated since I started this project.
Display format for this post:
- Party/Option – Vote% (Change vs last poll by agency 2nd – 9th of October / vs last election or referendum)
Regional Vote
SNP - 47% (nc / +5)
Conservative - 22% (+3 / -1)
Labour - 16% (+3 / -1)
Green - 7% (-2 / nc)
Liberal Democrat - 6% (-2 / +1)
No change at the top here with the SNP on the same as the last poll, with all movement amongst the opposition parties. Both the Conservatives and Labour are up by 3%, which in Labour’s case lifts them substantially back above what was close to rock bottom.
The flip side is drops of 2% (this will be down to rounding, largely) for both the Greens and Lib Dems. That’s on the low end of recent polling for them, though still marginally up in both cases versus 2016, whereas the two larger parties are down on that measure.
Constituency Vote
SNP - 55% (-3 / +8)
Conservative - 22% (+3 / nc)
Labour - 18% (+1 / -5)
Liberal Democrat - 6% (-2 / -2)
Green - 1% (nc /nc)
For the constituency figure the SNP have dipped somewhat, which shouldn’t be a surprise given the last poll found their highest figure since 2016. By contrast, this one is “a bit above average”, which is nonetheless remarkably high in general terms.
Gains here again for the Conservatives and Labour, though more so the former, which come partly at the expense of the Lib Dems. This is more average for Constituency polling for the party, which may be interesting when you consider that in both 2011 and 2016 they did better in the Constituency than the List vote.
Seat Projection
Please see this page for how projections work and important caveats.
SNP - 73 (+1 / +10)
Conservative - 27 (+4 / -4)
Labour - 19 (+3 / -5)
Green - 5 (-5 / -1)
Liberal Democrat - 5 (-3 / nc)

As you’d expect with the SNP polling so far ahead, this is another poll that gives them a majority, and the changes since the last poll are mostly amongst the opposition. Given their decline in list vote share, there are sharp drops for both the Greens and Lib Dems, whilst Labour and the Conservatives are on the up.
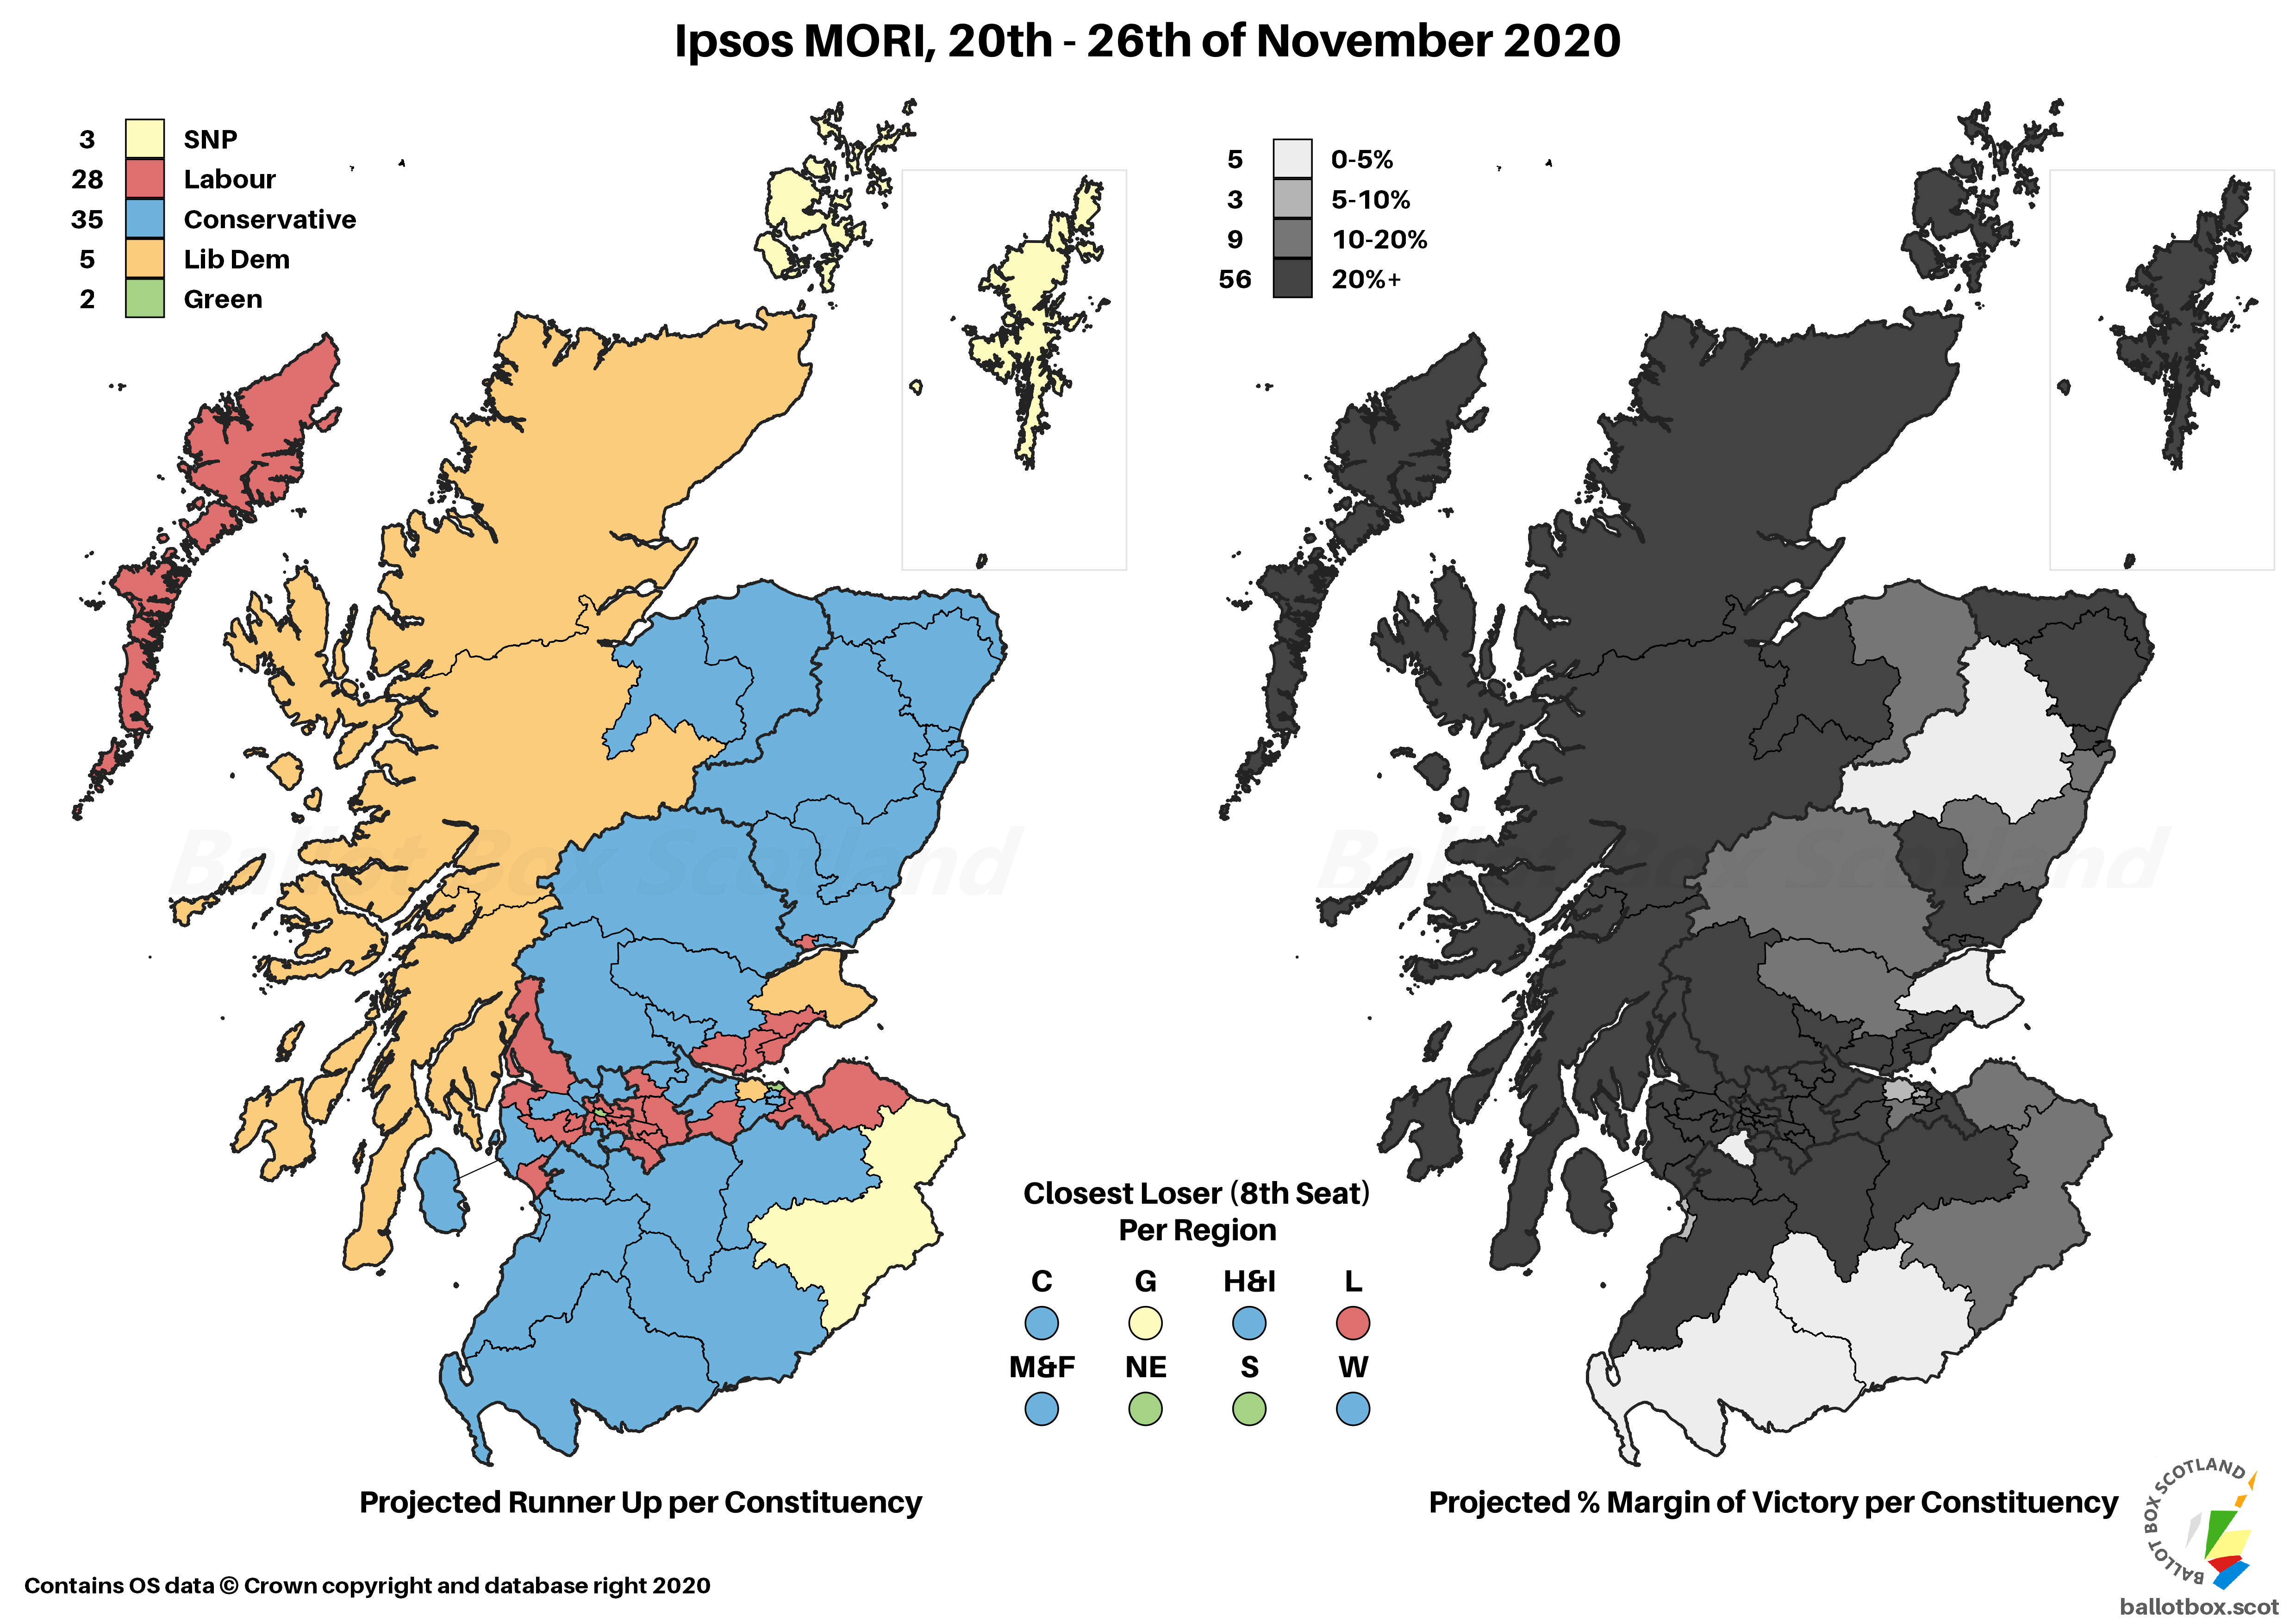
If you look at the second image (the less exciting one for most folk, I imagine!) you’ll notice a small addition. Following a query on Twitter I’ve included the closest loser in each region – i.e. who would win a hypothetical 8th list seat? This can be thought of as the regional equivalent of the constituency runner up, at least in terms of this graphic.
Again, there isn’t any UK Parliament voting intention in this poll. We’re a long way off the next election – though the UK Parliament is now moving to repeal the ill-fated Fixed Term Parliaments Act, so the 2024 date is unlikely to be set in stone. Of course, neither were 2020 (replaced by the 2017 snap) or 2022 (replaced by 2019 snap)!
Standard Question
Yes - 53% (-2)
No - 41% (+2)
Don't Know - 6% (nc)
The previous Ipsos MORI poll had given an abnormally high figure for Yes, even at a time Independence has been leading in the polls. Although still on the higher end of recent polling, shifting 2% between Yes and No gives a more normal looking result for the current moment.
Excluding Don't Knows
Yes - 56% (+6 / +11)
No - 44% (+2 / -11)
Although this is slightly above the average, it does keep our (arbitrary) five poll average figure bang on the 54% I’ve previously said seems to be the current settling point. As Holyrood approaches, we might begin to see this shift more – though we can’t be sure in which direction.
Council Area Projection
Please see this page for how projections work and important caveats.

On a simple Uniform Swing versus 2014, this might put a total of 26 Councils in the Yes column, an increase on the 4 in 2014. That’d leave 6 for No, down from 28 at the referendum.
Hypotheticals
As ever, the last little bit of analysis concerns those hypothetical and more proportional voting systems that I have a bee in my bonnet about here at BBS. The fact Westminster uses pure FPTP is an affront to democracy, and though Holyrood fares far better, AMS is still deeply imperfect. The examples here simply transpose the poll findings onto more proportional voting systems – the reality is that different systems would of course result in different voter behaviour.
Changes here are vs AMS / vs same projection for the last poll.
SNP - 62 (-11 / -1)
Conservative - 29 (+2 / +4)
Labour - 21 (+2 / +4)
Green - 9 (+4 / -4)
Liberal Democrat - 8 (+3 / -3)

As ever, the SNP’s over-representation via FPTP is eliminated, to the benefit of all of the other parties. The Greens and Lib Dems in particular show how much things can change when you’re inhabiting the lower end of the seat-winning vote shares, doing substantially better in a nationally proportional system than the regionalised AMS.

If you find this or other Ballot Box Scotland output useful and/or interesting, and you can afford to do so, please consider donating to support my work. I love doing this, but it’s a one-man project and takes a lot of time and effort. All donations, no matter how small, are greatly appreciated and extremely helpful.
(About Donations)


