
Background
We had three by-elections taking place across Scotland on the 11th, in wildly varying political arenas. We’ll start with Leaderdale and Melrose in the Scottish Borders, as the Council are currently my absolute favourites for getting all of the data for this online the same day as the count.
Sadly, this one had been prompted by the death of SNP councillor Kevin Drum. They’d only narrowly won the last seat in the ward in 2017, which had much more strongly backed the Conservatives and a long-serving local Independent.
Based on that 2017 result I reckoned the Conservatives were the only party in with a chance of winning, but a strong local Independent could trump them. That wasn’t grounded in any knowledge of the two independents standing – rather, it was a general assumption that can often be made for wards in rural councils…
First Preferences
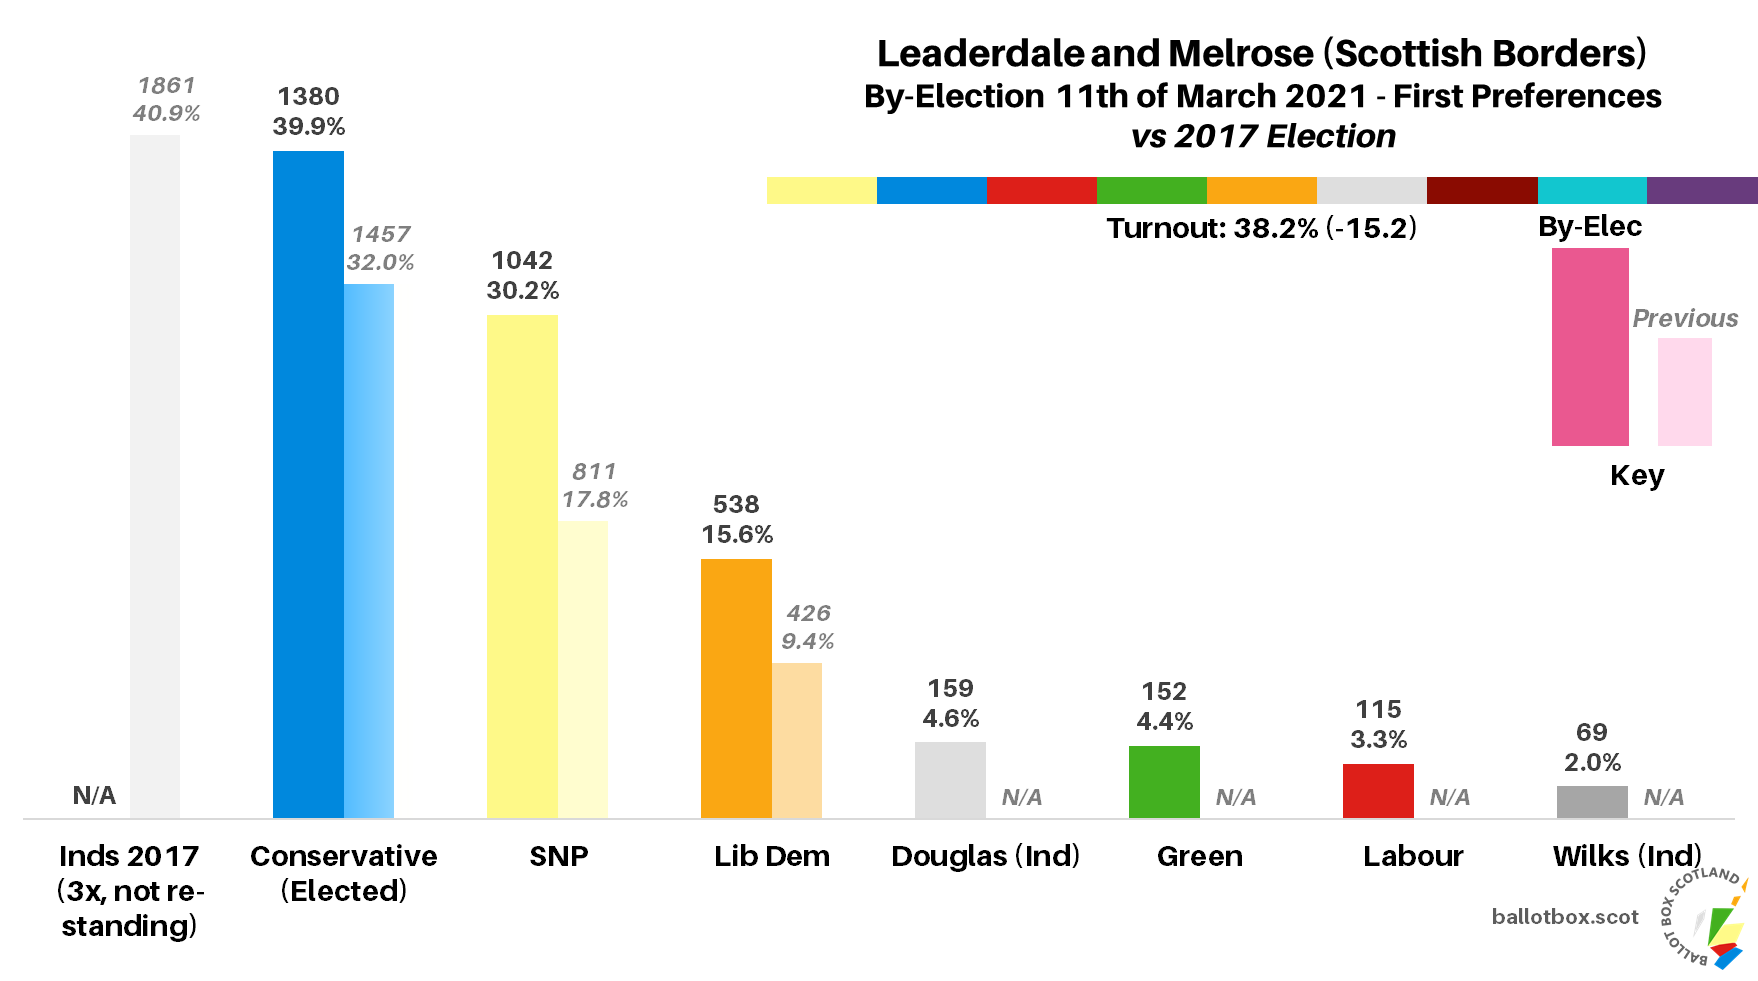
That wasn’t an assumption I needed to make this time around, as neither of those independents proved particularly notable. Instead, it was a clear Conservative-SNP scrap for the seat. First preferences in full were (changes versus 2017 election):
Conservative - 1380 (39.9%, +8.0)
SNP - 1042 (30.2%, +12.4)
Liberal Democrat - 538 (15.6%, +6.2)
Douglas (Independent) - 159 (4.6%, +4.6)
Green - 152 (4.4%, +4.4)
Labour - 115 (3.3%, +3.3)
Wilks (Independent) - 69 (2.0%, +2.0)
Note that in the 2017 election the combined total for three Independent candidates not standing here (including one elected councillor) was 40.9%.
Though the Conservatives came out with a very clear lead here, I was actually a little bit surprised by how well the SNP did – I wasn’t really expecting them to cross the 30% mark in this particular ward, even at a by-election. The Lib Dems also put in a very respectable showing, growing their share quite substantially.
Everyone else was fresh on the ballot so don’t really compare to 2017. People are often surprised when the Greens come ahead of Labour in Scotland, but both were quite small in this by-election and it’s not particularly uncommon in rural Scotland for them to place this way round. I also regret to inform you that I must, by internet law, refer to Wilks vote total as “nice.”
Transfers
As no candidate had an outright majority of the vote, transfer rounds were necessary. The quota to reach here was 1728 votes.
Looking now at the transfers for the final head-to-head at stage 6 (changes vs final head-to-head stage in 2017 election re-calculation):
Conservative - 1653 (47.8%, +5.1)
SNP - 1297 (37.5%, +8.7)
Didn't Transfer - 505 (14.6%, -13.8)
Gains for both parties on this measure too, as often happens when you’ve removed popular serving Independent councillors from the equation and thus fewer votes end up exhausted early on. As with first preferences, the gap between the two has narrowed here, though the Conservatives still finished quite comfortably ahead. Though as noted above we should be careful of comparing too much with 2017, I think this may indicate the SNP will be a bit comfier for winning a seat here at the full election in 2022.
Detailed Data
Machine counts mean some really juicy data, starting with the breakdown of results per polling district. Note that there’s one district with a “PP” designation here which indicates that in-person and postal ballot boxes were merged during the count process.

For the in-person votes there’s quite a neat bisecting of the Conservative leaning districts to either side of some SNP led ones. In the northern and more rural expanse of the ward the Conservatives were ahead in the districts covering Oxton, Lauder and Nether Blainslie, as well as in the southern more urban areas covering Darnick, Melrose and Newstead, plus the postal vote. Of these, Melrose was most strongly tinted blue.
The SNP meanwhile took the lead in the districts encompassing Tweedbank, Gattonside and Earlston, recording their best performance in Tweedbank. Turning to the other candidates, the Lib Dems were also most popular in Tweedbank, whilst Darnick was most favourable to all of Douglas, the Greens and Labour. Finally, Wilks clearly had her base of support somewhere around Earlston and/or Gattonside.
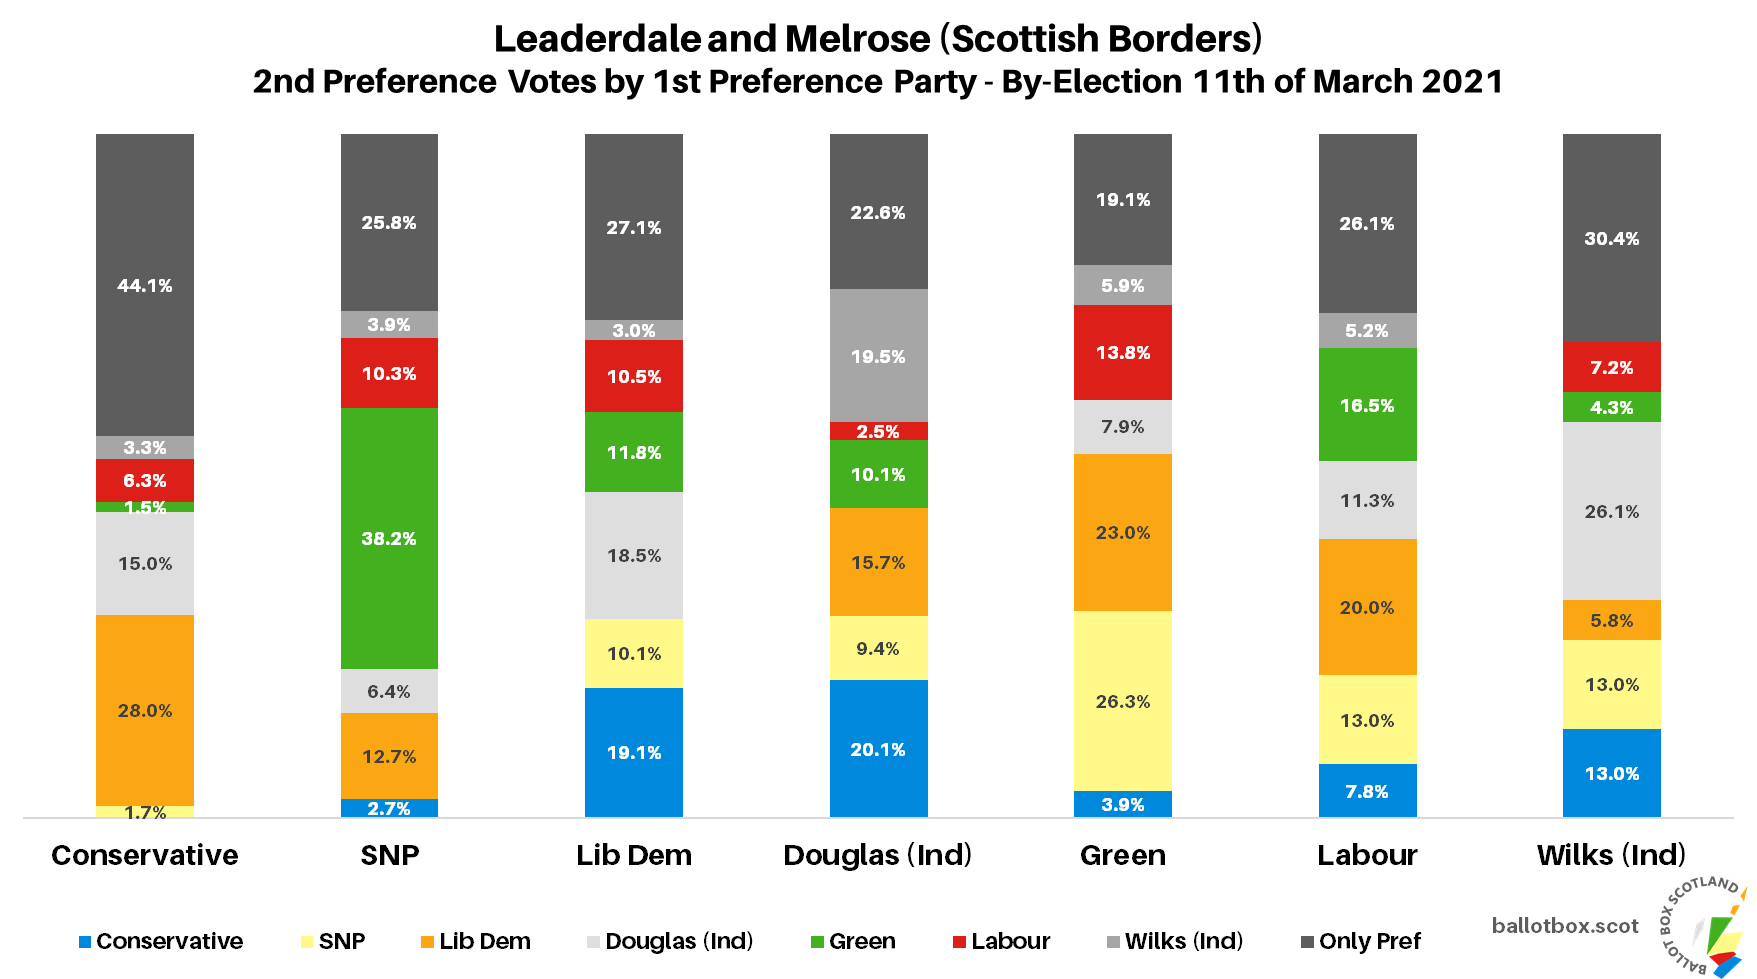
Now, let’s end by having a look at the second preference votes, bearing in mind we can’t get those simply from the transfer chart.
What’s interesting here is the relative lack of strong preference clusters. The strongest relationship is SNP to Green, but the return is weaker and not too far ahead of the Lib Dems. Almost half of Conservative voters didn’t mark a second preference, though about half of those who did plumped for the Lib Dems, who in return were relatively split between Conservatives and Douglas.
Of the Independents, Douglas’ voters almost evenly favoured the Conservatives and Wilks, whilst Wilks more strongly preferred Douglas. Finally, Labour support was most likely to transfer to the Lib Dems, though not massively more than to the Greens.
That wraps us up for the Borders – data for the other two by-elections held on March the 11th should be available early in the week, allowing me to put out those pieces on Monday and Tuesday. I’d take it as a kindness if no one did any new Holyrood polling between now and then…


