

Keep tabs on all the latest polling, articles and information ahead of the 2021 Scottish Parliament election in the Ballot Box Scotland Holyrood Hub!
If it wasn’t enough polling for us all to have had five polls from the five different agencies who have been doing Holyrood polling recently, we got an extra treat this week from new wean on the Scottish block, Opinium. This is, as far as I’m aware, the first time they’ve done Scotland specific polling recently. Avid followers of BBS will know I’m always on the lookout for more diversity amongst polling sources, so this is very welcome indeed.
Display format for this post:
- Party/Option – Vote% (vs last election or referendum)
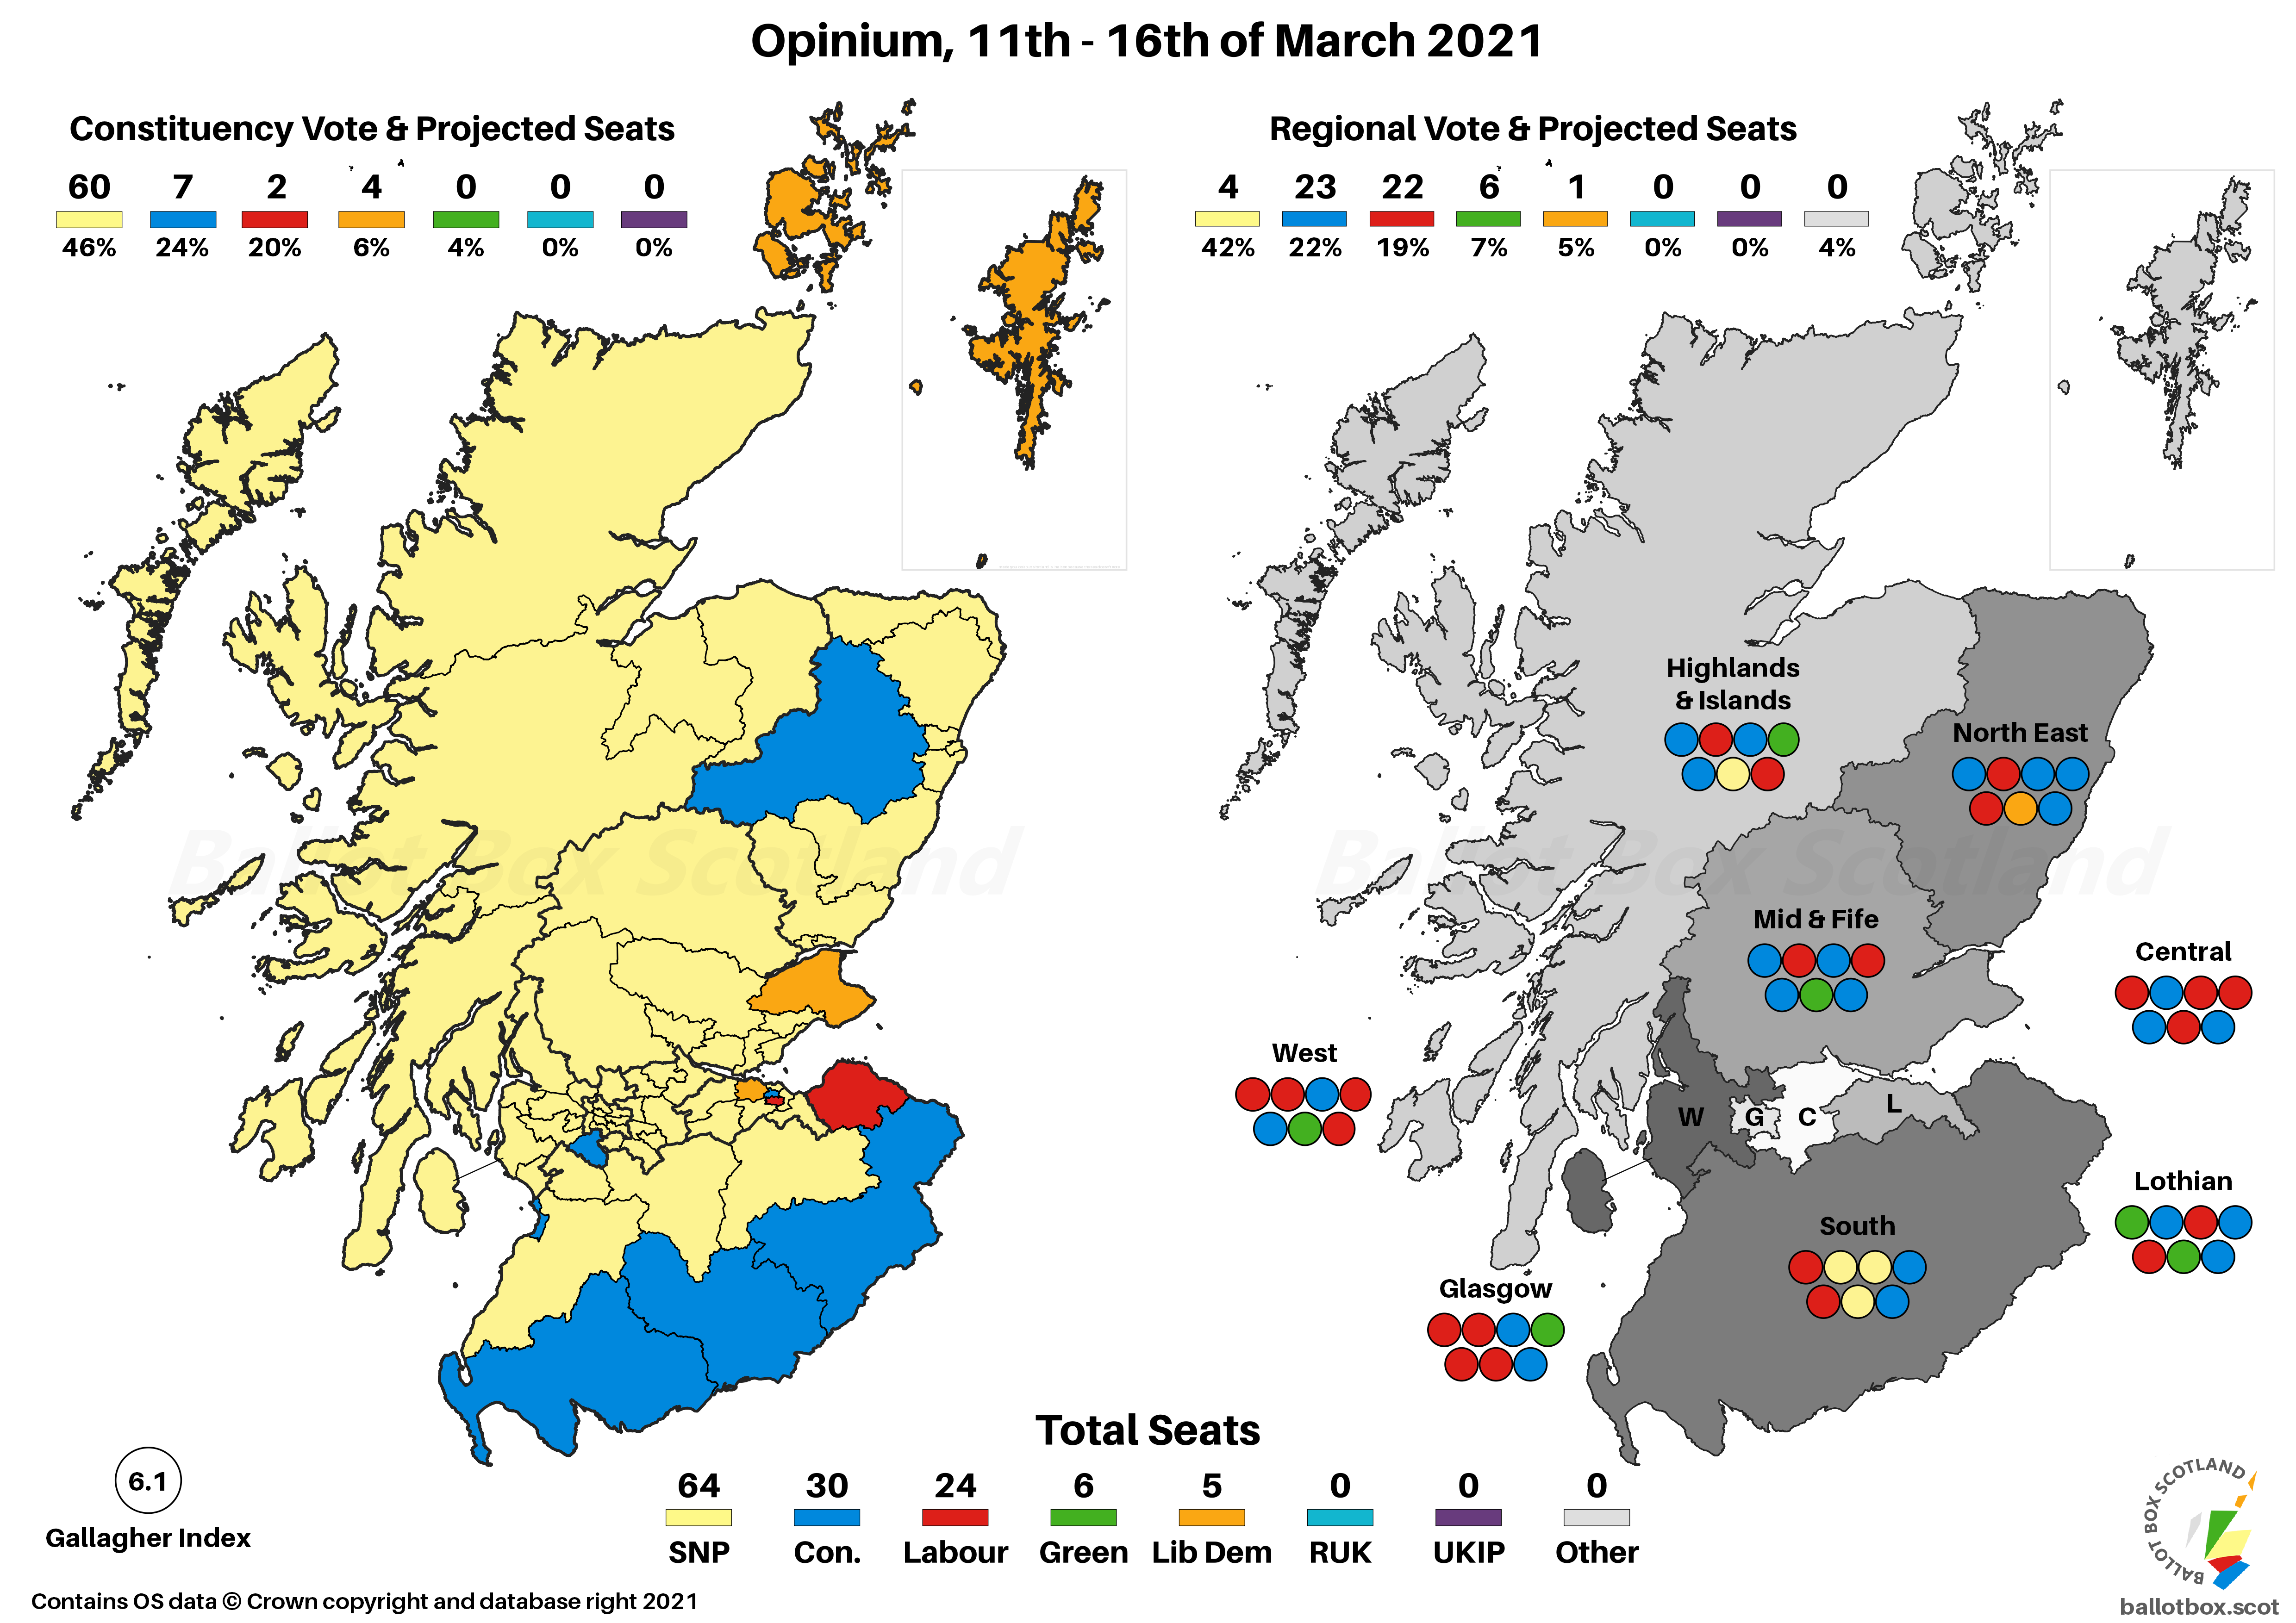
Regional Vote
SNP ~ 42% (nc)
Conservative ~ 22% (-1)
Labour ~ 19% (nc)
Green ~ 7% (nc)
Liberal Democrat ~ 5% (nc)
Good as it is to have a new pollster, this poll felt like a bit of a damp squib – which is absolutely not their fault! That’s because it is almost entirely status quo versus 2016, with only a slight dip for the Conservatives. In recent polling context though, that is somewhat notable, as it means a relatively good result for Labour and the Conservatives, and a relatively disappointing one for the other three parties.
On BBS Twitter I had reported figures for the SSP, Reform UK and – most interestingly – the Alliance for Unity, which is (one of) George Galloway’s latest wheeze(s). I’ve not quoted those figures here, as I’d pulled them very quickly from the tables and hadn’t realised that page was all respondents and not adjusted for “likely to vote” like the other headline figures. The perils of table styles varying between pollster!
Constituency Vote
SNP ~ 46% (-1)
Conservative ~ 24% (+2)
Labour ~ 20% (-3)
Liberal Democrat ~ 6% (-2)
Green ~ 4% (+3)
There’s a lot more movement on the Constituency vote. The SNP remain clearly ahead but this is their worst figure since before the 2019 UK Election, and also the first time since then it has been below their 2017 result, albeit very marginally. In contrast to their list shares, the Conservatives are up and Labour are down by a fair chunk, as are the Lib Dems.
A particularly intriguing little bit here is that 4% is the joint best Green share in a constituency poll, and you have to go back to March 2017 to find the previous one. Though the Greens seem on track to contest a few more constituencies than they did in 2016, they are still unlikely to be present in most. That means this is unlikely to manifest even if it was an accurate reading of intention, but it shows a closer alignment between their constituency and list vote than we usually see.
Seat Projection
Please see this page for how projections work and important caveats.
SNP ~ 64 (+1)
Conservative ~ 30 (-1)
Labour ~ 24 (nc)
Green ~ 6 (nc)
Liberal Democrat ~ 5 (nc)
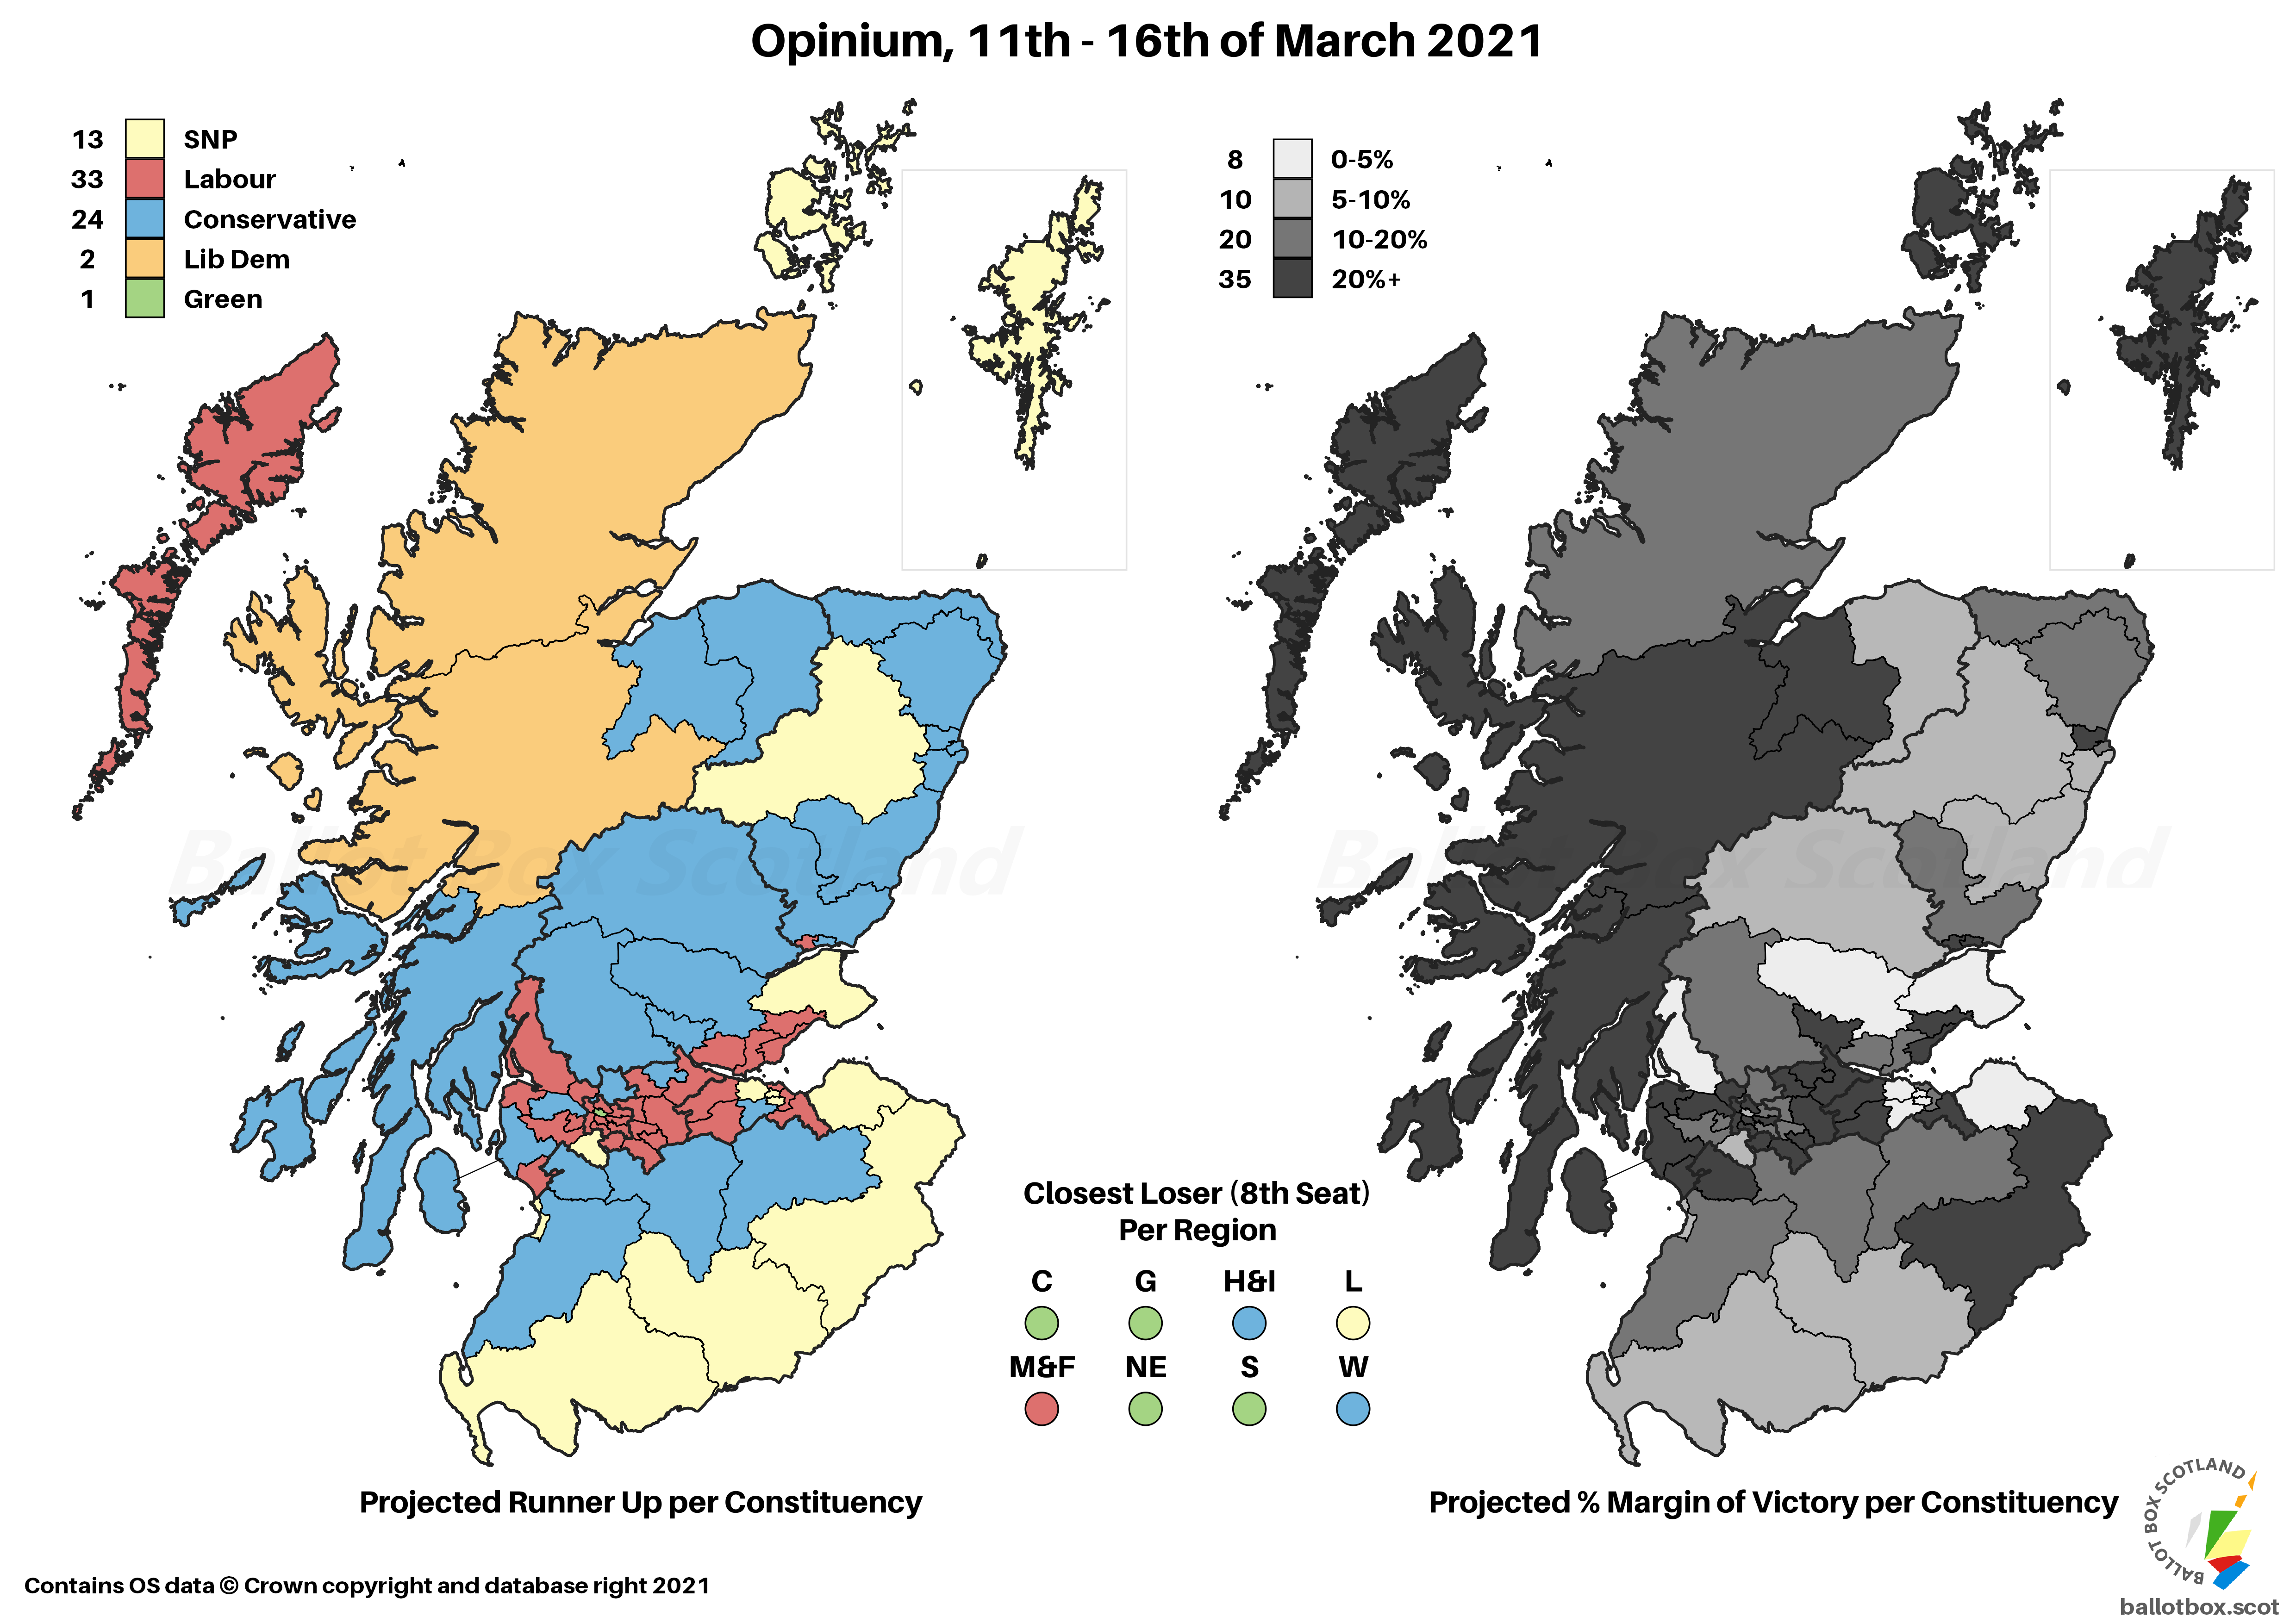
The fact there was practically no movement versus 2016 on the list vote, which is the bit that most impacts the overall shape of parliament, means there’s practically no movement in seats either. It’s just the SNP gaining a solitary seat from the Conservatives, though via the convoluted path of Labour losing Dumbarton and bumping the last Conservative list MSP off in the West. That does make this the first poll in quite some time with Labour constituencies in the projection though!
It’s a point made in the caveats page explaining projections, but it’s especially worth remembering that even when national vote shares are the same, it doesn’t mean local results will be. Projections are always imperfect indicators, so really bear that in mind here.
SNP ~ 50% (+5)
Conservative ~ 23% (-2)
Labour ~ 19% (nc)
Liberal Democrat ~ 5% (-5)
Green ~ 3% (+2)
Reform UK ~ 1% (nc)
Although we have a lot of different polling agencies churning out Holyrood stuff at the moment, very few of them are doing Westminster. I can’t complain too much as it’s often the other way around, but I’m still very pleased to have a new source for this side of things too.
Perhaps surprisingly given their relatively low Holyrood polling, the SNP are up at 50% for Westminster. Given this is yet another disastrously low figure for the Lib Dems and that the Conservatives drop a bit too, this would likely tip most of the remaining non-SNP seats their way if it happened.
Standard Question
Yes ~ 46%
No ~ 45%
Don't Know ~ 9% (nc)
(Note: These aren’t directly quoted, I’ve drawn these figures from deeper in the tables, and have excluded the refused numbers. Unlike the Holyrood figures, the headline Yes-No was all responses rather than only likely voters.)
Although this shows Yes ahead after a few other polls suggesting things were the other way around, it’s mostly just further confirmation we’re in margin of error territory at the moment.
Excluding Don't Knows
Yes ~ 51% (+6)
No ~ 49% (-6)
That translates to a very marginal lead again for Yes once we exclude don’t knows. It’s not a very big lead though, and given of the previous four polls two were ties and two had the Union at 51%, it has tipped my (arbitrary!) 5-poll average tracker narrowly to the Union for the first time since last February. Emphasis on the narrowly – it’s 50.2% vs 49.8%!
Council Area Projection
Please see this page for how projections work and important caveats.

On a simple Uniform Swing versus 2014, this is the awkward 15 lean Yes, 15 lean No, 2 are entirely on the fence projection. I have to say it would be extremely Scotland if in any future Independence referendum there was a dead heat in a council area.
Other Independence Questions
As is quite common at the moment, there were questions on the circumstances and timing of a possible Independence referendum. Starting with “if there’s an SNP majority”:
- In the next two years ~ 32%
- In the next five years ~ 14%
- Further in the future ~ 15%
- Shouldn’t be one ~ 33%
- Don’t Know ~ 6%
A clear majority of voters do want another referendum at some point if the SNP win a majority, but there’s a very narrow lead of 48% vs 46% against holding one in the next term of parliament.
Then they were asked about a general Pro-Independence majority of MSPs rather than purely SNP:
- In the next two years ~ 30%
- In the next five years ~ 14%
- Further in the future ~ 15%
- Shouldn’t be one ~ 34%
- Don’t Know ~ 7%
There isn’t a massive difference here, though it’s 49% vs 44% against holding one in this term. It’s interesting that this framing flips enough people to reverse the opinion – as I’ve noted previously, I do have some democratic qualms about qualifying parliamentary decisions on a single party majority!
Finally, if it was a pro-Union majority:
- In the next two years ~ 27%
- In the next five years ~ 13%
- Further in the future ~ 16%
- Shouldn’t be one ~ 36%
- Don’t Know ~ 8%
This breaks 52% vs 40% against having one this term. It shouldn’t really be a surprise that a majority is opposed to a referendum in those circumstances, albeit that there is clearly a large core that just wants to get to vote regardless.
Hypotheticals
As ever, the last little bit of analysis concerns those hypothetical and more proportional voting systems that I have a bee in my bonnet about here at BBS. The fact Westminster uses pure FPTP is an affront to democracy, and though Holyrood fares far better, AMS is still deeply imperfect. The examples here simply transpose the poll findings onto more proportional voting systems – the reality is that different systems would of course result in different voter behaviour.
Changes here are vs AMS:
SNP ~ 56 (-8)
Conservative ~ 30 (nc)
Labour ~ 26 (+2)
Green ~ 10 (+4)
Liberal Democrat ~ 7 (+2)

As this model always does, there would be a fair bit fewer SNP seats here, with almost everyone else gaining. Nonetheless, a narrow pro-Independence majority would exist with the Greens, at 66 to 63 seats for the pro-Union parties.

Scandinavian Style Westminster
No changes here as this is a new pollster and given my aversion to doing projections on pure FPTP.
SNP - 29
Conservative - 14
Labour - 11
Liberal Democrat - 3 (+1)
Green ~ 2 (nc)

Obviously this would be massively different to FPTP where the SNP would likely achieve an almost clean sweep on these figures. Though the SNP have half of the vote, the spread for other parties just about works out to prevent them from winning a majority of seats. Like Holyrood though, the Greens would tip the overall pro-Independence camp across the line, though that’s generally less relevant at Westminster.
If you find this or other Ballot Box Scotland output useful and/or interesting, and you can afford to do so, please consider donating to support my work. I love doing this, but it’s a one-man project and takes a lot of time and effort. All donations, no matter how small, are greatly appreciated and extremely helpful.
(About Donations)


