

Keep tabs on all the latest polling, articles and information ahead of the 2021 Scottish Parliament election in the Ballot Box Scotland Holyrood Hub!
There’s only a few months to go until the election, so of course polls are coming thick and fast. Panelbase are the third pollster to crop up this year, which gives us some much needed diversity – as ever, it’s always better to hear from lots of sources rather than the same ones repeatedly.
Display format for this post:
- Party/Option – Vote% (Change vs last poll by agency 5th – 11th of November 2020 / vs last election or referendum)
Regional Vote
SNP ~ 46% (nc / +4)
Conservative ~ 20% (nc / -3)
Labour ~ 16% (-1 / -2)
Green - 8% (nc / +1)
Liberal Democrat ~ 6% (nc / +1)
This is a very quiet poll in itself, with the only change being Labour dropping a point. Everyone else is exactly where they were in November’s poll. However, reflecting on that diversity point, this is notably different to both of the other polls this year (from ComRes and Survation).
Effectively, Panelbase tend to find better results for the SNP and the Conservatives – the latter being comfortably ahead of Labour rather than behind as they were with the other agencies. They also tend to find weaker results for the Greens and Lib Dems. As ever, we don’t know which pollsters, if any of them, are correct, which is why I like to get that diversity of sources in the hopes it balances individual variations out a bit.
Constituency Vote
SNP ~ 52% (-1 / +5)
Conservative ~ 20% (-1 / -2)
Labour ~ 17% (-1 / -6)
Liberal Democrat ~ 6% (+1 / -2)
Green - 3% (nc / +2)
There’s a bit more movement on the Constituency side of things, though still very little, with some almost certainly rounding-induced declines of a single percent for the SNP, Conservatives and Labour, and up a point for the Lib Dems. That takes them away from their record low figure in the last poll, and cuts a particular contrast with Survation’s comparatively mighty 9%.
Seat Projection
Please see this page for how projections work and important caveats.
SNP ~ 72 (nc / +9)
Conservative ~ 24 (nc / -7)
Labour ~ 19 (nc / -5)
Green ~ 9 (nc / +3)
Liberal Democrat ~ 5 (nc / nc)

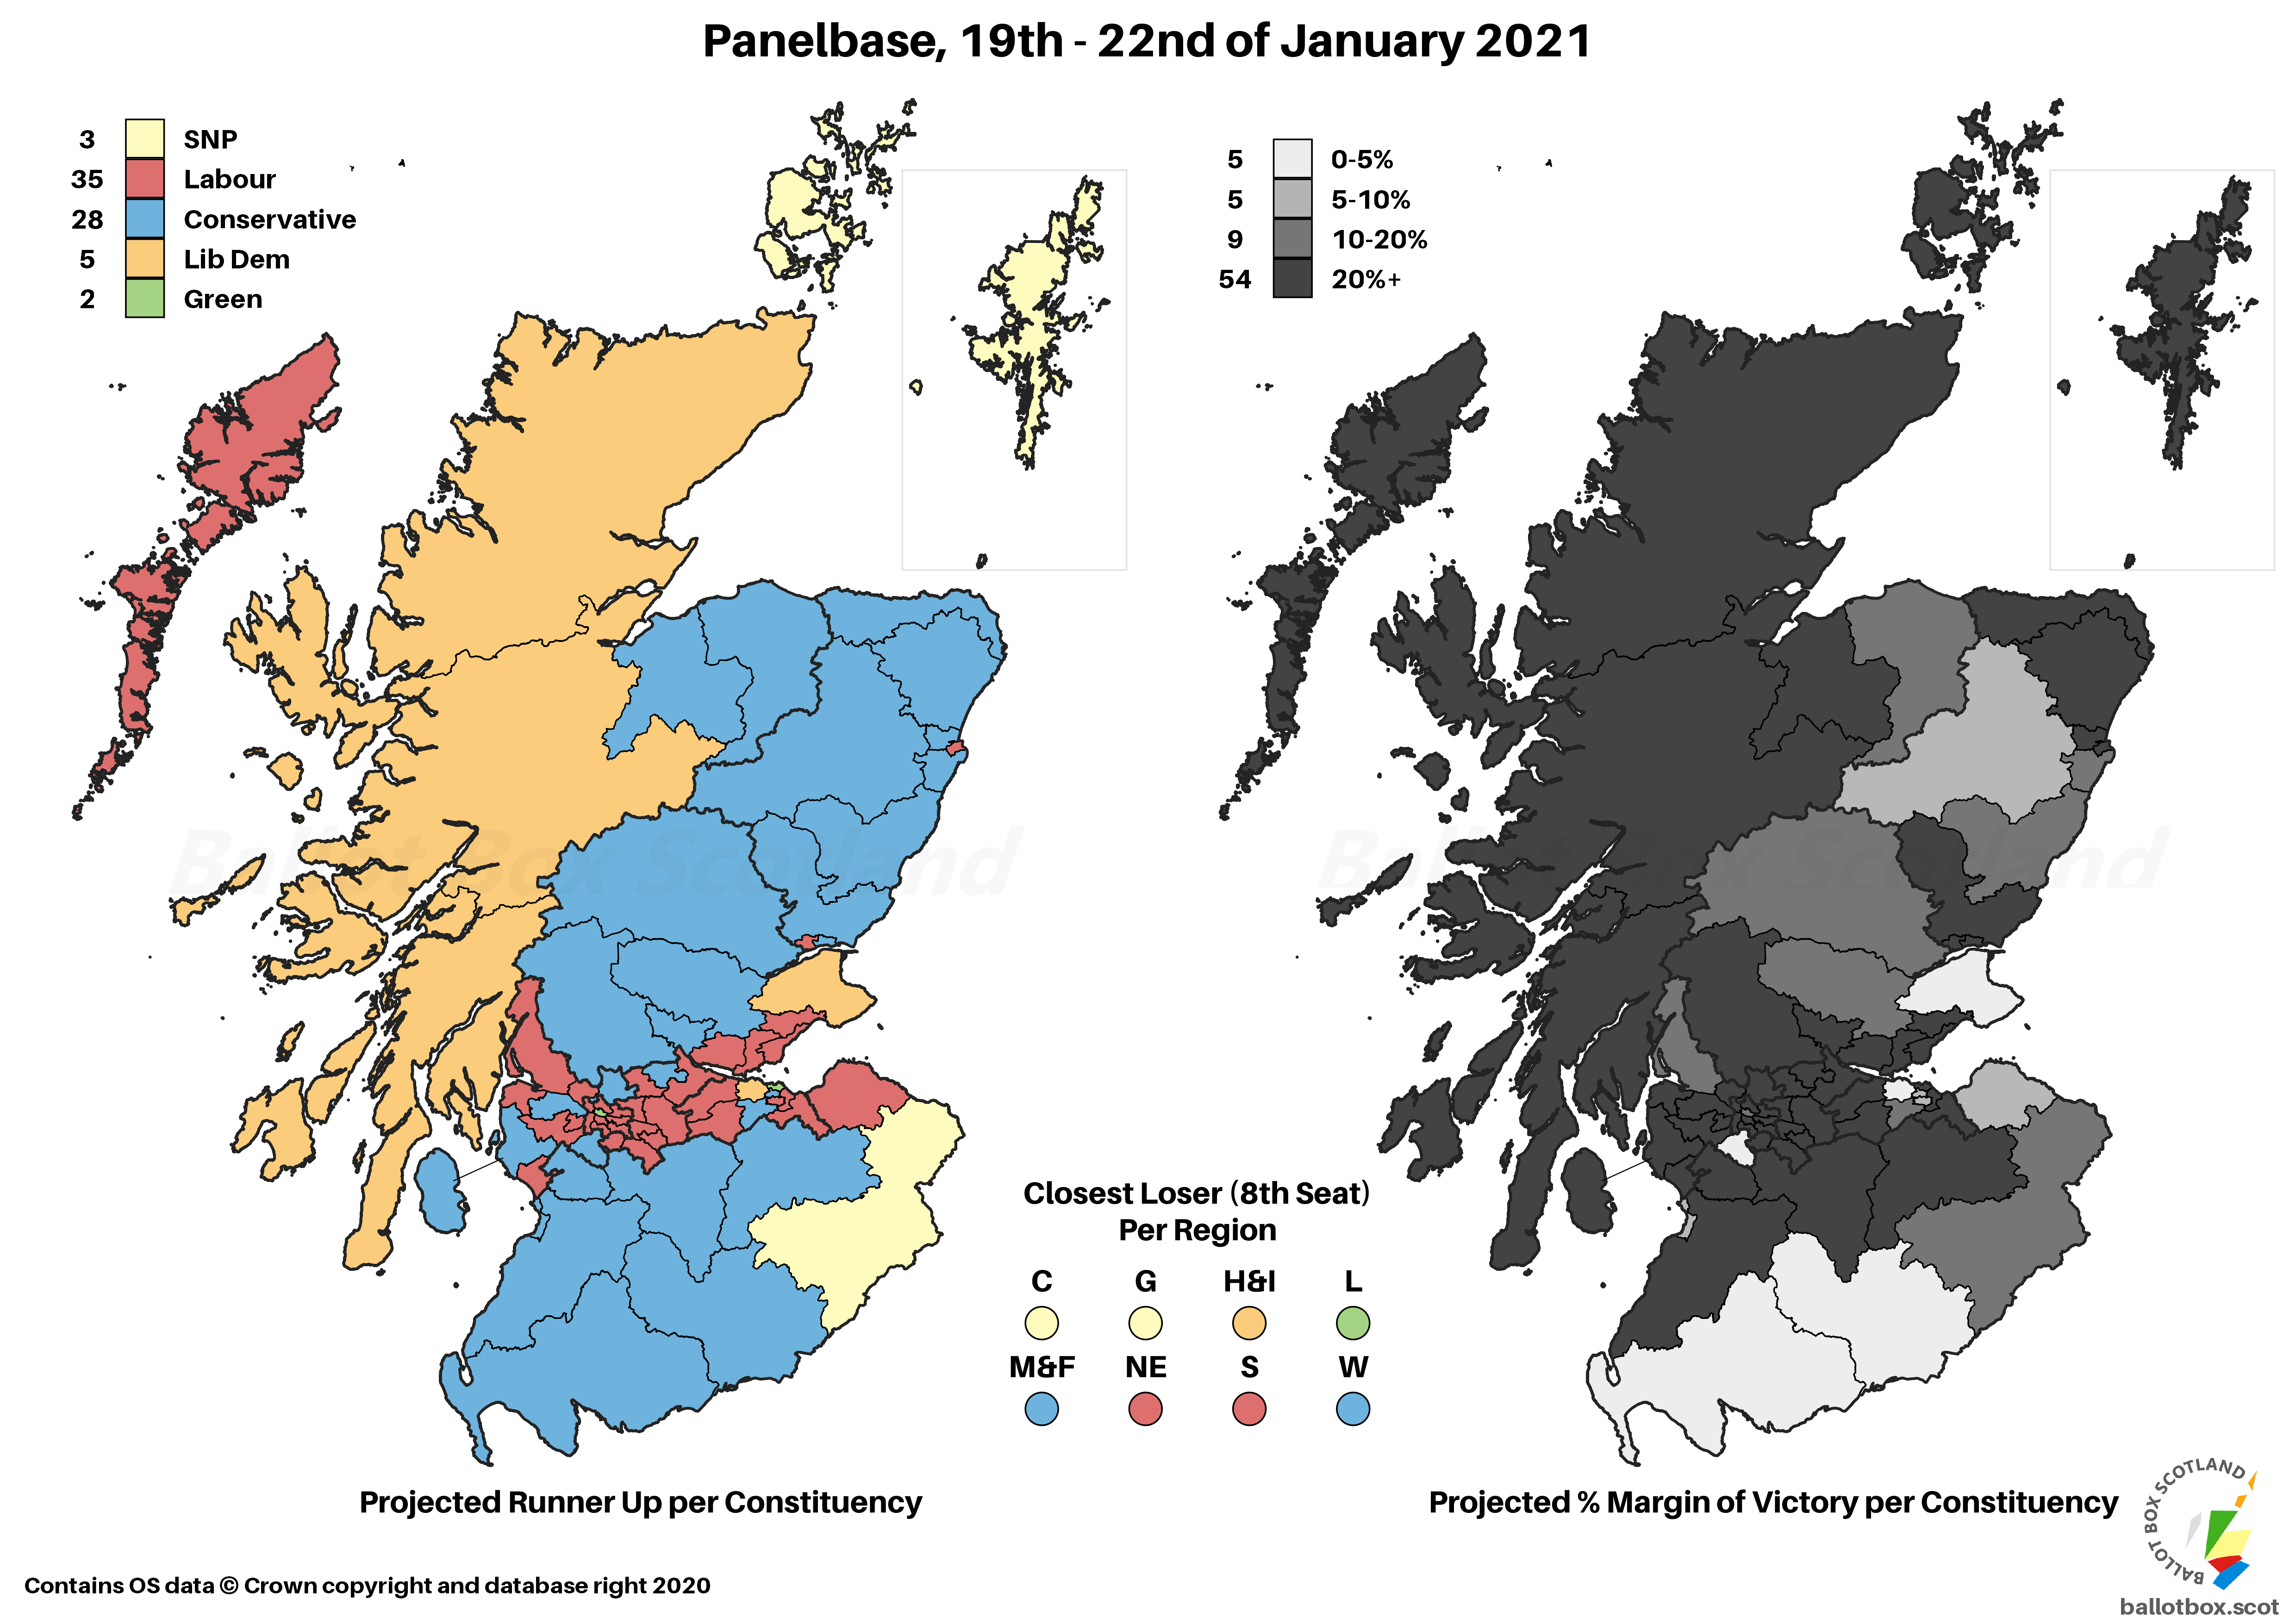
As the list vote changes were basically non-existent, and that’s the vote which actually determines the overall shape of parliament, there weren’t any changes to the seat total versus the last poll either. It’s the same story as all recent polling of an SNP majority, but compared to the other agencies’ polls this year keeps the Conservatives in second.
Doesn’t seem to have been any Westminster VI in this poll – it might just be taking a bit longer to release, and I’ve scheduled this post for the day after I’ve written it so it could have emerged since then! If it does pop up, I’ll edit to add.
Standard Question
Yes ~ 49% (-2)
No ~ 44% (+4)
Don't Know ~ 7% (-2)
There’s a much bigger shift here than we’ve seen elsewhere this year. There’s an equal loss of 2% for both Yes, which takes that below the 50% marker, and Don’t Knows, resulting in a corresponding increase of 4% for No.
Excluding Don't Knows
Yes ~ 52% (-4 / +7)
No ~ 48% (+4 / -7)
Obviously, that then results in a substantial narrowing of the pure Yes-No figures, to everyone’s favourite numbers. We’ve now seen a few polls in a row with a narrowing, so this may be the start of a trend. I’d be particularly interested to see if we get a YouGov soon, as they have tended to find the lowest Yes figures. If they flip back to finding leads for the Union, that’ll end a lengthy streak of polls putting Independence ahead. On the other hand if they don’t, that may suggest polling has indeed levelled out to a stable albeit narrow lead for Independence.
Council Area Projection
Please see this page for how projections work and important caveats.

On a simple Uniform Swing versus 2014, this might put a total of 17 Councils in the Yes column, an increase on the 4 in 2014. No would be on 15, down from 28 at the referendum.
Other Referendum Bits
There were a couple of other questions on Independence slotted into that poll. Given the debate around the constitution also takes in whether there should be a referendum, the poll also asked whether there should be one in the next five years (in other words, this term of parliament):
- Should – 50%
- Should not – 43%
- Don’t know – 7%
So of the folk who have a clear view on this, a clear majority would like to see such a poll in the next few years. This kind of information is particularly worth keeping an eye on for the next little while, as it may not prove entirely sustainable for the UK Government to simply keep refusing a vote if most Scots want one. Equally, if the tide turns against another vote in the near future, it becomes much harder for the Scottish Government to argue it should be able to hold one.
Even more interestingly, given it’s back in the headlines thanks to the ongoing Scottish Labour Leadership election, there were a couple of questions on the prospect of a multi-option referendum. Even before the current contest, the notion of a third option offering substantially more powers has been a common suggestion from Labour figures keen to stake out a unique position apart from the Yes-No binary. But are voters receptive to such an idea?
- Straight Yes/No question – 71%
- Three-way question – 20%
- Don’t Know – 9%
Overwhelmingly not. Although that’s not to say they won’t be won round to the idea over the longer term if it remains a point of discussion, it’s not the most promising starting point that a massive majority of voters would prefer to be given a clear and simple Union versus Independence referendum. However, maybe the option itself, specified rather wordily as “further significant devolution of all financial powers”, would prove more popular?
- Independence – 44%
- Status Quo – 34%
- Further Devolution – 17%
- Don’t Know – 5%
Once again, overwhelmingly not. More people want the option on the ballot than would vote for it, which suggests that this may not be the panacea Scottish Labour have been hoping for. Crucially, most of the support for this option comes from people already supportive of the Union.
Comparing these figures with the standard Yes/No part of the poll, of that 17%, only 5% comes from those who would otherwise support Independence. 10% comes from those who would say No in a two way vote, and 2% from folk who didn’t know. It’s hard to avoid drawing the conclusion that the moment for a potentially unifying majority around more devolution has long since passed, and the overwhelming majority of Scots have become polarised between Independence and the current Union status quo.
Hypotheticals
As ever, the last little bit of analysis concerns those hypothetical and more proportional voting systems that I have a bee in my bonnet about here at BBS. The fact Westminster uses pure FPTP is an affront to democracy, and though Holyrood fares far better, AMS is still deeply imperfect. The examples here simply transpose the poll findings onto more proportional voting systems – the reality is that different systems would of course result in different voter behaviour.
Changes here are vs AMS / vs same projection for the last poll.
SNP ~ 61 (-11 / nc)
Conservative ~ 27 (+3 / +1)
Labour ~ 22 (+3 / -1)
Green ~ 11 (+2 / nc)
Liberal Democrat ~ 8 (+3 / nc)

You’ll probably know the score for this one by now – a lot fewer SNP seats, with everyone else gaining. No majority of votes means no SNP majority, but a weightier Green group still gives a pro-Independence majority, albeit a smaller one than AMS would.

If you find this or other Ballot Box Scotland output useful and/or interesting, and you can afford to do so, please consider donating to support my work. I love doing this, but it’s a one-man project and takes a lot of time and effort. All donations, no matter how small, are greatly appreciated and extremely helpful.
(About Donations)


