

Keep tabs on all the latest polling, articles and information ahead of the 2021 Scottish Parliament election in the Ballot Box Scotland Holyrood Hub!
Polling day is fast approaching, and with it the promise of me getting at least a few weeks peace from covering polls! We’re not quite there yet, however, with a third April poll from Panelbase. That’s the 9th poll out this month, and we’ve still got a couple of days to match the 10 we had in March.
From what I can make out, this is going to be a multiple release poll, with Independence and probably Westminster figures to follow sometime later. We’re barely more than a week away from a major election so I don’t really have time for that sort of indulgence! I will come back and edit in the relevant bits when they are added to the tables, but Holyrood is the circus currently in town which needs speedy analysis.
Display format for this post:
- Party/Option – Vote% (Change vs last poll by agency 9th – 12th of April / vs last election or referendum)
Regional Vote
SNP ~ 36% (nc / -6)
Conservative ~ 21% (-1 / -2)
Labour ~ 18% (+1 / -1)
Green ~ 10% (+1 / +3)
Alba ~ 6% (nc / +6)
Liberal Democrat ~ 6% (nc / +1)
All for Unity ~ 2% (nc / +2)
A bunch of very small movements in this one, perhaps reflecting simple wobbling about the margin of error. The SNP remain on a relatively low figure albeit still comfortably ahead of the Conservatives, who are down very slightly, allowing Labour to marginally close the gap.
The Greens are also up a point, giving them their highest figure with Panelbase of this term. As I’ve noted a few times, Panelbase have historically been on the lower end of that party’s polling, but this brings them in line with quite a few other pollsters. Speaking of Panelbase trends, they continue to be the only agency keeping Salmond’s dream of a group of Alba MSPs alive, still finding twice as high a figure as anyone else has. Outliers can turn out to be correct, of course, but it is starkly at odds with all other evidence.
Constituency Vote
SNP ~ 45% (-2 / -2)
Labour ~ 22% (+2 / -1)
Conservative ~ 20% (-3 / -2)
Liberal Democrat ~ 8% (+2 / nc)
Green ~ 4% (nc / +3)
And on the topic of things starkly at odds with evidence, they’ve again found 4% for the Greens on the constituency ballot. That’s rather far-fetched given the Greens are contesting only one-sixth of the constituency seats. For the four parties contesting them all, we have two losses and two gains.
The SNP’s constituency number is the lowest they’ve been for this ballot since before the 2019 UK Election, and the loss of 3% puts the Conservatives firmly at the lower end of their recent polling. Labour and the Lib Dems are up a couple of % each, which is enough to put Labour in second on this vote – but there’s only so much good it does going up on this vote rather than the proportional side of things.
Seat Projection
Please see this page for how projections work and important caveats.
Projecting that into seats might give us something like this:
SNP ~ 60 (-3 / -3)
Conservative ~ 26 (nc / -5)
Labour ~ 21 (+2 / -3)
Green ~ 11 (+1 / +5)
Alba ~ 6 (nc / +6)
Liberal Democrat ~ 5 (nc / nc)
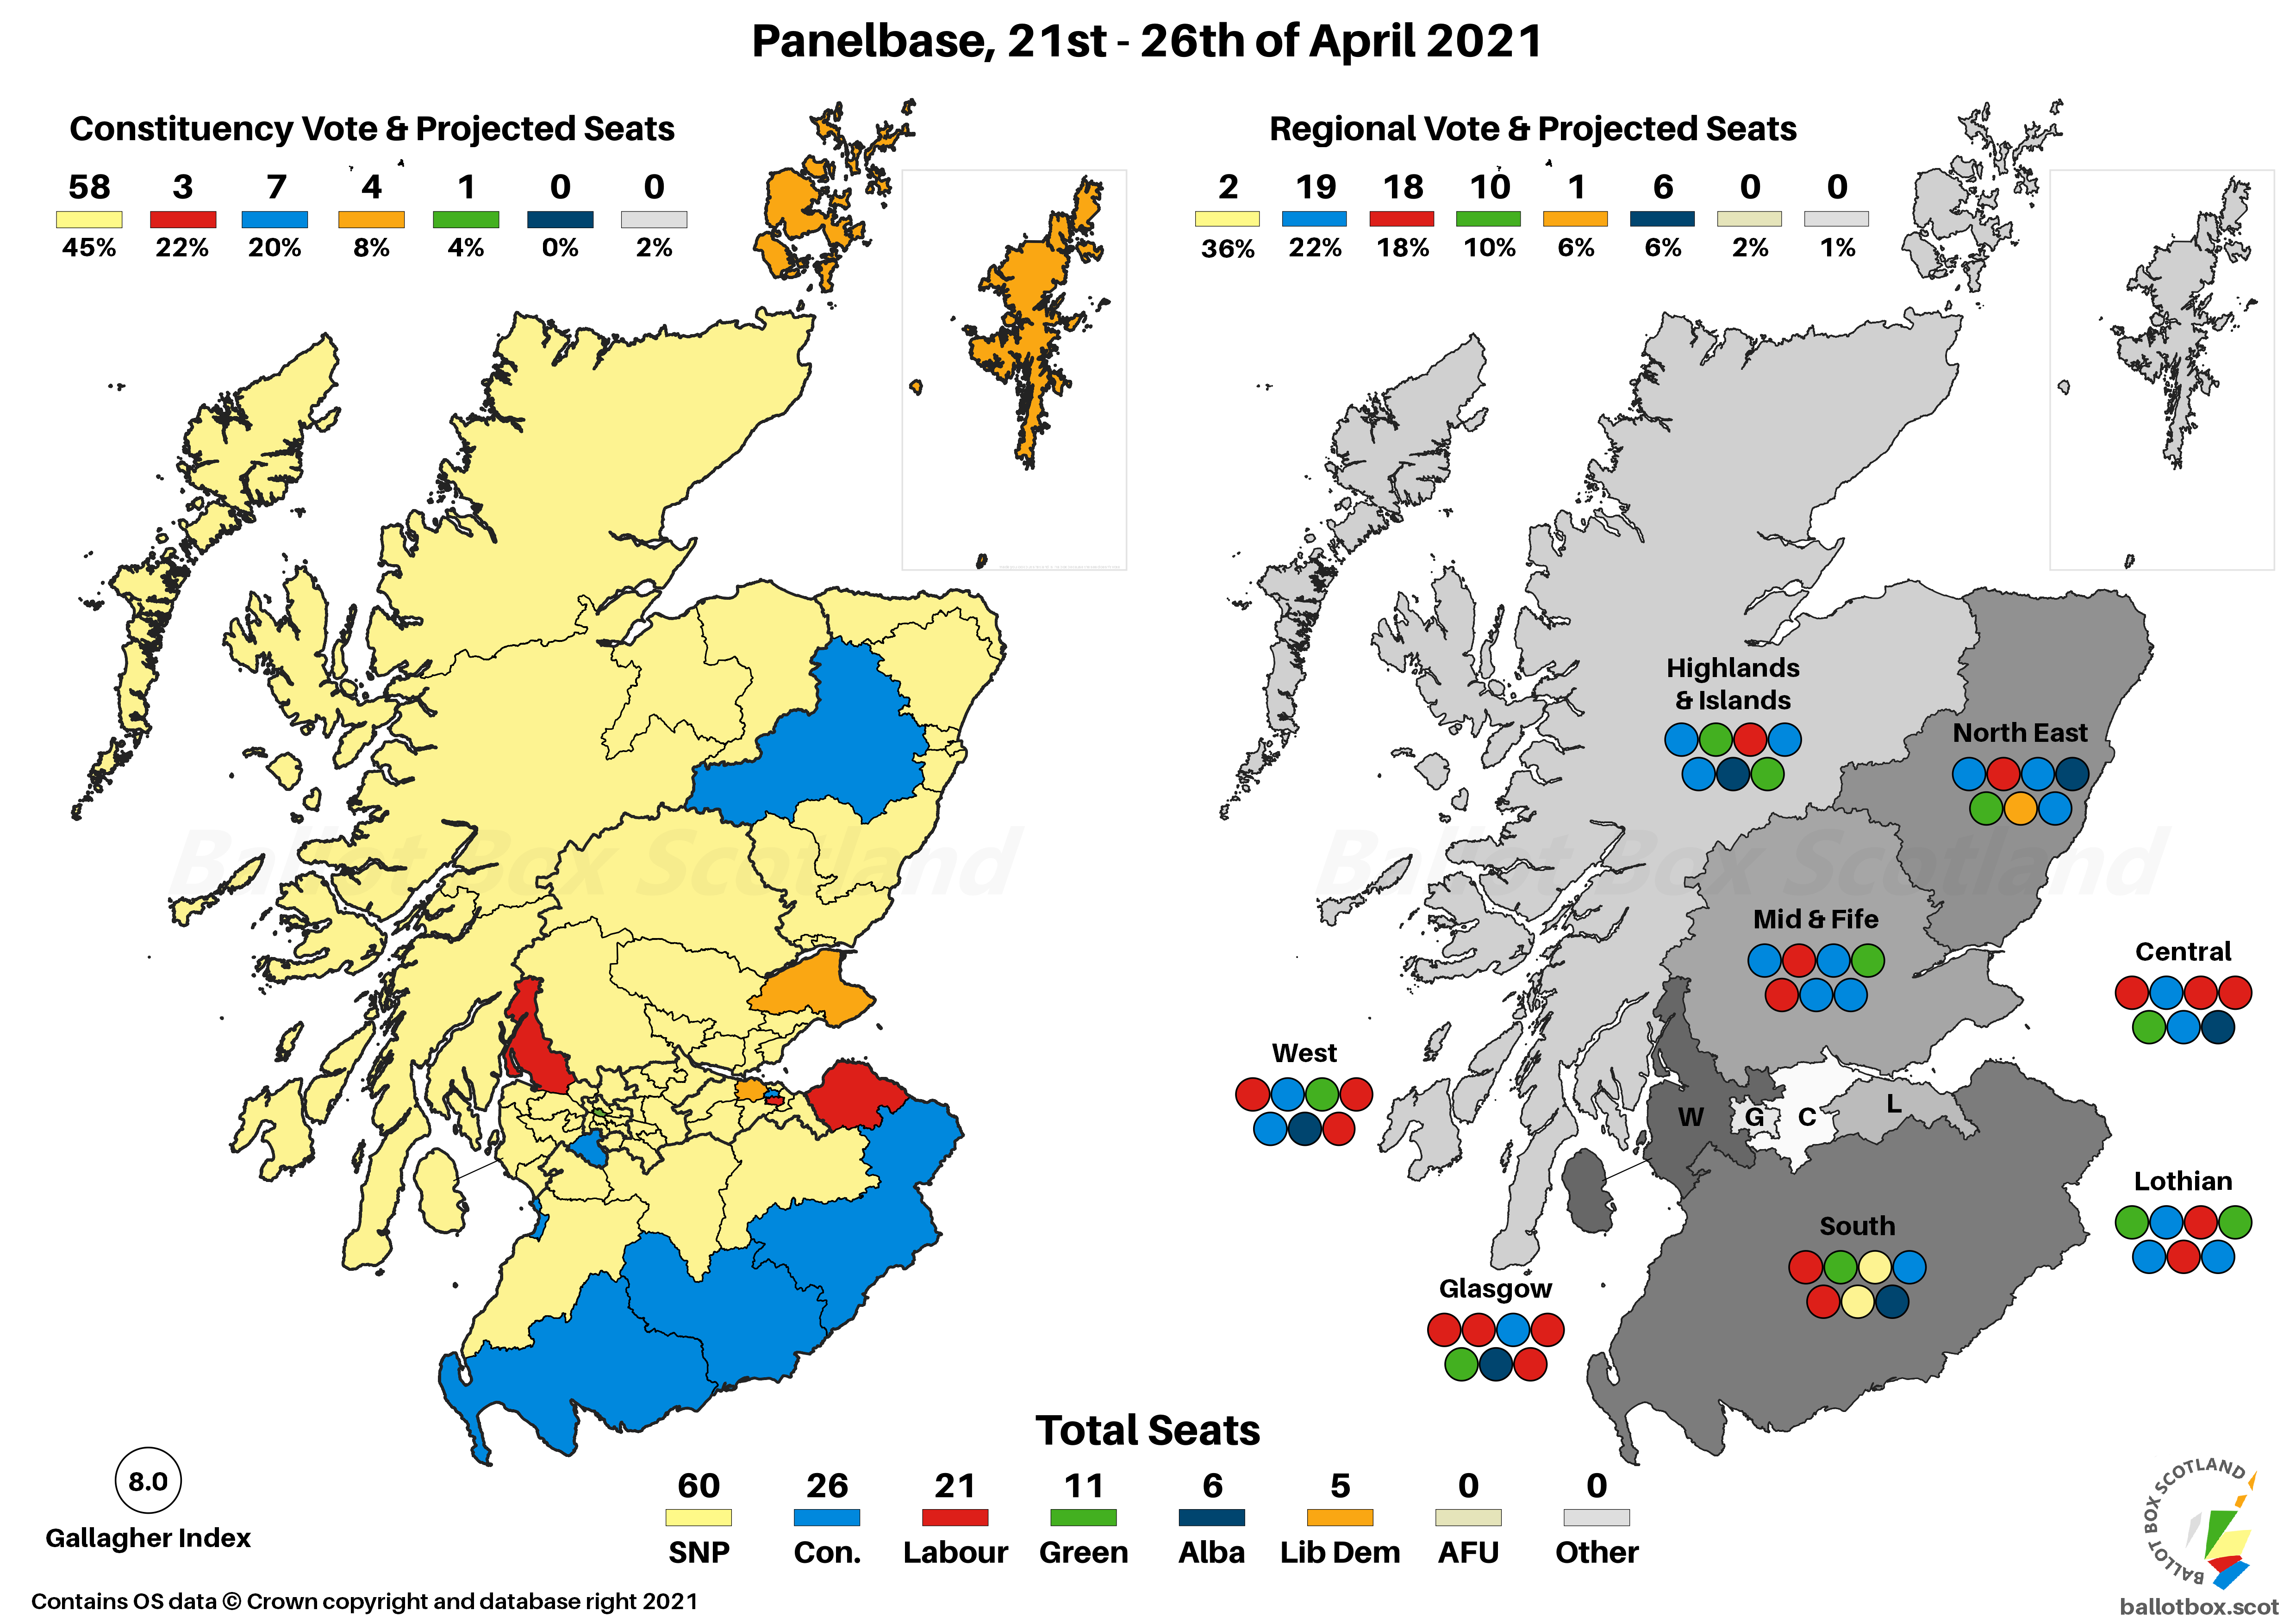

Given both of the SNP’s votes are below their 2016 levels, it’s no surprise this doesn’t merely project to another minority government, but to a loss of a handful of seats. There’s still a very comfortable pro-Independence majority with the Greens gaining more than the SNP lose, to say nothing of that outlying Alba half-dozen. Constituencies also mostly default to their 2016 outcomes given the relative spready of the vote.
Eagle-eyed readers may have spotted two little oddities in this one. The first is that the Greens are narrowly – oh so narrowly – projected to pick up Glasgow Kelvin. Projections always come with caveats, but there’s less to go on for projecting Green constituency results, so take that with a pinch of salt, though it’s still remarkable. There’s also one seat that the SNP come third in, which is Eastwood. I’d be even more doubtful of that in reality as I’d expect Labour to continue to shed votes there amidst a clear Conservative-SNP scrap, but that’s an artefact of simple modelling comparing directly to 2016.
No Westminster Q in this one.
Standard Question
No ~ 48% (+2)
Yes ~ 47% (-1)
Don't Know ~ 6% (nc)
At this point, regular readers should be able to reel off, word-for-word, what my analysis of this is. It’s on a knife-edge, totally margin of error, who knows which way Scotland would go in an actual referendum right now? Things have now tipped narrowly towards the Union on averages, but it remains extremely close.
Excluding Don't Knows
No ~ 51% (+2 / -4)
Yes ~ 49% (-2 / +4)
That means a narrow lead for No when we take out the Don’t Knows.
Council Area Projection
Please see this page for how projections work and important caveats.

On a simple Uniform Swing versus 2014, we might have 20 council areas leaning towards No, down from 28 in the referendum. Yes could be on 12, up 8 compared to 2014.
Hypotheticals
As ever, the last little bit of analysis concerns those hypothetical and more proportional voting systems that I have a bee in my bonnet about here at BBS. The fact Westminster uses pure FPTP is an affront to democracy, and though Holyrood fares far better, AMS is still deeply imperfect. The examples here simply transpose the poll findings onto more proportional voting systems – the reality is that different systems would of course result in different voter behaviour.
As the election approaches and polls are coming out more frequently, I’m jettisoning the actual map for this one for now. I still think it’s a fun and useful exercise, but it’s also time consuming to manually change 129 bubbles! (The AMS projection is only 56 bubbles, because the 73 constituencies are driven from a spreadsheet).
Changes here are vs AMS / vs same projection for the last poll.
SNP ~ 48 (-12 / nc)
Conservative ~ 28 (+2 / -2)
Labour ~ 24 (+3 / +1)
Green ~ 13 (+2 / +1)
Alba ~ 8 (+2 / nc)
Liberal Democrat ~ 8 (+3 / nc)
The usual story here of a much reduced SNP group whilst everyone else is better off. Unlike a couple of other recent polls, there’s a pro-Independence majority even under this hypothetical, though the SNP and Greens 61 seats would need the 8 from Alba to make up that majority.

If you find this or other Ballot Box Scotland output useful and/or interesting, and you can afford to do so, please consider donating to support my work. I love doing this, but it’s a one-man project and takes a lot of time and effort. All donations, no matter how small, are greatly appreciated and extremely helpful.
(About Donations)


