

Keep tabs on all the latest polling, articles and information ahead of the 2021 Scottish Parliament election in the Ballot Box Scotland Holyrood Hub!
With just two days to go until the election, the very last batches of polling are rapidly rolling out. I had been assuming that every poll that crops up at this late stage would be the last from that agency, but this Survation poll for Good Morning Britain could yet prove to be their second-last. The fieldwork for this one actually spans the 23rd to 26th of April, so before two of the other polls we’ve covered recently.
I had to admit to being rather miffed at getting a week old poll days before the election – apart from anything else, it required revisiting a number of points on the averages once again. I’d expect that’s to do with the commissioning organisation rather than Survation themselves, but a pain nonetheless. Fortunately we’ve got a more recently concluded Opinium that I’m also covering tonight, plus a YouGov that’ll be written up tomorrow.
Display format for this post:
- Party/Option – Vote% (Change vs last poll by agency 20th – 22nd of April / vs last election or referendum)
Regional Vote
SNP ~ 37% (+2 / -5)
Conservative ~ 22% (+2 / -1)
Labour ~ 18% (-4 / -1)
Green ~ 11% (+1 / +4)
Liberal Democrat ~ 7% (nc / +2)
Alba ~ 2% (-1 / +3)
Can anyone say “herding”? The key thing to focus on here is that steep Labour slide. Survation have consistently been the only pollster to find Labour in second place, including in the poll taken just days before this one. Suddenly, there are no pollsters that think Sarwar will lead the largest opposition party anymore. It’s very hard to view this as anything other than a last minute panic-alignment with what everyone else was saying.
“The Battle for Second Place” was always a narrative not entirely borne out by polling overall, but this is a final nail in the polling coffin for it. The largest increases as a result are the SNP and Conservatives, both up a couple of percent, whilst Alba dip slightly to the lower end of their polling, and the Greens go up by a point.
Note that for whatever reason, the Green figure was reported in the initial release of data as 10%, but is definitely 11% in the tables. That added another small shoogle to my averages once I’d already fixed them once, so this is my least favourite poll of the week for sure in terms of time and effort required. In any case, this is at the upper end of their recent polling, as is typical for Survation, who also continue to find relatively strong Lib Dem numbers.
Constituency Vote
SNP ~ 47% (-3 / nc)
Conservative ~ 21% (nc / -1)
Labour ~ 21% (nc / -2)
Liberal Democrat ~ 8% (+1 / nc)
Over on the constituency vote things look somewhat different, with a notably worse figure for the SNP versus the previous poll, static findings for the Conservatives and Labour, and a slight Lib Dem gain.
Seat Projection
Please see this page for how projections work and important caveats.
Projecting that into seats might give us something like this:
SNP ~ 62 (-5 / -1)
Conservative ~ 27 (+6 / -4)
Labour ~ 22 (-3 / -2)
Green ~ 11 (+1 / +5)
Liberal Democrat ~ 7 (+1 / +2)
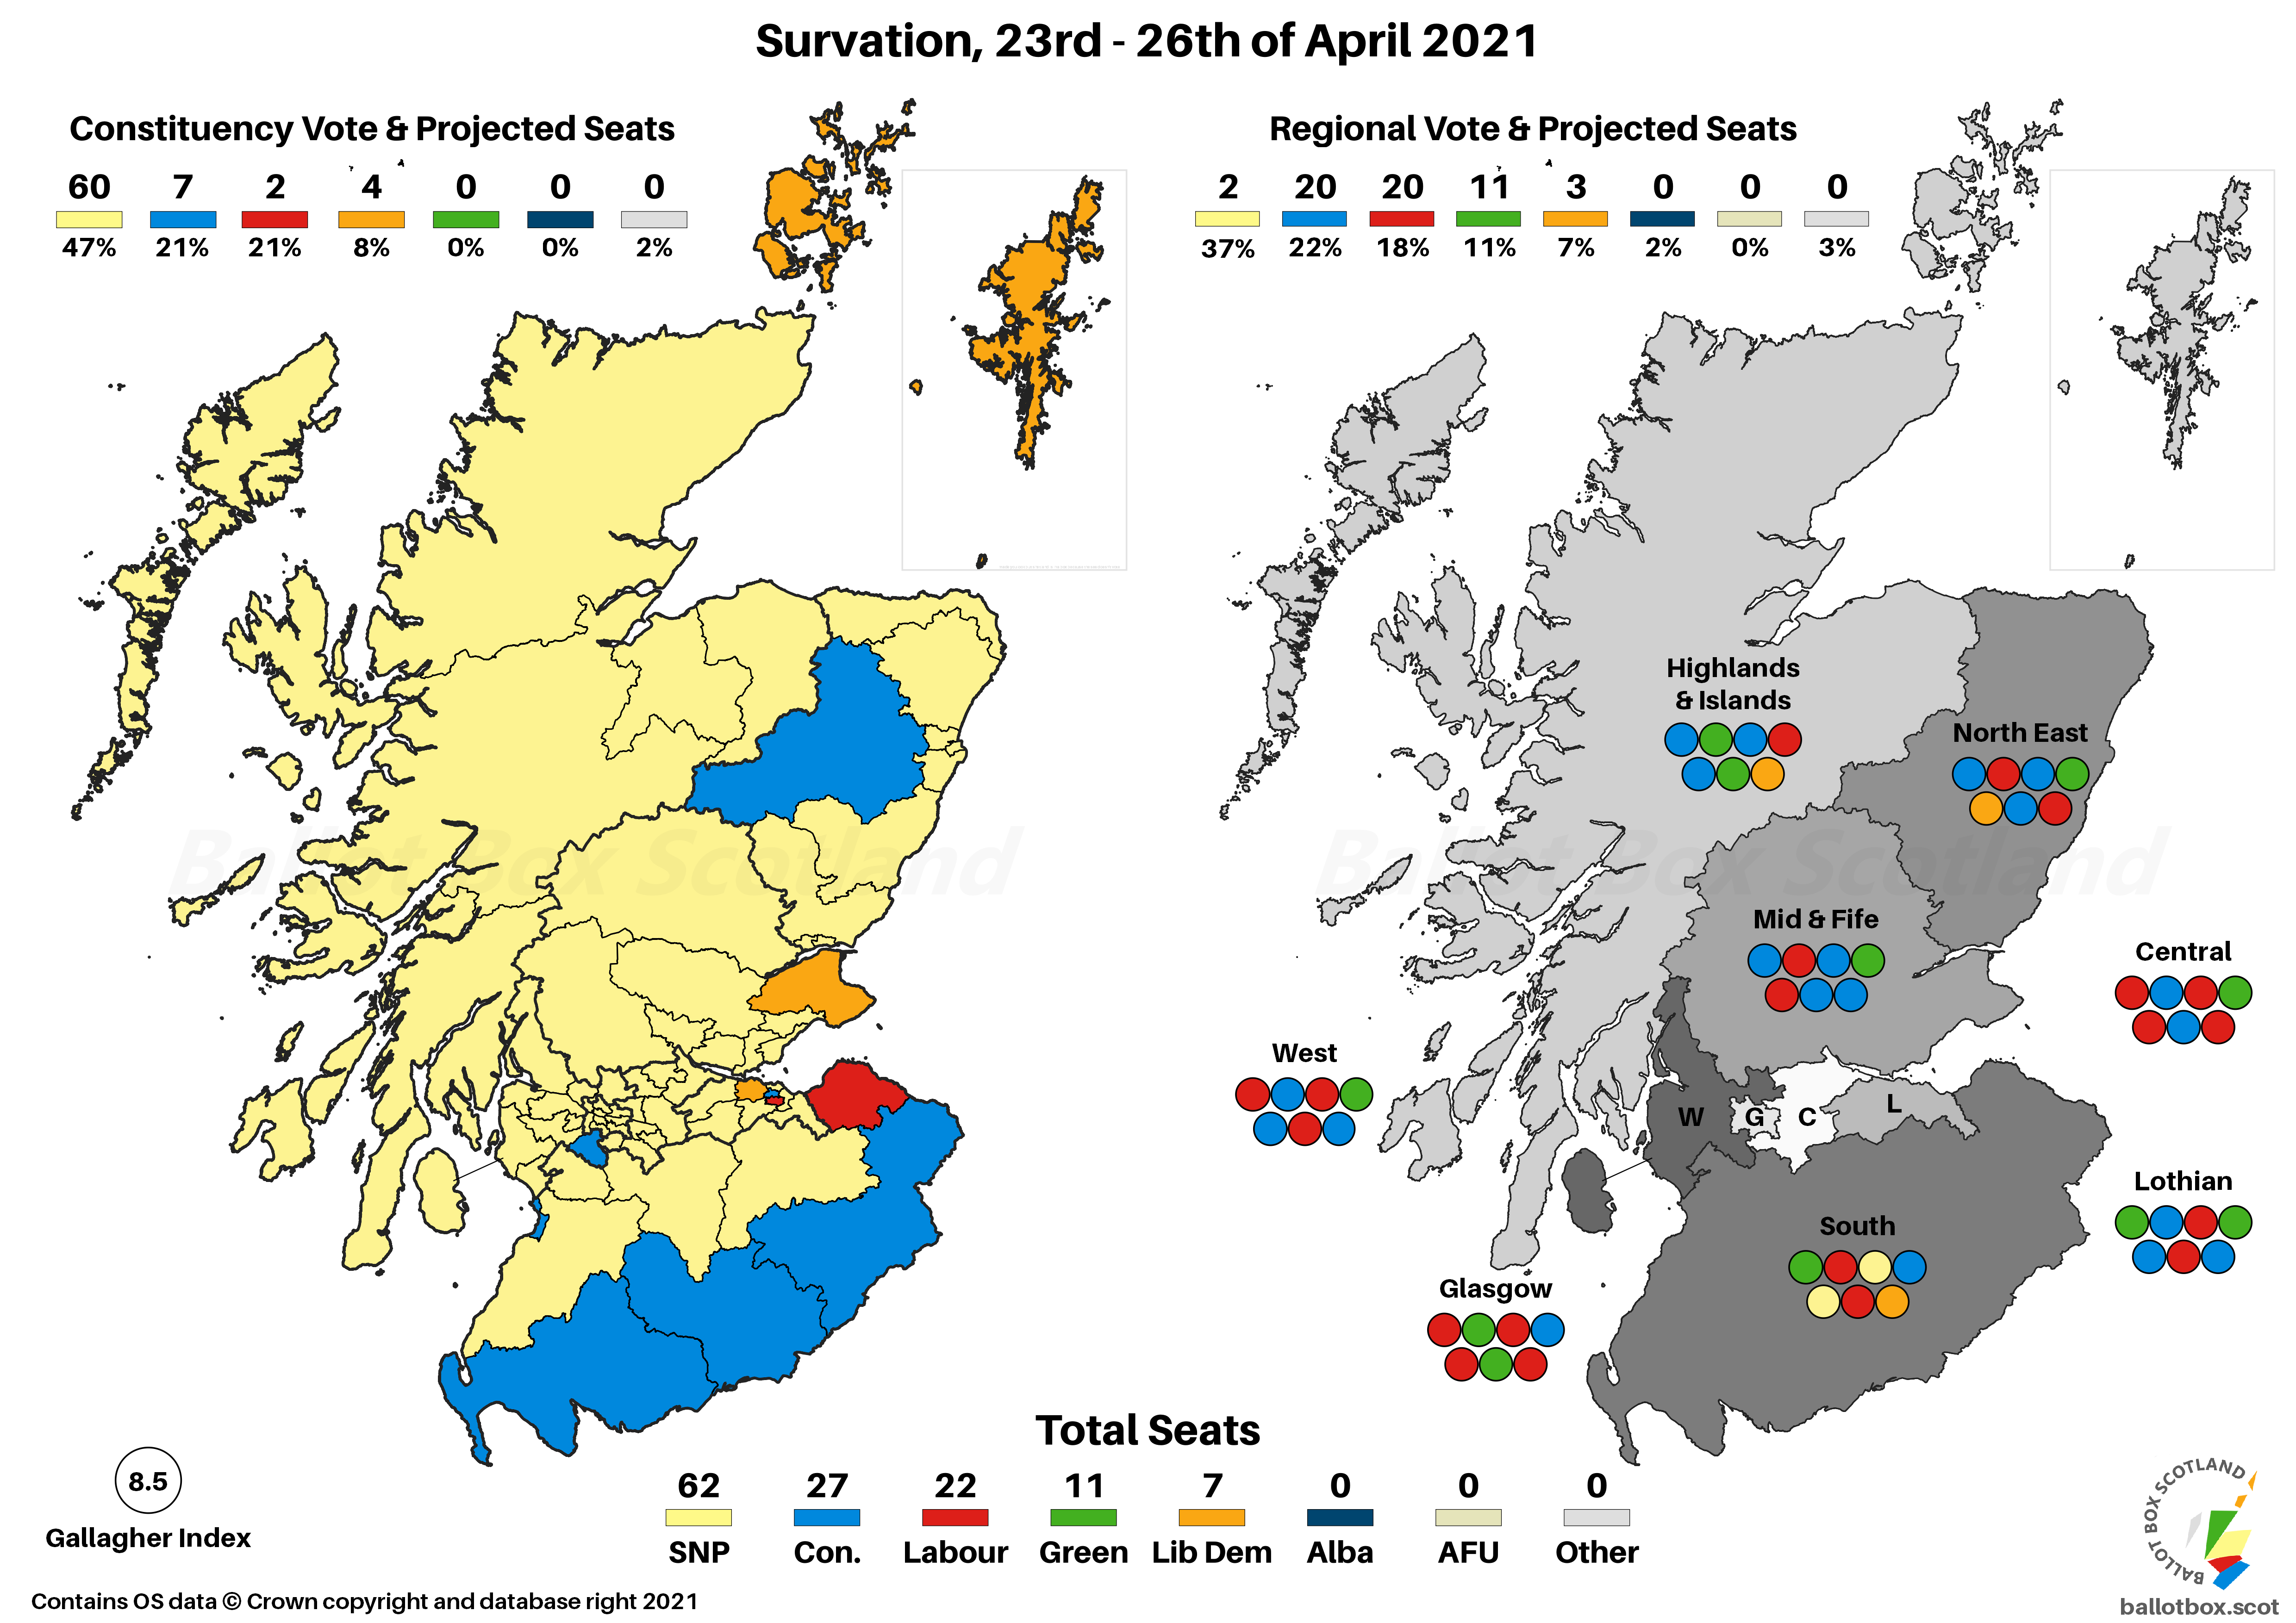
With the SNP having dropped to roughly their 2016 level of constituency support, it’s not much of a surprise that this projects to almost unchanged constituencies, and the party falling short of a majority. As has been the case throughout the campaign however, there’d still be a clear pro-Independence majority of MSPs when including the Greens. Apart from the Greens the only other party an unarguably positive outcome in this scenario would be the Lib Dems.
SNP ~ 47% (-1 / +2)
Conservative ~ 22% (+1 / -3)
Labour ~ 22% (nc / +3)
Liberal Democrat ~ 8% (nc / -2)
Very little to talk about on this one compared to the previous poll – just a very tiny shuffling of a point down for the SNP and up for the Conservatives, with the latter tied with Labour.
Standard Question
No ~ 47% (+2)
Yes ~ 42% (-2)
Don't Know ~ 11% (nc)
Although polling on the whole remains pretty knife-edge, there has been a steady trend back towards the Union over the past little while. This poll gives one of the wider examples of that, with a pretty clear 5% between the two options.
Excluding Don't Knows
No ~ 53% (+2 / -2)
Yes ~ 47% (-2 / +2)
Once we exclude the Don’t Knows we’re quite close to the 2014 status quo in this poll. Although we’re seeing a few ties and the odd lead for Yes in other polls, it’s very clear that last year’s remarkable period of Independence-supportive polling hasn’t carried through the Holyrood campaign.
Council Area Projection
Please see this page for how projections work and important caveats.

On a simple Uniform Swing versus 2014, No would seem to be the likely leader in 26 council areas, only slightly down from 28 last time. Yes would potentially tip 6 councils their way, gaining on the 4 at the referendum.
Other Independence Questions
There either haven’t been or I haven’t had time to get through any appropriate “other interesting constitutional tit bits” in recent polls, but there is one here, on what should the UK Government should do if pro-Independence parties achieve a majority:
- Allow a referendum ~ 49%
- Not allow a referendum ~ 42%
- Don’t Know ~ 9%
This is roughly opposite to what the actual support for Independence was – so although this poll suggests people wouldn’t vote for Independence, there is a clear lead for people who think the UK Government should allow a referendum in the case of a Holyrood majority in favour.
Hypotheticals
As ever, the last little bit of analysis concerns those hypothetical and more proportional voting systems that I have a bee in my bonnet about here at BBS. The fact Westminster uses pure FPTP is an affront to democracy, and though Holyrood fares far better, AMS is still deeply imperfect. The examples here simply transpose the poll findings onto more proportional voting systems – the reality is that different systems would of course result in different voter behaviour.
As the election approaches and polls are coming out more frequently, I’m jettisoning the actual map for this one for now. I still think it’s a fun and useful exercise, but it’s also time consuming to manually change 129 bubbles! (The AMS projection is only 56 bubbles, because the 73 constituencies are driven from a spreadsheet).
Changes here are vs AMS / vs same projection for the last poll.
SNP ~ 50 (-12 / +4)
Conservative ~ 30 (+3 / +3)
Labour ~ 24 (+2 / -5)
Green ~ 15 (+4 / +2)
Liberal Democrat ~ 10 (+3 / nc)
Alba ~ 0 (nc / -4)
Though this shows the usual substantially lower seat count for the SNP versus AMS, it’s less stark than in polls projecting to an AMS majority. Although Alba wouldn’t enter parliament in this hypothetical, there’d be the barest majority for the SNP and Greens combined, at 65 seats versus 64 for the three major pro-Union parties.

Scandinavian Style Westminster
Changes here are only versus the same projection on the last poll, given my aversion to doing projections on pure FPTP.
SNP - 28 (nc)
Conservative - 13 (nc)
Labour - 13 (nc)
Liberal Democrat - 5 (nc)
We all know roughly what happens with this one, I’m sure – what would be an almost clean-sweep for the SNP under FPTP could instead be a much more balanced and accurate reflection of voter opinion. Boringly enough, these are the exact same seat shares as the last Survation.
If you find this or other Ballot Box Scotland output useful and/or interesting, and you can afford to do so, please consider donating to support my work. I love doing this, but it’s a one-man project and takes a lot of time and effort. All donations, no matter how small, are greatly appreciated and extremely helpful.
(About Donations)


