

Keep tabs on all the latest polling, articles and information ahead of the 2021 Scottish Parliament election in the Ballot Box Scotland Holyrood Hub!
As we prepare to wind up for 2020, we aren’t quite finished with the year’s polling. Survation have popped up with the early Christmas present of a fresh new poll. Coming just a month after their last one, this is another indication that things are beginning to ramp up ahead of next year’s Scottish Parliament election.
Display format for this post:
- Party/Option – Vote% (Change vs last poll by agency / vs last election or referendum)
Regional Vote
SNP - 41% (-2 / -1)
Labour - 20% (+1 / +1)
Conservative - 18% (+1 / -5)
Green - 10% (nc / +3)
Liberal Democrat - 7% (nc / +2)
Brexit - 1% (-1 / +1)
UKIP - 1% (nc / -1)
Though there are a few changes here and there, this is pretty par for the course in Survation terms, though that means it is somewhat out of kilter with most of the other agencies. That SNP dip gives them a rare poll with a figure below their 2016 result, and the Conservatives are up very slightly on what was their lowest share since the last election in the previous poll.
Labour placing second isn’t unheard of for Survation, but that 20% figure is the highest they’ve polled in two whole years. Balancing out Survation’s typically low SNP and Conservative figures are relatively higher Green and Lib Dem shares, though both are unchanged versus last month.
Constituency Vote
SNP - 53% (-1 / +6)
Labour - 20% (+2 / -3)
Conservative - 20% (+1 / -2)
Liberal Democrat - 6% (-1 / -2)
For the constituency vote, Survation tend not to be so distinct from the other pollsters, with a much larger SNP lead. As in the other vote, Labour are on their best figure in quite a while here, though it was a slightly more recent April 2019 when they were last in the 20’s for this one.
Seat Projection
Please see this page for how projections work and important caveats.
SNP - 71 (+1 / +8)
Labour - 23 (-1 / -1)
Conservative - 20 (+1 / -11)
Green - 10 (nc / +4)
Liberal Democrat - 5 (-1 / nc)

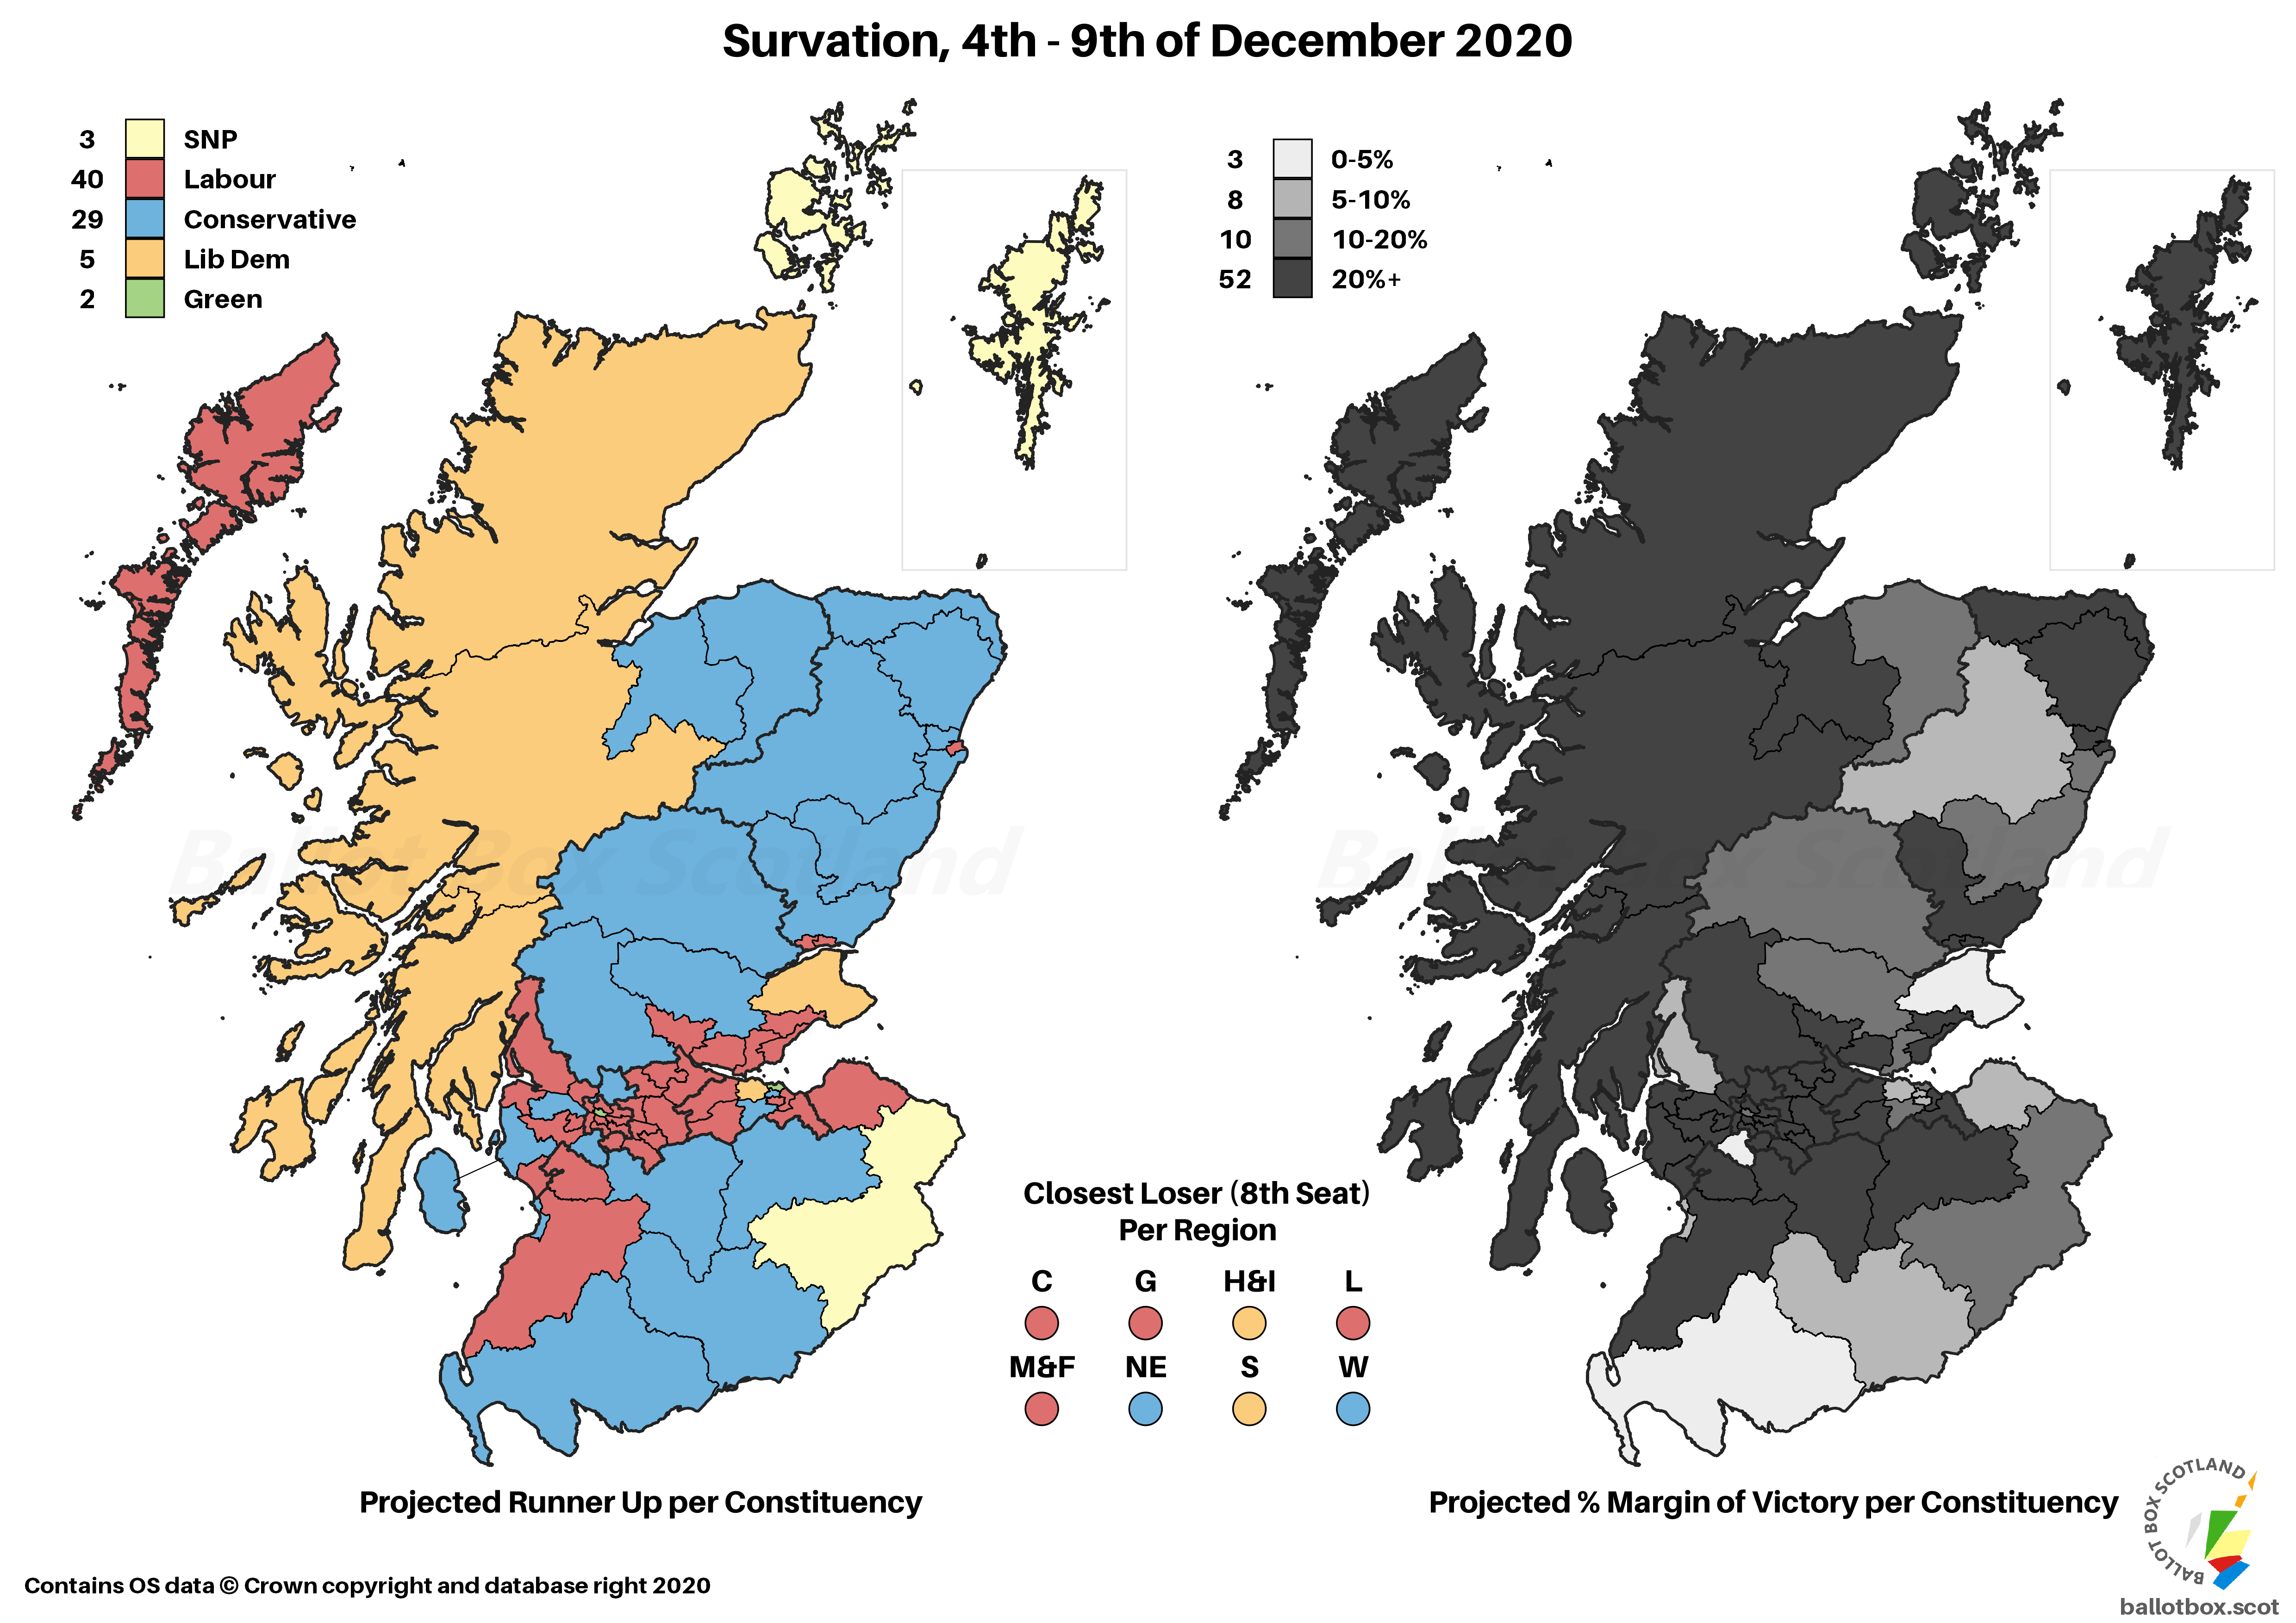
Since there are only quite small changes in vote shares in this poll versus the last, the shift in seats compared to then is also quite minor. As per current trend, it does show a substantial SNP majority – though, since Survation are against trend in their Labour findings, it’s a rare case of a Labour second.
You’ll be used to me saying so by now, but with a whopping 12% between the SNP’s support on each ballot, the overhang here is quite something. Though the map shows it, I don’t keep a specific record of the Gallagher Index (a measure of proportionality – lower numbers are more proportional) across all polls. The 10.8 here must be one of the highest, however, and is more akin to a Westminster election in terms of its proportionality than what we should be getting from Holyrood.
SNP - 51% (-1 / +6)
Labour - 21% (+1 / +2)
Conservative- 20% (+2 / -5)
Liberal Democrat- 6% (-2 / -4)
Again, it’s very small movements here which there isn’t a lot to say about – though it’s notable that even with a 2% loss versus the last poll, this is still higher than anyone else except Survation have found for the Lib Dems for the past few months.
Standard Question
Yes - 45% (-2)
No - 42% (+2)
Don't Know - 14% (+1)
Slight movement back towards the Union from Independence in this poll, as well as a slight uptick for those unsure about which way to go, though still with a Yes lead.
Excluding Don't Knows
Yes - 52% (-2 / +7)
No - 48% (+2 / -7)
Naturally that narrowed margin carries through when we exclude those Don’t Knows, giving us the now classic 52-48 split. That’s narrower than many other recent polls, though it’s a margin of error situation, so we’ll need to wait for a few more polls to see if there is similar movement.
Council Area Projection
Please see this page for how projections work and important caveats.

On a simple Uniform Swing versus 2014, this might put a total of 15 Councils in the Yes column, an increase on the 4 in 2014. That’d leave 15 for No, down from 28 at the referendum.
Hypotheticals
As ever, the last little bit of analysis concerns those hypothetical and more proportional voting systems that I have a bee in my bonnet about here at BBS. The fact Westminster uses pure FPTP is an affront to democracy, and though Holyrood fares far better, AMS is still deeply imperfect. The examples here simply transpose the poll findings onto more proportional voting systems – the reality is that different systems would of course result in different voter behaviour.
Changes here are vs AMS / vs same projection for the last poll.
SNP - 55 (-16 / -2)
Labour - 27 (+4 / +2)
Conservative - 24 (+4 / +1)
Green - 13 (+3 / -1)
Liberal Democrat - 10 (+5 / nc)

The SNP always lose a fair few seats in the translation to a purely proportional system, but it’s a particularly large chunk given how off the AMS results were in this one. They’d be substantially short of a majority, though the Greens would still keep the balance of the chamber in favour of the Pro-Independence parties.

Scandinavian Style Westminster
Changes here are only versus the same projection on the last poll, given my aversion to doing projections on pure FPTP.
SNP - 30 (-1)
Labour - 13 (+1)
Conservative - 12 (+1)
Liberal Democrat - 4 (-1)

Since the SNP do have a majority of the vote for this part of the poll they would win a majority of seats, with an almost even split between Labour and Conservatives taking up most of the rest. As ever, the big caveat for this one is that people vote very differently under PR.
If you find this or other Ballot Box Scotland output useful and/or interesting, and you can afford to do so, please consider donating to support my work. I love doing this, but it’s a one-man project and takes a lot of time and effort. All donations, no matter how small, are greatly appreciated and extremely helpful.
(About Donations)


