

Well, what a rarity – the same pollster being commissioned twice in the space of month, in a non-election year! It’s not often we get that in Scotland, but it’s what happened with this poll from Survation (link to tables). Just like their previous poll, this wasn’t commissioned through the usual source of a newspaper or broadcaster, but instead by lobbying firm True North (link to their writeup).
The previous Survation covered the 22nd of December 2022 to 1st of January 2023. Changes are shown as (vs that poll / vs last election). However, Survation have not asked a standard Yes/No Independence question since the BBS-commissioned poll last March, so on that front, changes versus 24th to 28th of March 2022.
Regional Vote
Look, let’s be blunt – there’s not a lot going to have changed over the course of a couple of weeks (remember, this predates recent… events), and most of what does look like change is more likely than ever to just be wobbling around margin of error. With that in mind, quickfire thought for each party. SNP: weak but unchanged. Labour: Solid but down a bit. Conservatives: Actually a big gain, a blow versus 2021, but better share than most recent polls. Green: Strong and unchanged. Lib Dem: Good but down a bit.
Constituency Vote
Very similar vibes on the constituency vote, though the SNP are the party up at Labour’s expense, with the Conservatives up a smaller fraction.
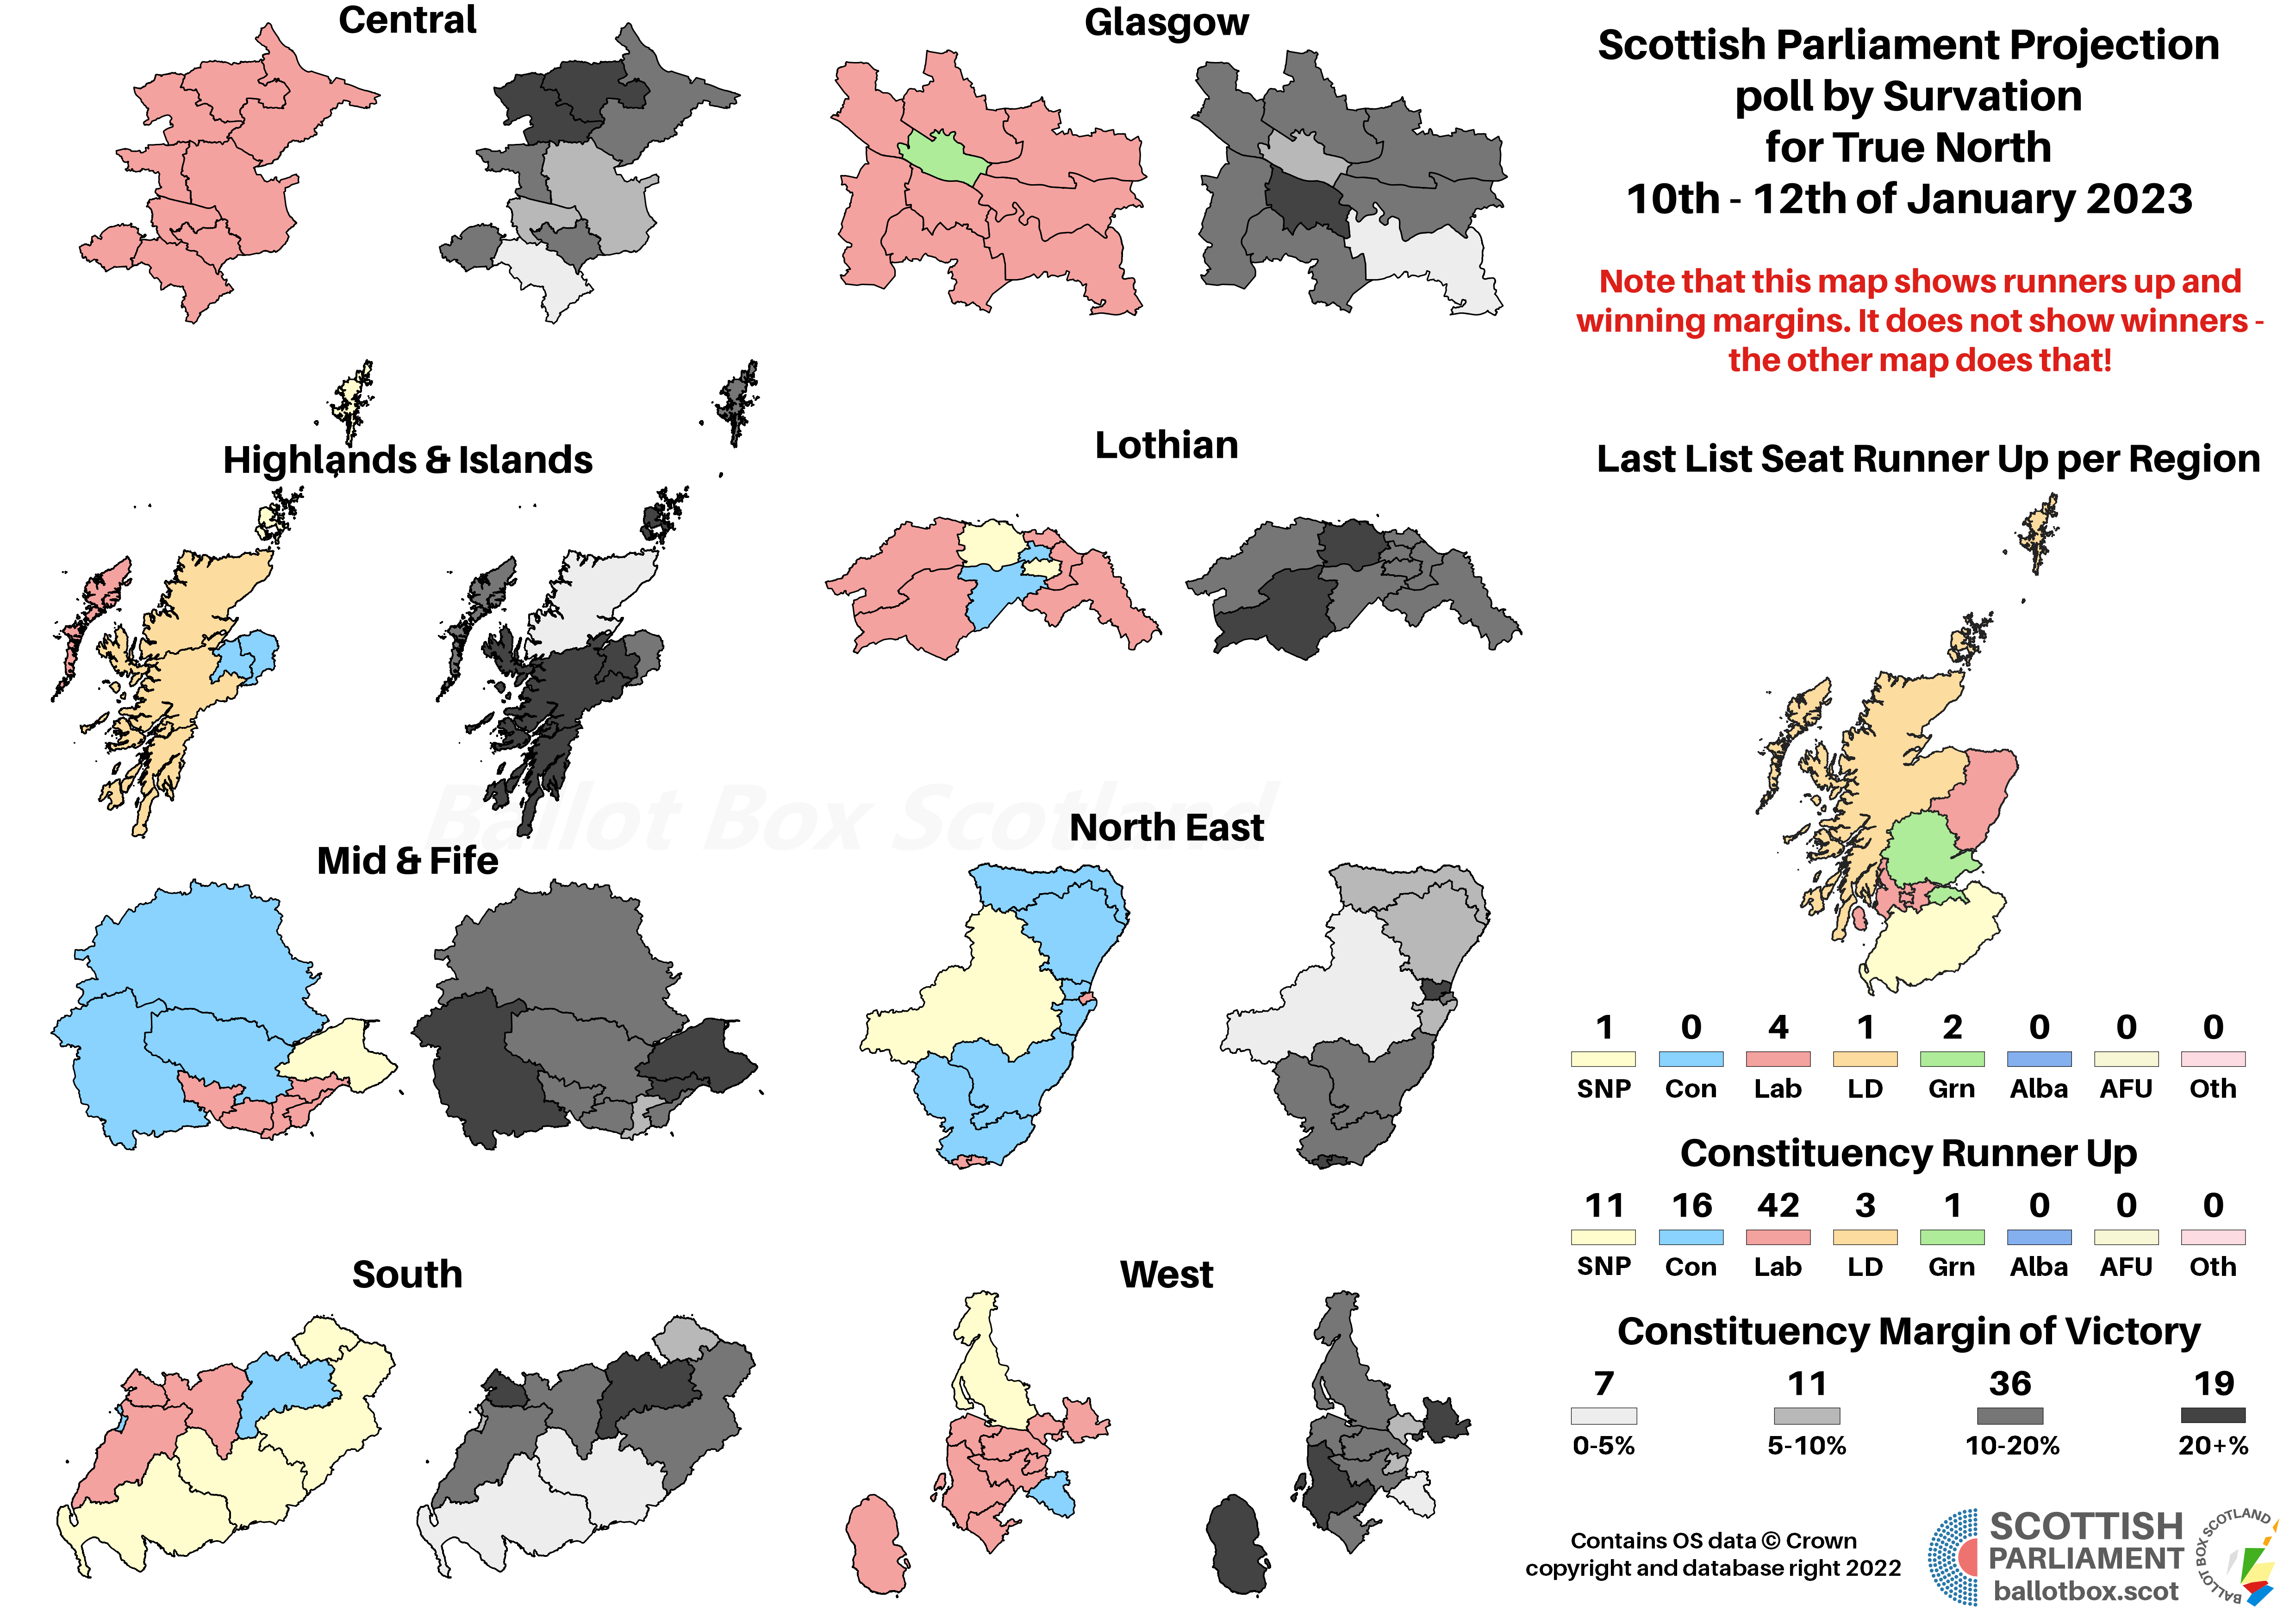
Seat Projection
Projecting that into seats might give us something like this:
Please see this page for how projections work and important caveats.

That few percent for the Conservatives makes a huge difference, giving them a half-dozen seats more than the last poll. With the SNP insulated by their constituency dominance, those have to come at everyone else’s expense – even the Greens, who didn’t lose any support, drop a seat. As ever though, that same SNP constituency dominance delivers an easy re-election for the SNP-Green co-operative government.
And just rounding out a three-for-three of slightly different shifts for the SNP, here they are down just a touch, whilst 2% seemingly trades between Labour and Conservatives, and the Lib Dems gain a point. This is a weak share for the SNP in general terms, but with Labour also slipping, they remain far enough ahead it’s unlikely too many seats would change hands.
Obviously, this has the SNP pretty far off the vote majority for the “de facto” referendum. This poll did have figures for a specific “if a general election was being treated as a de facto referendum” question, but as I understand it there was a slight difference in how this was presented, so I’ve opted not to include it as a separate chart. As has been the case for all such slight variations thus far, they don’t show anything really that different to the standard question anyway.
In true Scottish polling style, this bit of the poll is very, very funny. Not the figures themselves, not anything wrong with them, but because another poll was published hours later. But, this one first: this is the biggest lead for the Union since May last year. Taken in isolation, it’s the second poll in a row suggesting the spike in Independence support after the Supreme Court decision last year was temporary, as I suspected.
However, and I don’t know if it has other figures attached (the National stated their intent to publish a new bit of the poll every day for a week, so it might), there was another poll by FindOutNow published later the same day in which the Excluding Don’t Knows figures are reversed. There’s just something so fundamentally, chaotically, hilariously… Scottish about two completely opposing polls coming out at the same time, leading to each side claiming the poll favourable to their side is the credible poll and the other is rubbish.
I don’t know what’s going on, there’s nothing you can really say when this happens except “lol, lmao”. I guess it just leads us back to where we had been for a while previously which is “it’s too close to call.”
Hypotheticals
As ever, the last little bit of analysis concerns those hypothetical and more proportional voting systems that I have a bee in my bonnet about here at BBS. The fact Westminster uses pure FPTP is an affront to democracy, and though Holyrood fares far better, AMS is still deeply imperfect. The examples here simply transpose the poll findings onto more proportional voting systems – the reality is that different systems would of course result in different voter behaviour.
For the moment, although the maps are useful for illustrative purposes, I’m opting just to show these hypotheticals as charts. It’s very time consuming making maps, and for these pure hypotheticals, it’s possibly a bit overkill.
Again, very little change since last poll, so it feels pointless writing too much. In short: you can make AMS better but it’s still AMS, it still has FPTP, so this naturally still gives an SNP-Green majority…
… and this, removing FPTP entirely, does not. It instead gives a 69:60 majority for the pro-Union parties.
Scandinavian Style Westminster
Again, a majority here for the Pro-Union parties if there was a properly proportional system, instead of what would be an overwhelming SNP majority of seats under FPTP.
If you find this or other Ballot Box Scotland output useful and/or interesting, and you can afford to do so, please consider donating to support my work. I love doing this, but it’s a one-man project and takes a lot of time and effort. All donations, no matter how small, are greatly appreciated and extremely helpful.
(About Donations)


