

Keep tabs on all the latest polling, articles and information ahead of the 2021 Scottish Parliament election in the Ballot Box Scotland Holyrood Hub!
After a nice period there of having a comfortably period between polls, today had two drop at once. Although that makes for a knackering amount of work for me to do all at once, these are from the two pollsters it’s been longest since we last heard from. As I’m always calling for more diversity in who polls are coming from, I can’t complain too much! We’ll start with the YouGov which was conducted from the 6th to the 10th of November. I’ll write up the Panelbase for publication tomorrow, or when tables are available.
Display format for this post:
- Party/Option – Vote% (Change vs last poll by agency 6th – 10th of August / vs last election or referendum)
Regional Vote
SNP - 47% (nc / +5)
Conservative - 20% (-1 / -3)
Labour - 13% (-1 / -1)
Green - 7% (+1 / nc)
Liberal Democrat - 6% (nc / +1)
SSP - 3% (-1 / +3)
Brexit - 1% (nc / +1)
Relatively few changes here compared to the last poll – note of course that the fact there is a total of -3 but only +1 will be down to rounding.
The SNP continue their current trend of being unchallenged for first place, whilst unlike last week’s Survation the Conservatives aren’t being challenged for second. Labour’s 13% here is on the lower end of their polling, with YouGov clearly settling into the pattern of finding the lowest Labour scores. This is also true of the Greens and Lib Dems, though the Greens have bounced back from a joint lowest figure in the previous poll.
As ever, note that SSP figure is overwhelmingly likely to be an artefact of YouGov’s methodology rather than an indication that party are about to return from beyond the grave. Basically, this high SSP figure and low Labour are YouGov’s only notable departures from the Panelbase that also appeared today.
Constituency Vote
SNP - 56% (-1 / +9)
Conservative - 19% (-3 / -1)
Labour - 15% (+1 / -8)
Liberal Democrat - 6% (nc / -2)
Green - 2% (+1 / +1)
Much the same pattern over on the Constituency ballot, with the SNP at the higher end of their polling and Labour at the lower. Whereas their regional figure was low but not remarkably so, on this vote the Conservatives have their a joint lowest result since 2016.
Comparing with the overlapping Panelbase and it’s again a case of Labour being much lower here, with the SNP a fair bit higher.
Seat Projection
Please see this page for how projections work and important caveats.
SNP - 74 (nc / +11)
Conservative - 24 (-5 / -7)
Labour - 17 (nc / -7)
Green - 9 (+6 / +3)
Liberal Democrat - 5 (nc / nc)
SSP - 0 (-1 / nc)

It’s not a huge difference in votes versus the last poll, so for the SNP, Labour and Lib Dems there’s also no difference in seats, with the SNP still on a commanding majority in their own right. However, there is a big shift in seats between the Conservatives and Greens.
It really speaks to how AMS isn’t particularly proportional that a 1% difference in the Green vote share has them landing on either 3 or 9 seats. Similarly, the fact the Lib Dems are just 1% behind but 4 seats short is also not democratically ideal. Finally, we can see that the SSP also don’t get their rare phantom seat at this level of support either.
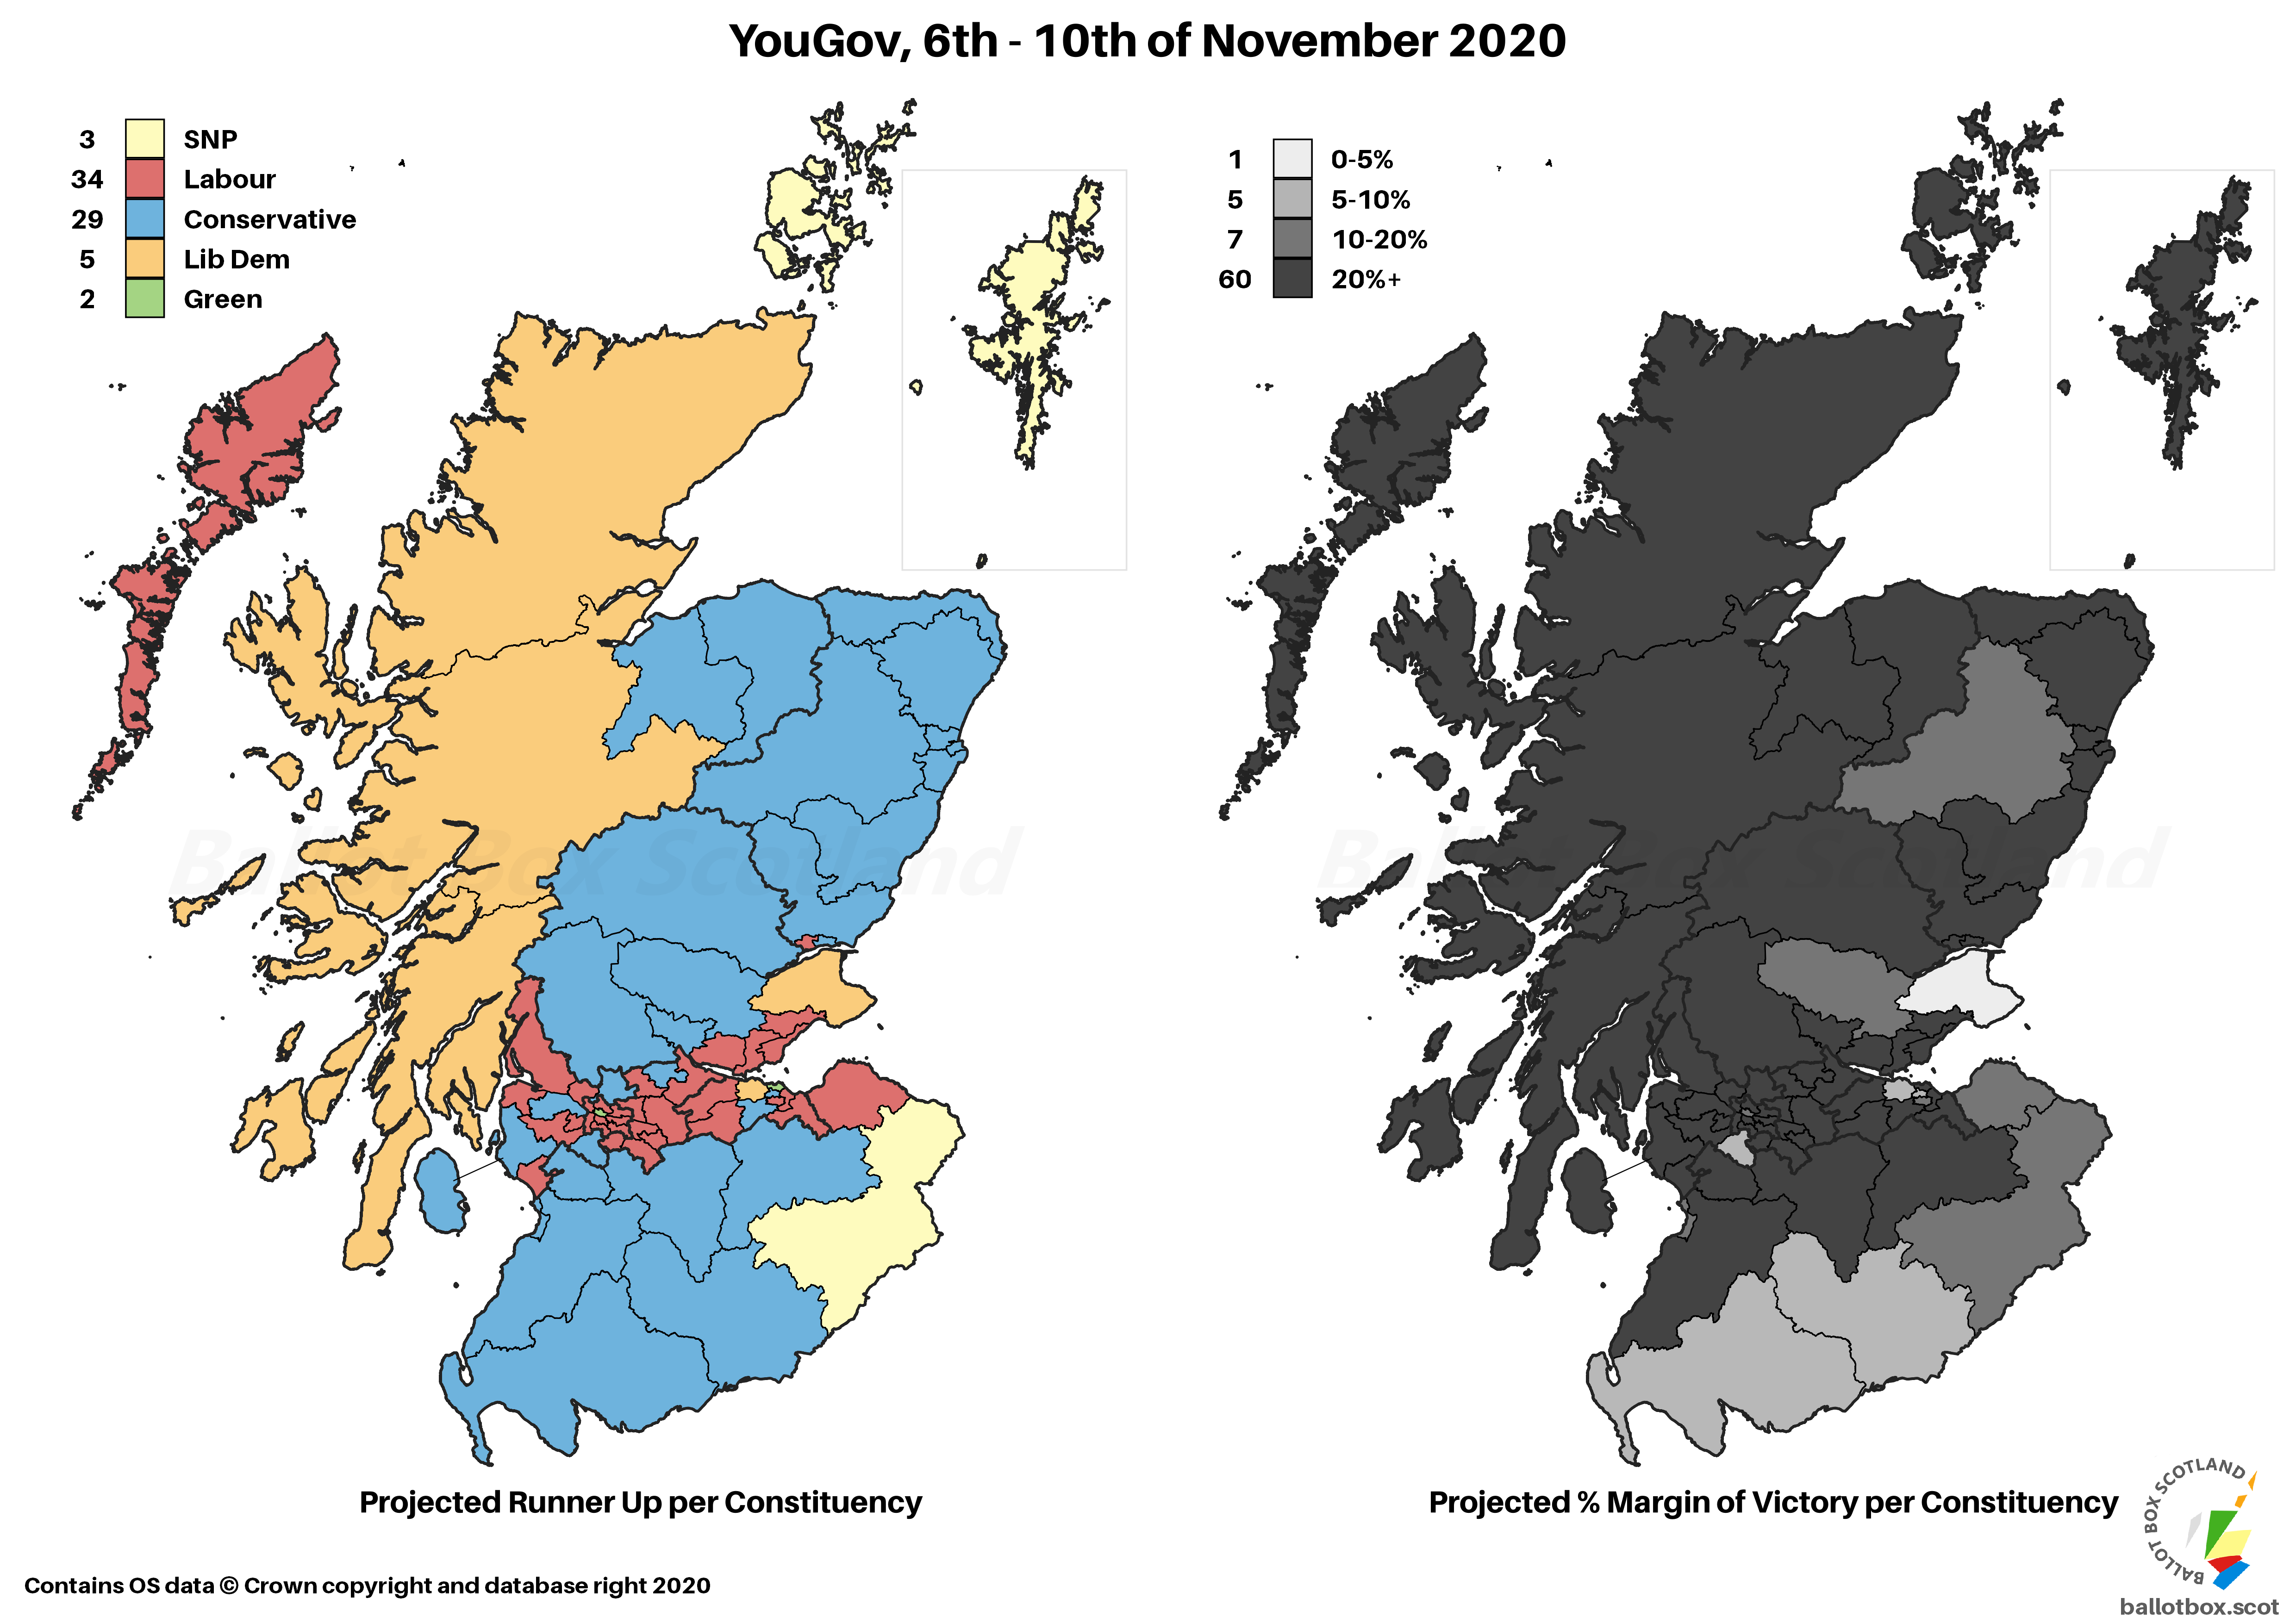
SNP - 53% (-1 / +8)
Conservative- 19% (-1 / -6)
Labour - 17% (+1 / -2)
Liberal Democrat- 4% (-1 / -6)
Green - 3% (+1 / +2)
Brexit - 3% (+1 / +2)
I probably don’t need to say “there’s a clear SNP lead” here as well, but there is. This is the vote where things are closest between the Conservatives and Labour, perhaps suggesting a degree of tactical thinking for Westminster – especially when looking at that startlingly low 4% for the Lib Dems. You have to go back to before the 2017 General Election to find another 4% poll, and before 2015 to find them polling below that.
Though obviously quite low, the Greens show their joint best Westminster intention in this poll, and Brexit their absolute best – indeed, for Brexit, it’s only YouGov that have reported any figures for them since last year’s election. These figures mean very little under the reality of FPTP, but they’ll do something fun but imaginary later in this post.
Standard Question
Yes - 43% (-2)
No - 42% (+2)
Don't Know - 10% (+1)
Note as ever that YouGov leave in additional “Refused” and “Would Not Vote” responses which amounted to 5%. As YouGov tables come purely in percentage format, trying to remove these myself could introduce further slight inaccuracies, so I just report the figures as given. This is the smallest lead Yes has had since a Panelbase had a tie in early May.
Excluding Don't Knows
Yes - 51% (-2 / +6)
No - 49% (+2 / -6)
That naturally translates to a slim majority once we take the Don’t Knows out. This is a bit below the current polling average – but given the Panelbase is slightly higher, we can say that polling is basically in the same place it has been for most of the year.
Council Area Projection
Please see this page for how projections work and important caveats.

This exact split is the most “fun” split, for a given value of fun. On a simple Uniform Swing versus 2014, this might put a total of 15 Councils in the Yes column, an increase on the 4 in 2014. It’d be equal for No with 15, down from 28 at the referendum. But Scotland has 32 councils, and that’s 30. What about the other 2? Well, Angus and Midlothian come out basically bang on 50-50 at this particular level of support.
The reality is of course that a future referendum wouldn’t be a uniform swing, and I’d say anywhere in the 50-55% bands should be seen as “completely on the fence”. Still, it’s mildly amusing to get a projected 50-50 anywhere.
Other Independence Questions
The tables also show a handful of further questions relating to whether voters would support a second referendum in various scenarios. The first is next year if the SNP win a majority:
- Should not be – 44% (+3)
- Should be – 43% (-1)
- Don’t Know – 13% (-2)
So a very narrow plurality for voters opposing a referendum even with an SNP majority. The same question was asked about a Pro-Independence but not purely SNP majority:
- Should not be – 48% (+2)
- Should be – 37% (-2)
- Don’t know – 15% (nc)
A much bigger gap in this case. There are some rather interesting democratic implications of ascribing more legitimacy to a policy if there’s a single rather than multi-party majority for it, but that’s perhaps a conversation for others to engage in. Finally for a 2021 referendum, if there isn’t a majority at all:
- Should not be – 58% (nc)
- Should be – 25% (nc)
- Don’t Know – 17% (nc)
As you’d expect, lack of a parliamentary majority for a referendum would have a very clear majority of Scots opposed to holding one. However, for one final question, they asked about the general principle of a referendum in the next 5 years (i.e. next term of Parliament):
- Should be – 44% (-3)
- Should not be – 40% (+3)
- Don’t Know – 16% (nc)
There’s a plurality in favour of such a referendum in the next 5 years, though narrower than when they last asked this question.
Finally, if the SNP did get a majority but the UK government refused to transfer powers to hold a referendum, what then?
- Should not hold a vote – 45% (+1)
- Should hold a vote – 39% (+1)
- Don’t Know – 16% (nc)
A clearer lead here for opposing a referendum in such circumstances.
Coronavirus
Handling of the Pandemic
Whilst we remain in the grips of a pandemic, we’re getting some Coronavirus specific polling too. Given how lengthy this post has gotten, I’m just going to give the total Well and Badly figures – if you want the very vs fairly breakdown, see tables. Starting with how well or badly the pandemic is being handled:
- By the UK Government
- Well – 21% (-2)
- Badly – 76% (-3)
- Don’t Know – 4% (nc)
- By the Scottish Government
- Well – 68% (-11)
- Badly – 28% (+10)
- Don’t Know – 5 (+1)
- By Boris Johnson
- Well – 19% (+1)
- Badly – 76% (-3)
- Don’t Know – 5% (+2)
- By Nicola Sturgeon
- Well – 70% (-9)
- Badly – 27 (+10)
- Don’t Know – 4% (+1)
It remains the case that Nicola Sturgeon and the Scottish Government are perceived to be handling the pandemic much better than Boris Johnson and the UK Government. However, there has been a substantial dip in confidence since the last poll, so it’s now a net figure of circa 40% for Well in both cases, versus 60% previously.
Attitude to varying restrictions
For the very final pieces from the tables, voters were asked about how they felt about Coronavirus related restrictions varying across the country. In terms of whether there should be a whole-UK or devolved approach to rules:
- Devolved – 68%
- Whole-UK – 23%
- Don’t Know – 9%
So a very clear majority of Scots feel the devolved administrations should be making their own decisions on this. They were also asked about whether rules should differ within Scotland depending on the levels of the virus in each:
- Should be different – 64%
- Should be the same – 24%
- Don’t Know – 12%
So, similarly, an overwhelming lead for the idea that different parts of the country should be treated differently as appropriate to local circumstances.
Last of all, respondents were asked whether they thought the approach take in Scotland or England was better:
- Scotland – 69%
- England – 8%
- Neither – 16%
- Don’t Know – 7%
Unsurprisingly given the relative approval for the two governments, most Scots feel the Scottish approach has been better.
Hypotheticals
As ever, the last little bit of analysis concerns those hypothetical and more proportional voting systems that I have a bee in my bonnet about here at BBS. The fact Westminster uses pure FPTP is an affront to democracy, and though Holyrood fares far better, AMS is still deeply imperfect. The examples here simply transpose the poll findings onto more proportional voting systems – the reality is that different systems would of course result in different voter behaviour.
Changes here are vs AMS / vs same projection for the last poll.
SNP - 62 (-12 / nc)
Conservative - 27 (+3 / -1)
Labour - 17 (nc / -1)
Green - 11 (+2 / +3)
Liberal Democrat - 8 (+3 / nc)
SSP - 4 (+4 / -1)

The usual story of the SNP’s substantial over-representation being corrected to the benefit of basically everyone else. Though the SSP don’t project to any seats under AMS, as they are bang on the 3% threshold for seats under this hypothetical model, that hands them a handful.
Much to my annoyance, you’ll see the Greens still have a weighty 3 seat lead over the Lib Dems despite just 1% between them. This particular poll just falls at an awkward point in the distribution where Green support nabs them a direct seat in most constituencies, and there aren’t enough levelling seats to fully correct for it. Basically, it’s hard to get this system 100% perfect 100% of the time with just 129 seats!

Scandinavian Style Westminster
Changes here are only versus the last poll, as I don’t do pure FPTP projections.
SNP - 32 (-2)
Conservative - 11 (-1)
Labour - 10 (nc)
Liberal Democrat - 2 (-1)
Green - 2 (+2)
Brexit - 2 (+2)

With a majority of the vote, the SNP do justify a majority of seats even in a more proportional model, though it’d be far smaller than the almost clean sweep that FPTP would deliver. The vote shares for the smaller parties deliver some wild stuff though.
The Lib Dems narrowly lose Orkney and Shetland in this projection, an event that if it actually happened would herald the coming of the apocalypse. With just 4% of the vote, they end up with as many seats as the Greens and Brexit. Though the Greens would typically expect to get a seat in Edinburgh in this scenario, the fact the Lib Dems lose the Northern Isles means they get first go of the levelling seats and Edinburgh is where that goes.
If you find this or other Ballot Box Scotland output useful and/or interesting, and you can afford to do so, please consider donating to support my work. I love doing this, but it’s a one-man project and takes a lot of time and effort. All donations, no matter how small, are greatly appreciated and extremely helpful.
(About Donations)


