
Background
Note that this post has taken much longer than usual because, given the amount of data that feeds into it, I decided this year to fully adopt a “wait until it’s all published before doing the results post rather than keep adding stuff in” policy. Obviously, that was tempting fate and not all data was made available by the council in a timely manner. I’m still missing what would be required to check direct second preferences for each party, but it’s now a week since the vote and three by-elections are happening as this is published, so I can no longer wait.
We’ve waited slightly longer for the first by-elections of 2021 thanks to the pandemic – but March is therefore absolutely bursting with them. First up we had double trouble in North Lanarkshire for two wards that had already had by-elections this term.
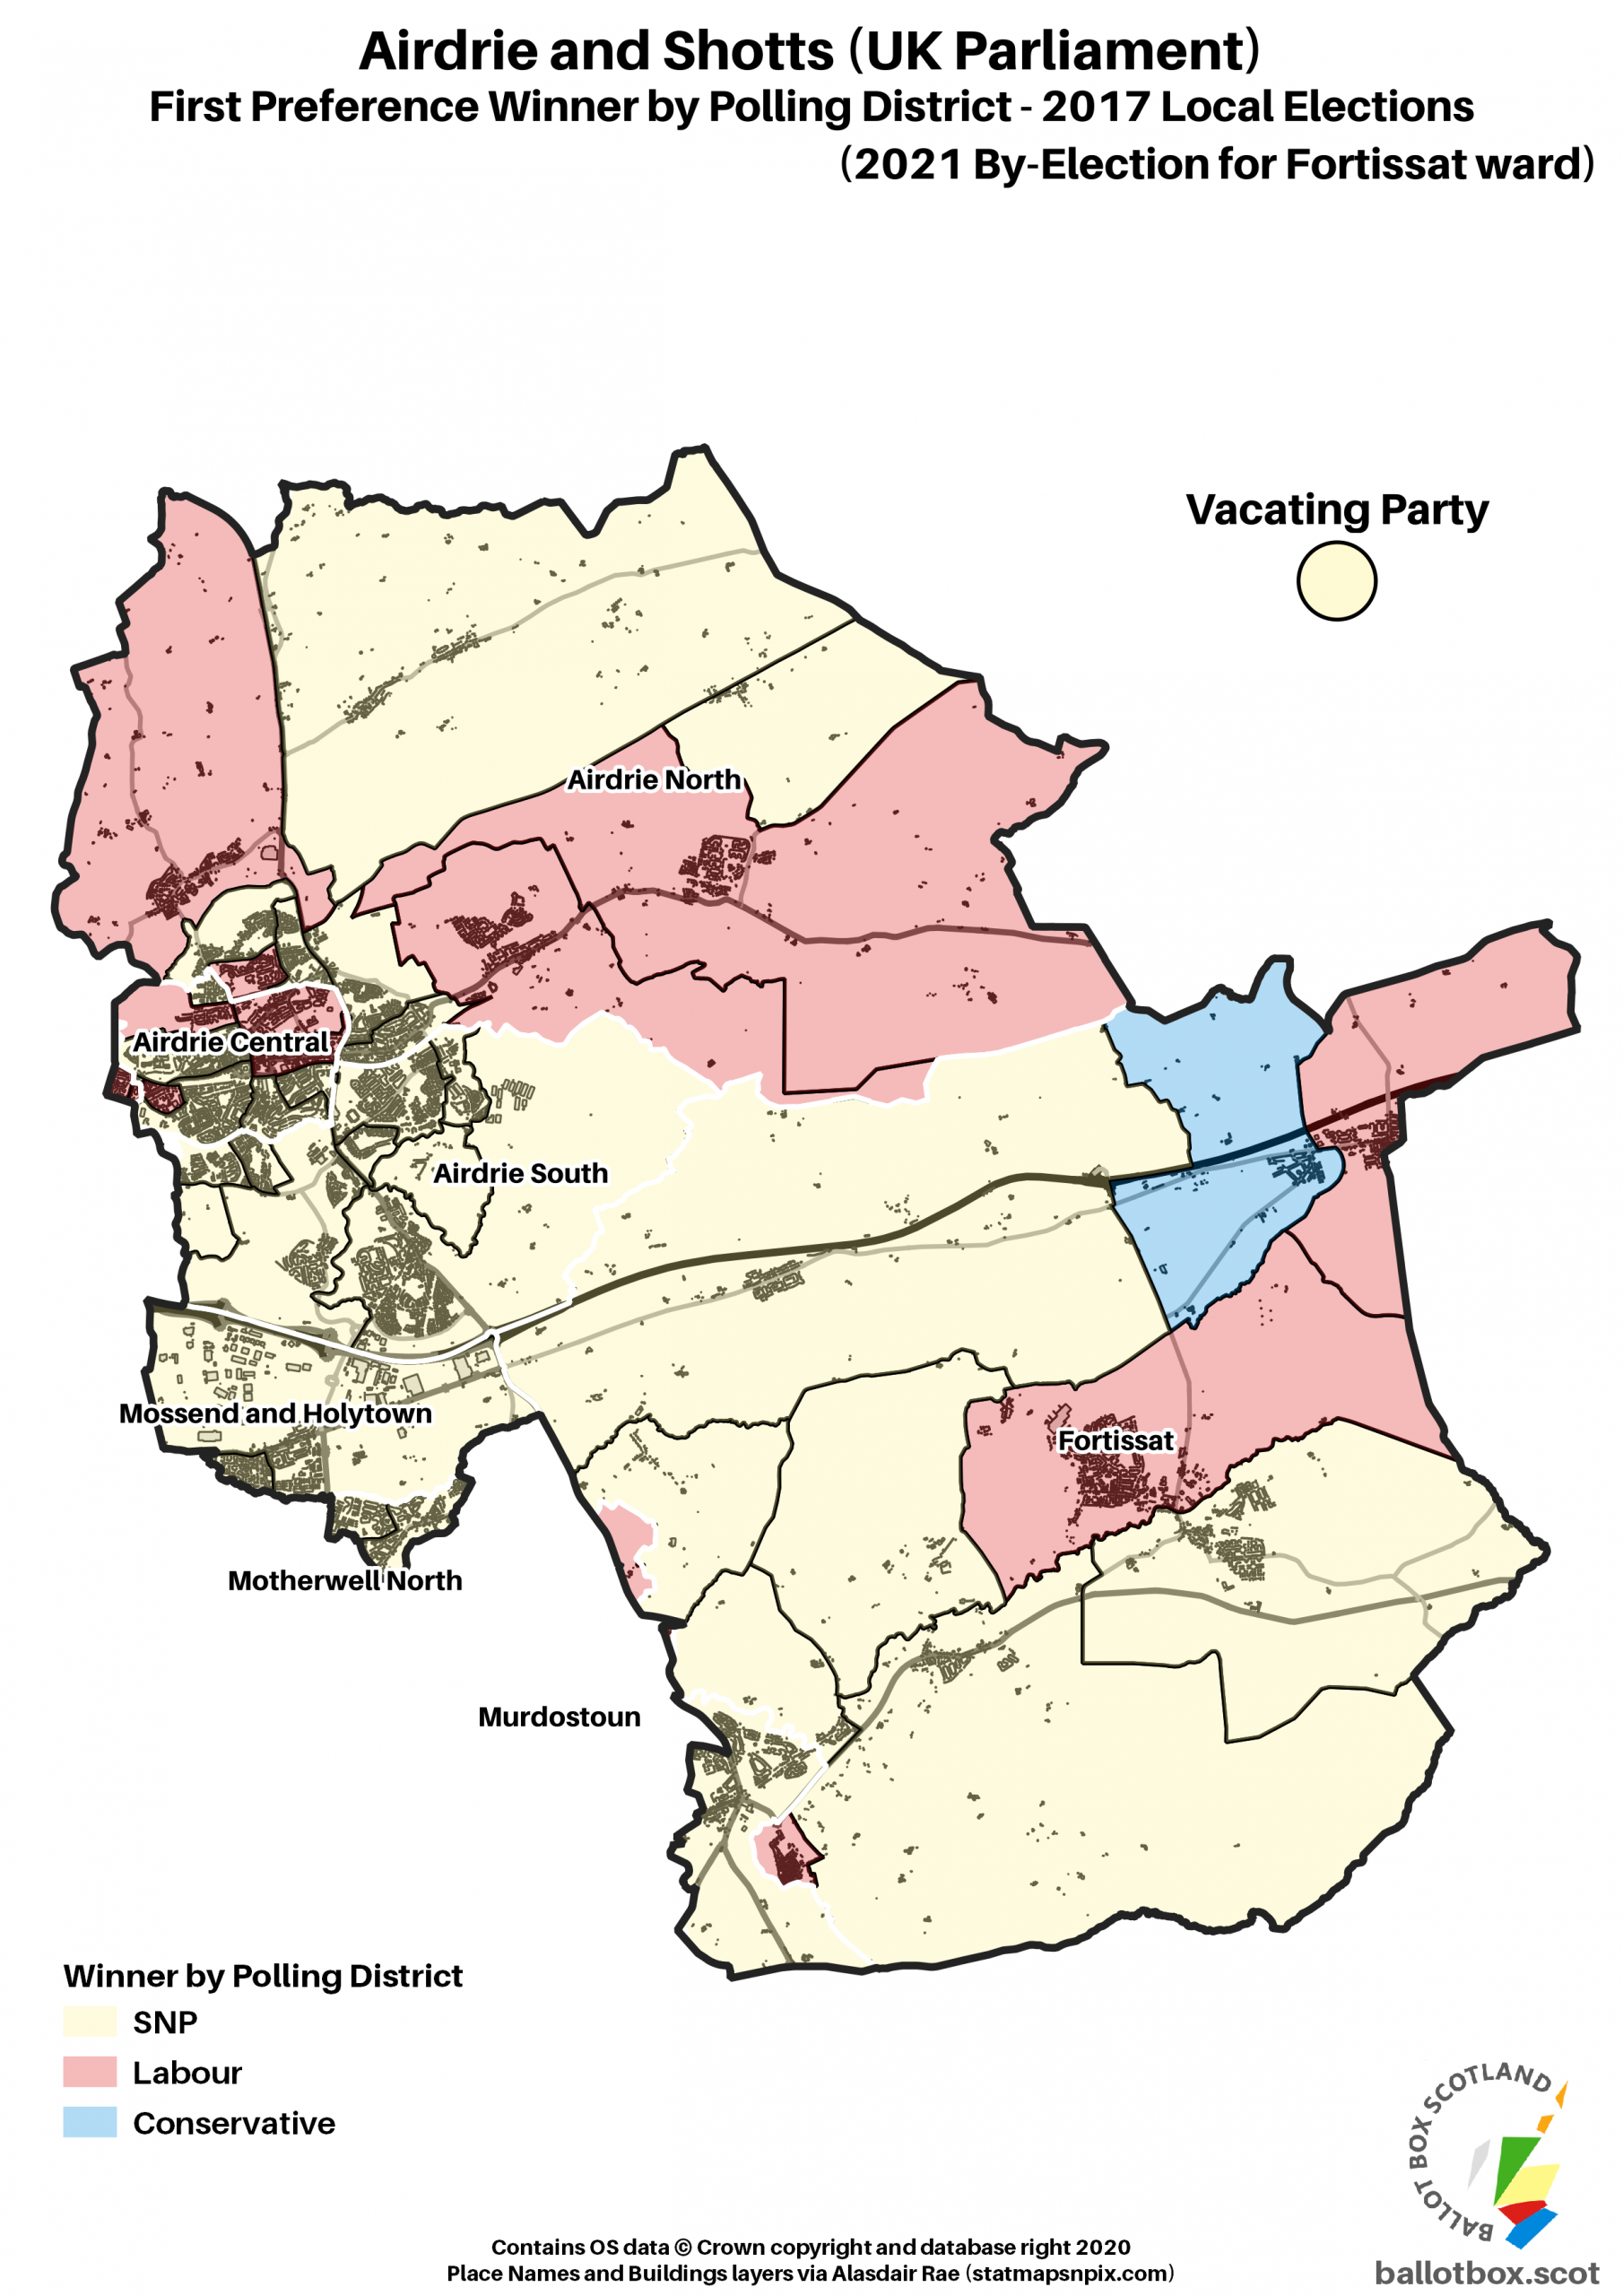
Both of the Thorniewood by-elections have been prompted by councillors that had become MPs resigning, with this one being the SNP councillor. In Fortissat it was an SNP-turned-Independent councillor who resigned. He was strictly speaking the first councillor to leave a vacancy in the ward, as the Conservative who prompted the 2017 by-election here did so by refusing to take up the office in the first place.
Although I had originally reckoned both of these as being quite safely Labour, strong SNP performances at the end of 2021 led me to revise that slightly. Thorniewood dropped down to “tossup” status, whilst Fortissat was “likely” rather than certain to go Labour, by my reckoning. So what actually happened?
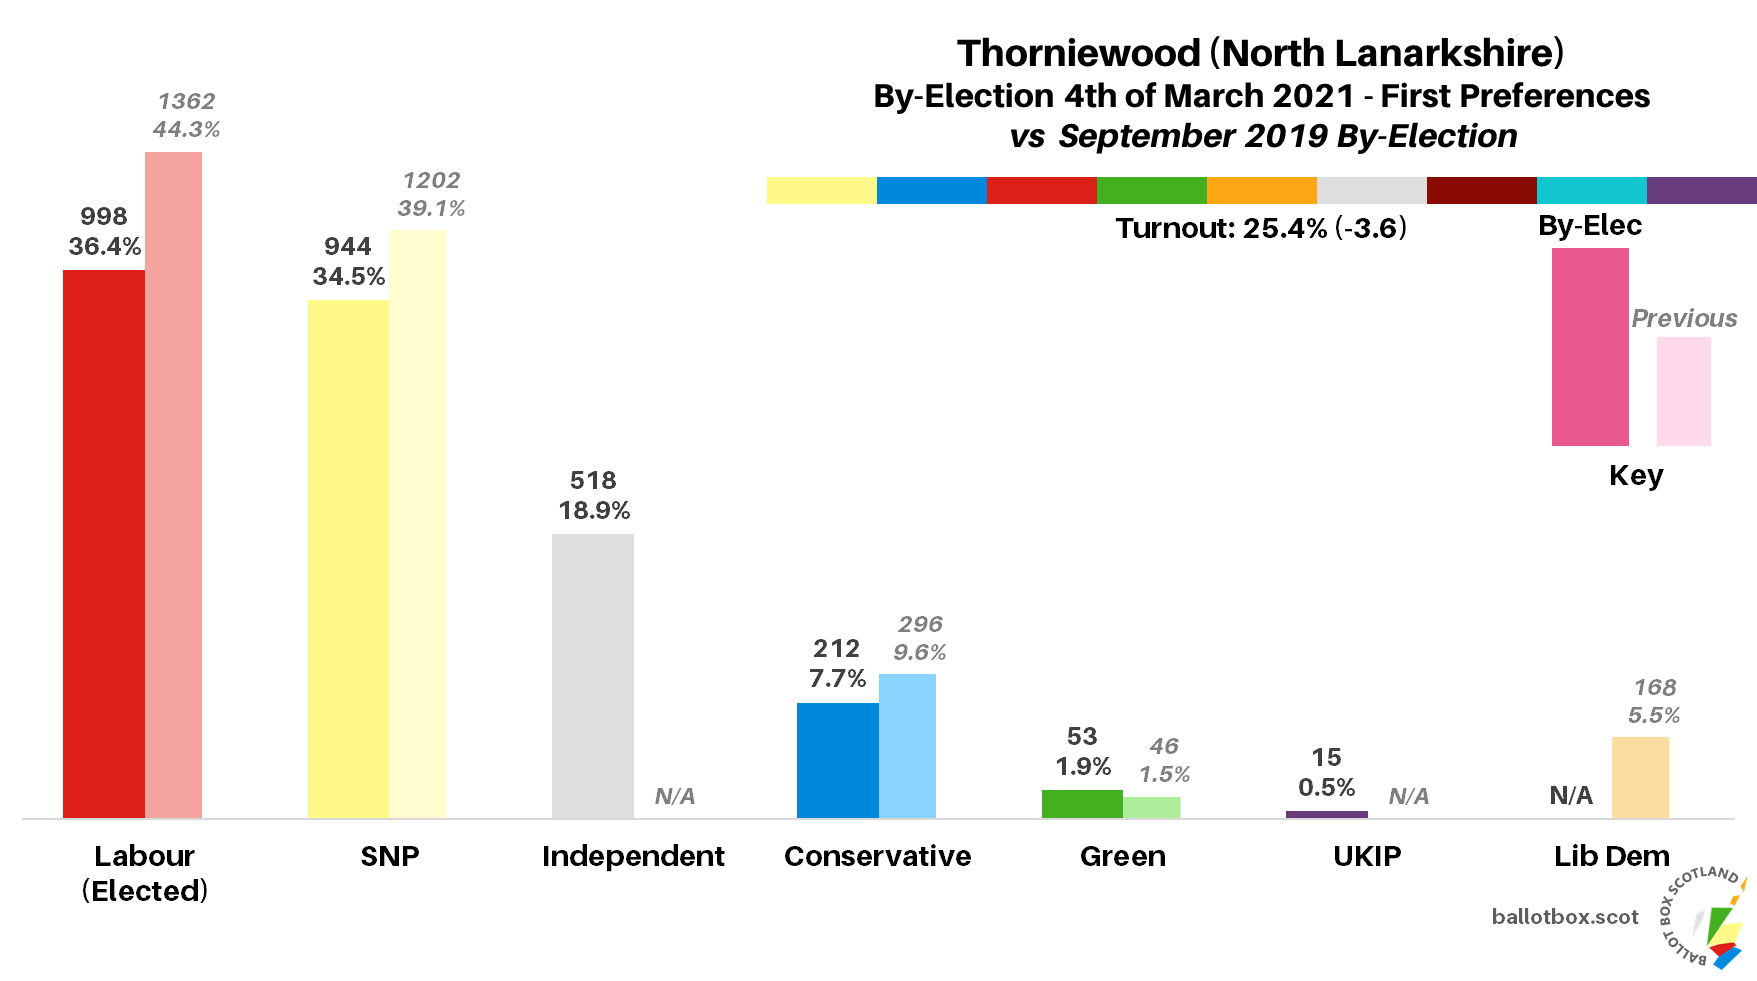
First Preferences - Thorniewood
A tossup was certainly the right call here, as although Labour retained the first preference lead, at 1.9% ahead of the SNP it was the closest it’s been this cycle. At the previous by-election the gap between the two was 5.2%, and at the full election in 2017 it was 11.6%. First preferences in full were (changes versus 2019 by-election / 2017 full election):
Labour - 998 (36.4%, -7.9 / -13.8)
SNP - 944 (34.5%, -4.6 / -4.2)
Independent - 518 (18.9%, +18.9 / +18.9)
Conservative - 212 (7.7%, -1.9 / -3.3)
Green - 53 (1.9%, +0.4 / +1.9)
UKIP - 15 (0.5%, +0.5 / +0.5)
Note that in the 2019 by-election the Lib Dems won 5.5% of the vote.
Part of the narrowing of the gap will have been that both of those parties lost support to a surprisingly strong Independent in the form of Joseph Budd. The Twitter patter seems to be that Budd was something of a disaffected local SNP member who opted to stand in his own right, and clearly did very well. That’s a level of support that could see him over the line in 2022 if he was able to build on it.
The only other party to win a substantial portion of the vote were the Conservatives, though it was their worst performance here over the period.
Transfers - Thorniewood
As no candidate had an outright majority of the vote, transfer rounds were necessary. The quota to reach here was 1371 votes.
Looking now at the transfers for the final head-to-head at stage 5 (changes vs final head-to-head stage in 2017 by-election / 2017 full election):
Labour - 1263 (46.1%, -3.6 / -7.5)
SNP - 1160 (42.3%, +1.0 / +2.2)
Didn't Transfer - 317 (11.6%, +2.6 / +5.3)
This is a good example of “just because people are constitutionally aligned, doesn’t mean voters transfer accordingly” in action! Though Budd and the Greens might be assumed to be more aligned with the SNP than Labour, the latter emerged the victors. Again though this is the narrowest the gap has been this cycle, at 3.8%, compared to 8.4% in 2019 and 13.5% in 2017.
Detailed Data - Thorniewood
Machine counts mean some really juicy data, starting with the breakdown of results per polling district.

The narrow margin between Labour and the SNP here manifests by the SNP picking up the last district Labour had led in the in-person vote in 2019, whilst Labour continue a very weighty lead amongst postal voters. However, Budd’s support was substantial enough to give him the lead in the districts covering the west of Viewpark and south of Tannochside. For the Conservatives, their strongest support (and only place crossing into double figures) was the big district covering Calderbraes, Birkenshaw and most of Tannochside.
First Preferences - Fortissat
I reckoned Fortissat was a safer bet for Labour due to the fact the party that placed second in the 2017 by-election was the (now) British Unionist Party. Although they didn’t stand again, a decision I found strategically bizarre to say the least, I figured it was a pretty safe bet those voters weren’t going to pile behind the SNP. Much like Thorniewood though, first preferences were quite close:
Labour - 1071 (38.4%, -0.1 / +1.9)
SNP - 965 (34.6%, +13.9 / +5.5)
Conservative - 656 (23.5%, +12.0 / +10.2)
Green - 69 (nice, 2.5%, +1.8 / +2.5)
UKIP - 31 (1.1%, +0.6 / +1.1)
Note that in the 2017 by-election what is now the British Unionist Party won 23.1% and an Independent 4.9% of the vote.
Labour still held the lead, but the SNP did close the gap – their swing versus the previous by-election looks particularly massive just because they did so terribly last time, relatively speaking. Looking at the figures though it seems quite clear the main beneficiaries from the missing BUP were the Conservatives, who more than doubled their share. Similar votes in 2017 would restore the 2 Labour, 1 SNP, 1 Conservative spread that 2017 should have delivered if the original Conservative winner had actually wanted to take up the seat.
It would be remiss of me, a relatively young person on the internet, not to note that the Green vote share is nice. 😎
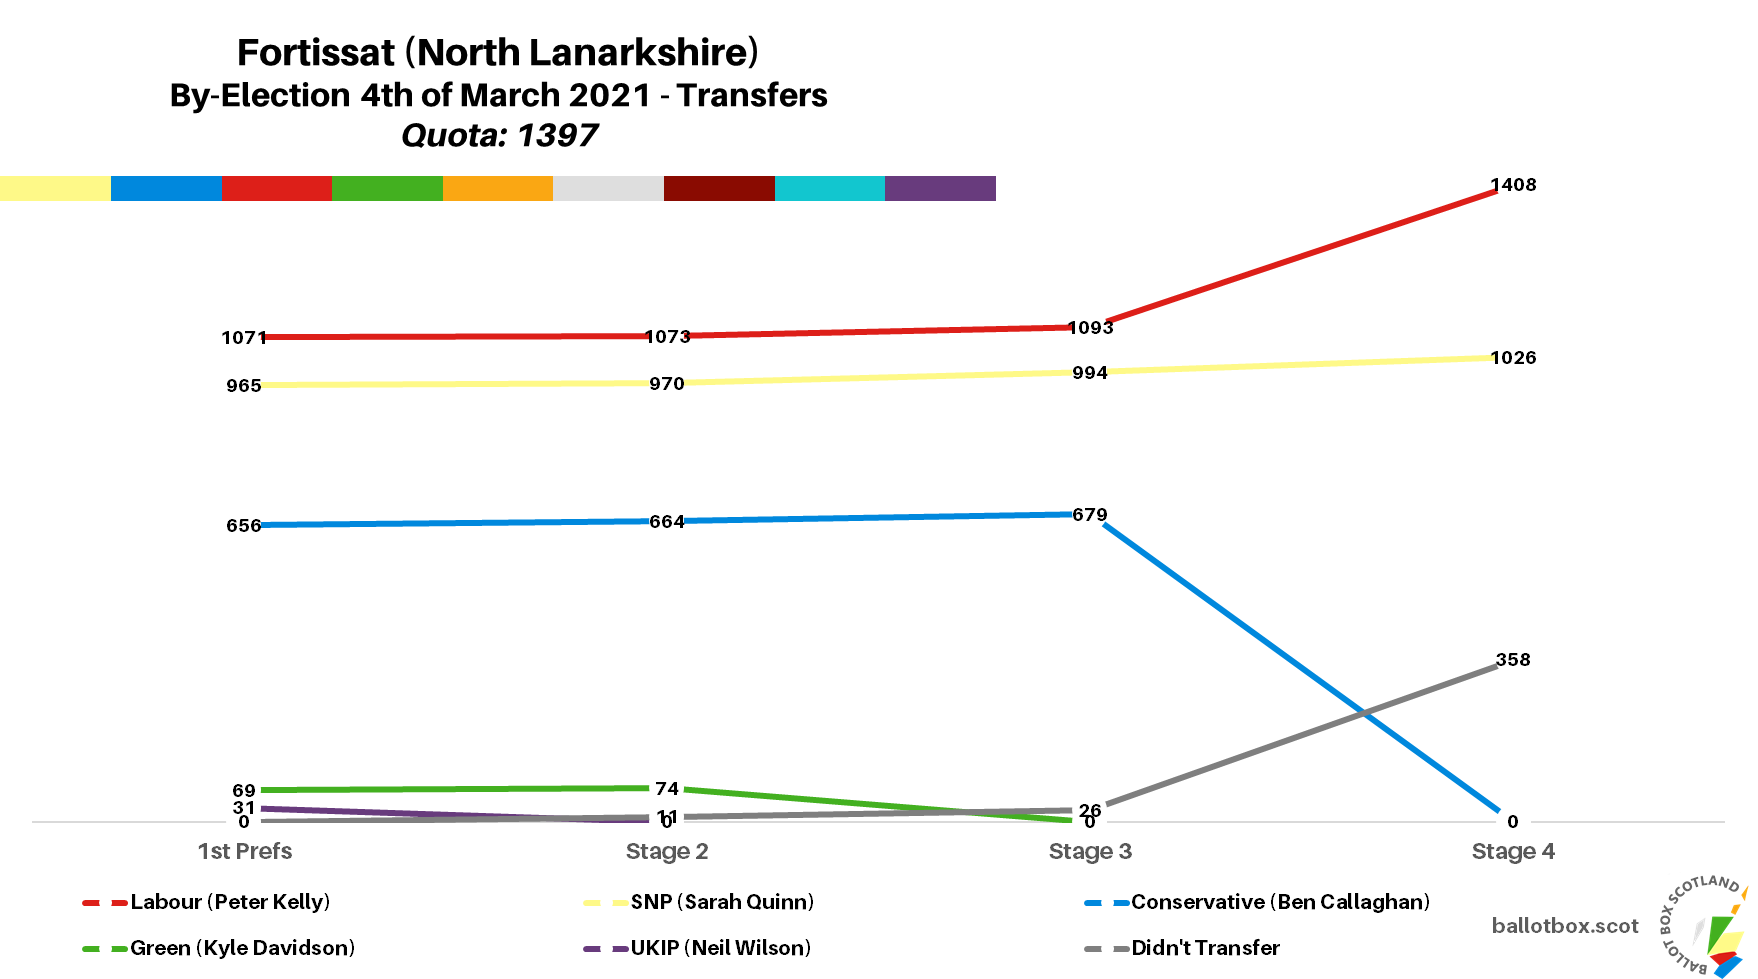
Transfers - Fortissat
As no candidate had an outright majority of the vote, transfer rounds were necessary. The quota to reach here was 1397 votes.
Looking now at the transfers for the final stage 4 (changes vs final head-to-head stage in 2017 by-election / 2017 full election):
Labour - 1408 (50.4%, +2.6 / +2.0)
SNP - 1026 (36.7%, +12.9 / +6.7)
Didn't Transfer - 358 (12.8%, -14.7 / -8.1)
Transfers are where we see why I had this one pegged as “likely” rather than a tossup. At 13.7% this is the narrowest the gap has been between the two parties in this term, but it’s about where Thorniewood was at the widest. Counterintuitively, that narrowing has taken place at the same time as Labour improving their last-stage performance overall, as this is the first time they beat the SNP with an absolute majority of the vote.
Detailed Data - Fortissat
Starting again with the breakdown per polling district… Note: “PP” stands for “Part Postal” – in this case as part of the requirement to merge boxes with fewer than 200 votes, some postal and in-person boxes were merged. I don’t like when they do this…

Some parallels here with Thorniewood, with the SNP claiming the lead in most polling districts. Labour do have leads of their own here though, most notably in the most populous district covering Shotts, and in Harthill where they benefitted most from the lack of the British Unionists. Next door in Eastfield the Conservatives ensured there was still a blue tint to this map. Greens did a little better in this ward than Thorniewood, with their best result in the district covering Morningside.
Nuances
I have written in the past about two of the beefs I have with by elections – “gain/loss/hold” terminology in STV, and clean sweeps of councillors. Since it’s the start of a new year and we have a lot of by-elections coming it, now feels like a good time to go back over them.
On the first one, I very specifically do not use that terminology for STV by-elections because it simply isn’t helpful. In FPTP, at least most of the time (some multi-member ward oddities in England aside), there is a direct correlation between the winning party and who gets the seat. That isn’t the case in STV, where what you could define as the seat and vote winner don’t always align.
That’s why I go back and re-calculate 2017 for a single seat to get a more accurate indication. Both of these by-elections saw “minority” councillors creating vacancies, and therefore we shouldn’t have viewed them as being the people who “held” the seat previously in political terms. And whilst it’s accurate in terms of seats on the council, your average person taking an interest on Twitter only wants to know the electoral context, it doesn’t matter one bit to them what the council then does.
It does bother me that the UK wide polling and election folks do persist in using this terminology. That specific frustration is actually a small part of why I started Ballot Box Scotland! It’s hard to communicate nuance on Twitter, and when you look at the responses to those tweets, you see loads of people who just have not understood the situation because they have quite reasonably taken “x party gain” to mean the seat has been politically flipped.
Part of my aim with BBS is to help improve understanding of these things, and I take that commitment very seriously. I would hope others could take the same approach, and stop transplanting FPTP terminology onto STV. The political context of these by-elections isn’t “Labour gain seats from the SNP”, it’s “the SNP gain ground in some of Labour’s remaining strongholds despite by-election dynamics”, as shown in the chart below.
That’s less fun for people on one side of the constitutional divide than for those on the other, and pointing it out will undoubtedly be taken as biased by some, but it’s a really important distinction if you want to have an accurate understanding of the situation. I’d be making exactly the same point if it was the other way around, with the SNP having benefitted from a Labour resignation but lost ground in votes. I just like to be correct is all.

Anyway, on the second point, both of these wards are now entirely represented by Labour councillors. There’s another by-election coming up this month that could do the same for Conservative councillors, and another due soon that only isn’t at the same risk because one of the councillors has been expelled from their party. This goes completely against what STV is meant to do, which is represent the diversity of views in the electorate.
When the SNP (briefly) pulled this off in Dundee’s North East ward, and also (again, briefly) made that council a majority SNP administration, I was similarly scathing. This is distinctly not a partisan point, it’s a principle. If we’re using a voting system that’s meant to give voice to the overwhelming majority of voters, by-elections like these completely undermine that. As satisfying as it may be for the party holding all the seats, it also puts them in the slightly awkward position of either having to deselect one or more of those councillors at the next election, or stand them all despite over-contesting being inadvisable in STV.
As shocking as it may be as a concept to people who expect that you must always personally and individually elect a councillor, that isn’t the sum and total of democracy. Following the Northern Irish model of allowing the vacating councillor’s party to nominate a replacement, whilst Independents provide a list of possible replacements, is probably the way forward so long as we have STV. The right of political minorities in each ward to their representation trumps the right of the majority to get to install yet another councillor of their preference.
Phew! This was a LONG post! Anyway, we’ve got three by-elections this week, and FOUR next week, then two in the final week of March. They should generally have less need for nuance, and since they are generally in different councils I’m going to do the results as separate posts rather than combined.
If you find this or other Ballot Box Scotland output useful and/or interesting, and you can afford to do so, please consider donating to support my work. I love doing this, but it’s a one-man project and takes a lot of time and effort. All donations, no matter how small, are greatly appreciated and extremely helpful.
(About Donations)
