
Background
To kick off a busy few weeks of by-elections, we visited East Livingston and East Calder in West Lothian. This is the second time we’ve seen a by-election in the area this year, after Livingston South in March. This one had come about following the sad passing of very long serving Labour councillor Dave King.
As in Livingston South, the SNP had led the 2017 first preferences here, but a Labour candidate would have emerged victorious from a single-seat count. I have a feeling that may have been very much to do with King’s quarter-century as a councillor, but besides that, given both the SNP victory in Livingston South and continuing SNP success and Labour woes in May, I reckoned this was leaning the SNP’s way.
First Preferences
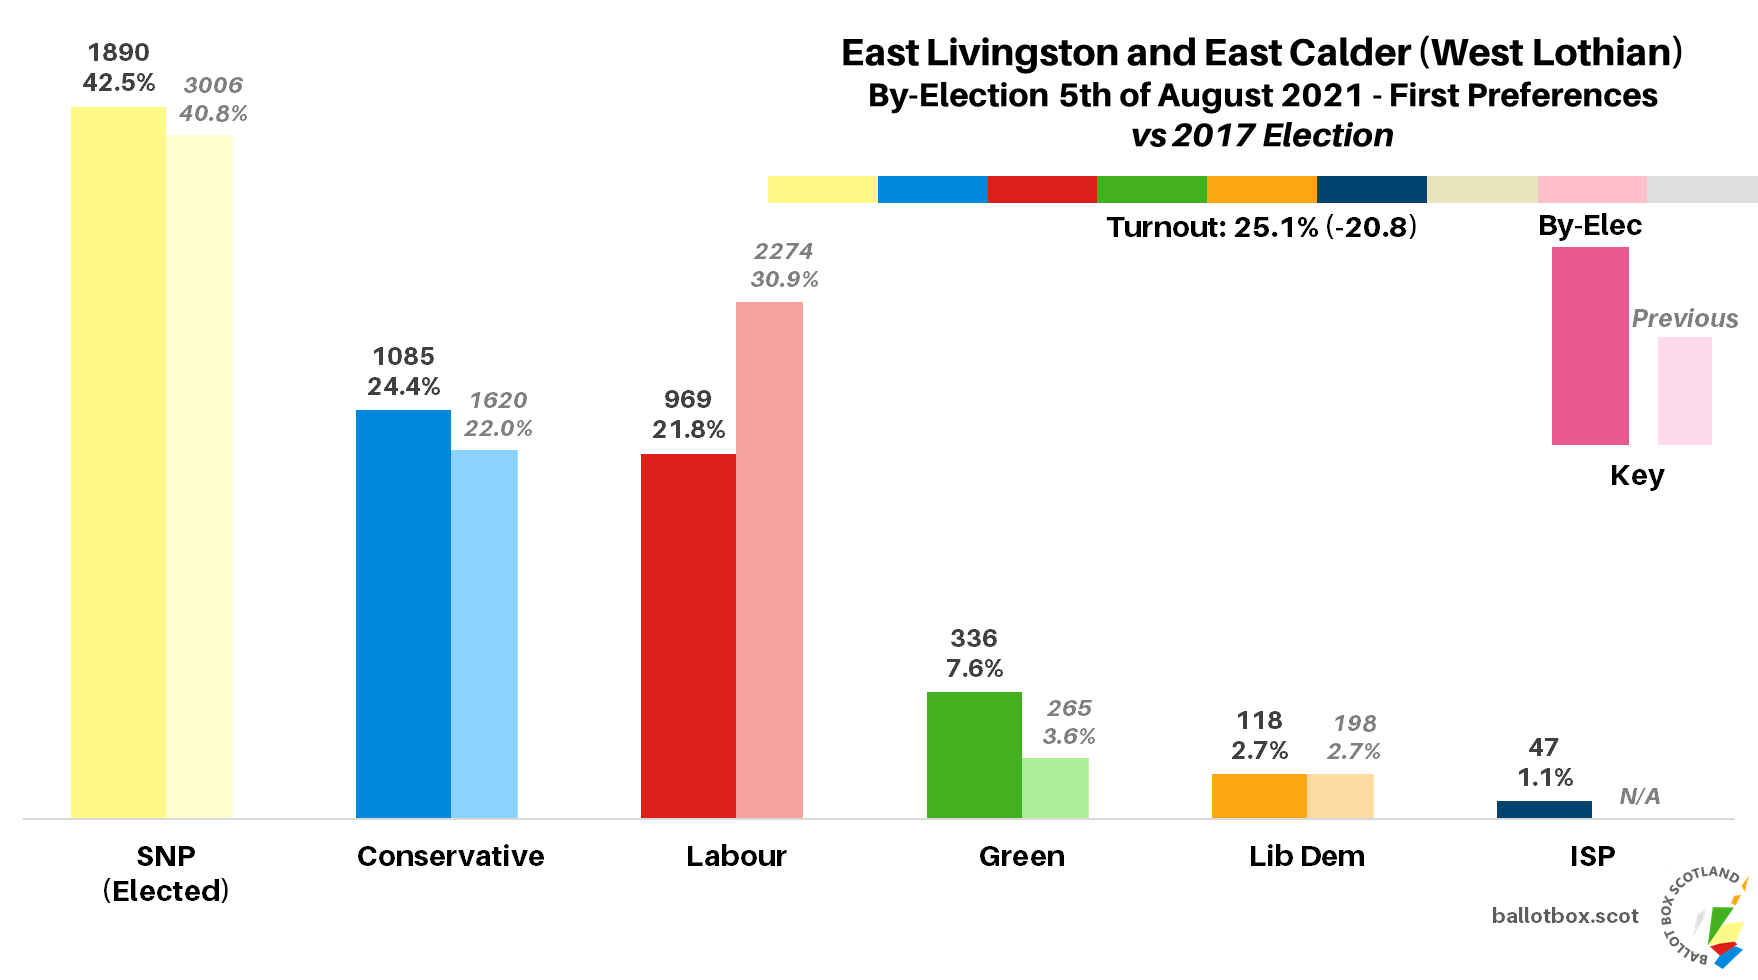
Sure enough, the SNP came out on top, though Labour had an even worse result than I anticipated. First preferences in full were (changes versus 2017 election):
SNP - 1890 (42.5%, +1.7)
Conservative - 1085 (24.4%, +2.4)
Labour - 969 (21.8%, -9.1)
Green - 336 (7.6%, +4.0)
Liberal Democrat - 118 (2.7%, nc)
ISP - 47 (1.1%, new)
Indeed, Labour did so poorly here that they fell into third place behind the Conservatives. I hadn’t really expected that, though a narrowing would have been unsurprising given the general dynamics of by-elections. Conservative overtaking was down more to Labour losses than their own gains, with a relatively modest increase. The SNP too had their share bump by a little.
Though remaining a distant fourth place, the Greens found themselves with a notably positive result. Not only did they see the largest vote share increase, they were also the only party to win more total votes than they had in 2017. The Lib Dems meanwhile were completely static in share, and the ISP did a good bit better on their second outing than they had in their first, but still barely registered.
Transfers
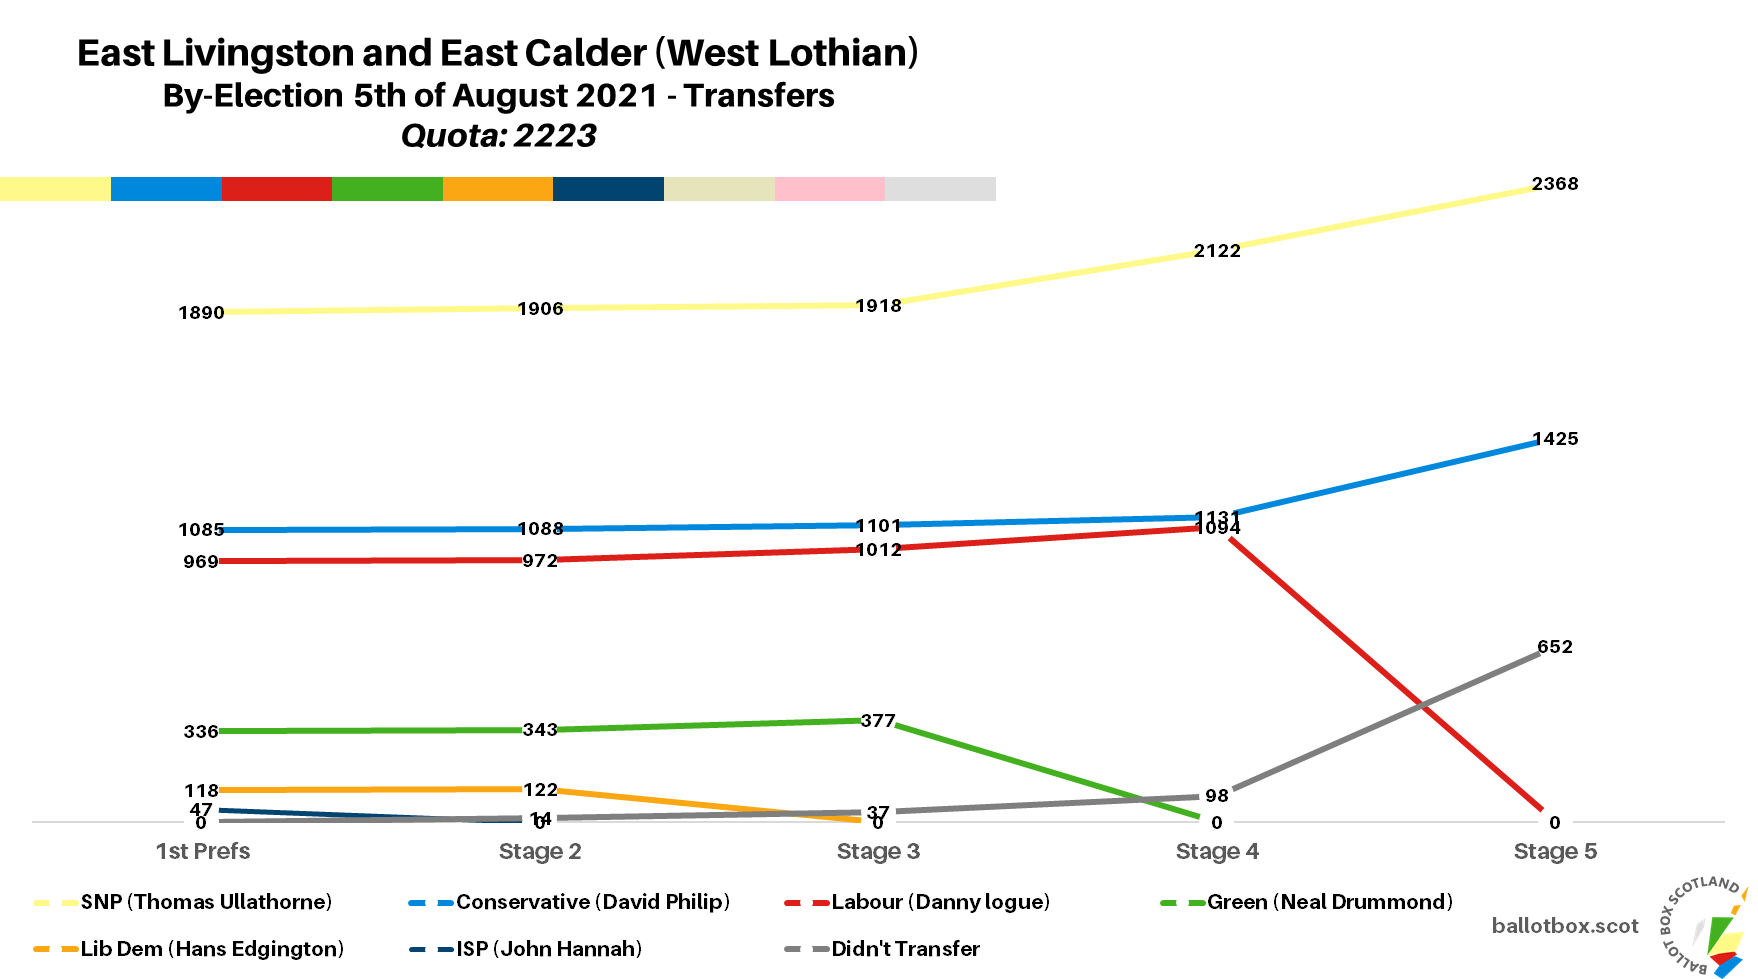
As no candidate had an outright majority of the vote, transfer rounds were necessary. The quota to reach here was 2223 votes.
Looking now at the transfers for the final head-to-head at stage 5 (changes vs final head-to-head stage in 2017 election re-calculation):
SNP - 2368 (53.3%, +13.5)
Conservative - 1425 (32.1%, +32.1)
Didn't Transfer - 652 (14.7%, -5.9)
Though the Conservatives held their second place throughout the count, they never came close to catching up with the SNP. In fact, the gap ends up wider than it started, with the SNP going on to a relatively rare finale where the victor hasn’t had to take the count to last candidate standing. Third placed Labour are the ones who do some closing during the process, to get within 0.8% of the Conservatives before crashing out.
As ever when there is a change in the top two, the swings can look a bit odd. If we quickly re-calculate 2017 for SNP vs Conservative, it’d have been 44.2% vs 31.4% – and thus +9.1 vs +0.7. That’s a reminder that in many urban Central Belt wards, an SNP-Conservative faceoff is more likely to lead to SNP victory than SNP-Labour. Labour’s late Dave King was the most popular individual candidate back in 2017, and even in this by-election an SNP-Labour final round would have been closer at 49.1% vs 34.7%.
Detailed Data
Machine counts mean some really juicy data, starting with the breakdown of results per polling district. West Lothian Council are currently my absolute favourites, as they had this up very quickly after the count finished.

The SNP end up clear winners in every part of the ward, with nobody coming within 10% of them in any district, or the postal vote, and their strongest share coming from Pumpherston. Although the Conservatives displace Labour for second overall, they don’t really have any massively strong areas so don’t lead in any district, though proving best in Mid Calder.
Labour’s poor showing extended to losing their lead in Dave King’s historic stronghold of East Calder, where they actually placed third this time. That meant their best result came from the eastern end of Craigshill. The Greens meanwhile seemed to pick up a lot of that Labour vote in East Calder, but narrowly did best in Kirknewton.
Finally, the Lib Dems have a pretty meek showing in every district, with only their postal vote breaking 3%, and the ISP similarly squeak across that figure in western Craigshill. In case you’re wondering, the reason for focusing on that arbitrary figure is that 3% is roughly the point at which the label fits within the bar on the static, Excel-generated version of that chart.
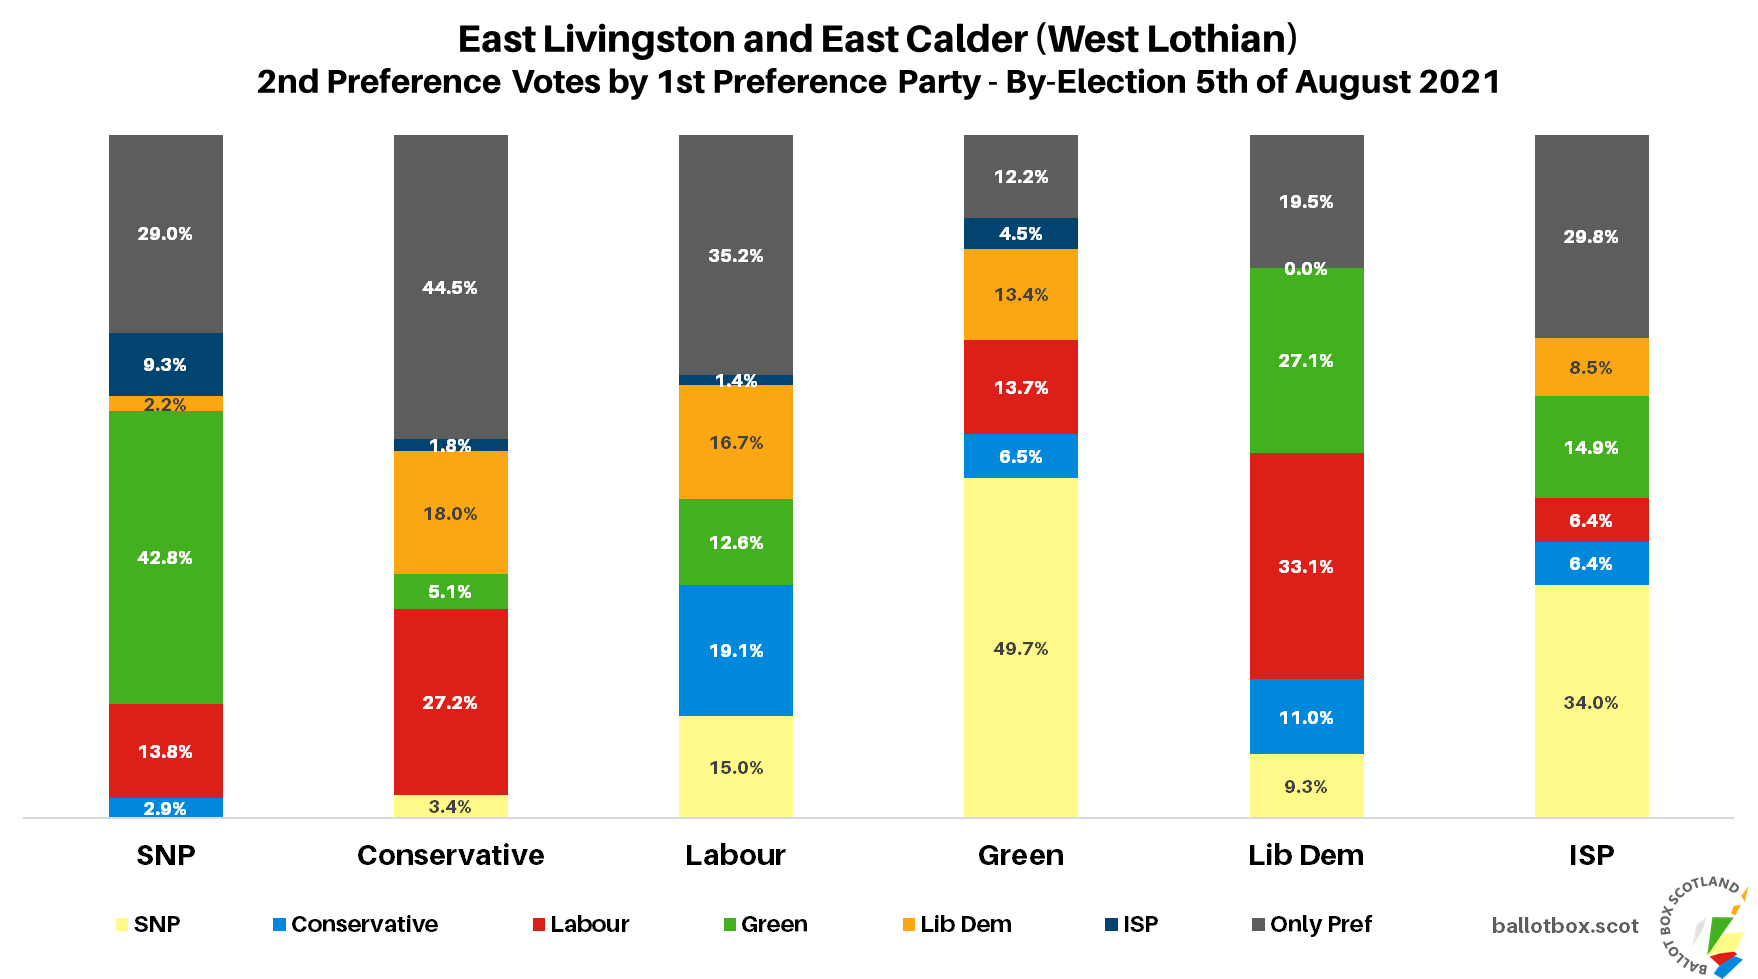
Now, let’s end by having a look at the second preference votes, bearing in mind we can’t get those simply from the transfer chart.
For starters we have that very common, very strong mutual preferencing between the SNP and Greens. Though the ISP were on the scene and their voters were unsurprisingly most favourable to the SNP, the return rate from the two major pro-Independence parties was pretty low, falling behind SNP to Labour transfers and even less popular than Green to Conservative.
Moving to the pro-Union parties, the Conservatives were most favourable to Labour, who sort of returned the favour. I say sort of in that Labour preferences here very much show why we need to take care with pluralities, as it’s actually a pretty even split across the four other major parties. That leaves the Lib Dems, who were largely fans of Labour.
If that’s given you a taste for by-elections again, remember we have three of them next Thursday! I’ve taken the Friday off work so that I can be a dedicated nerd, so check in then.
If you find this or other Ballot Box Scotland output useful and/or interesting, and you can afford to do so, please consider donating to support my work. I love doing this, but it’s a one-man project and takes a lot of time and effort. All donations, no matter how small, are greatly appreciated and extremely helpful.
(About Donations)

