As the 2026 Scottish Parliament election approaches, keep up to date with all the latest polling and analysis on Ballot Box Scotland’s Holyrood Hub page!
Poll Details and Context
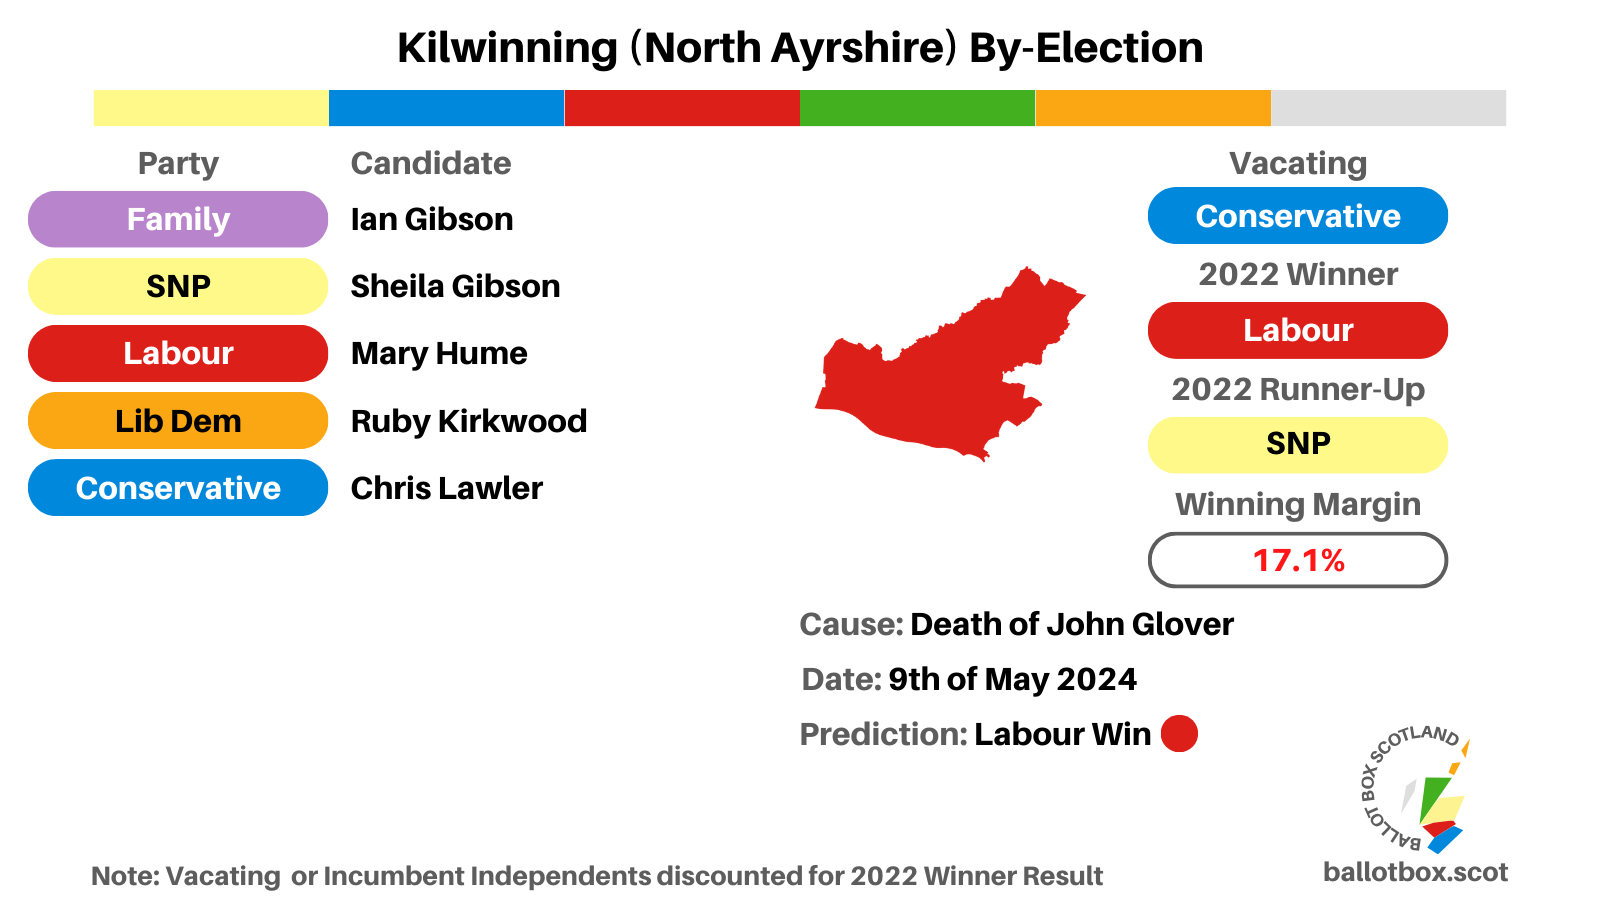
It’s been a comparatively busy old time for Scottish polling, as over the end of March and April we ended up with a whopping four polls running fieldwork. The latest to conclude of these is from More in Common (link to tables), who have not been a massively frequent pollster for Scotland, but nor have they been totally unheard from.
I had a brief period there where I was kind of keeping MIC polls at arm’s length: they got added to my tracker but I didn’t give them dedicated analysis, because they’re… off in just slightly too many ways for me to feel comfortable with them, and over this term, especially given the dearth of regular Scottish polls, I’ve gotten into a habit of being harsher on odd polls. So close to the election though I’m giving this one the full treatment.
The previous More in Common covered the 30th of January to the 10th of February. It’s just Holyrood figures in this one, so changes are shown as (vs that poll / vs 2021).
Regional Vote
Change vs Last Poll
Change vs 2021
Margin of error warning!
Movement versus the last poll is almost entirely margin of error, with only a big dip for the SNP being potentially statistically significant. This is worth pointing out because it’s not only the lowest SNP share in the current average, but it also goes against trend since January towards slight increases. Before this poll entered the mix, the tracker on the Holyrood Hub page has the SNP gaining nearly 2%.
Labour and Reform remain in a straight tie here, though whereas this is middling in terms of Reform’s recent shares, it’s the joint highest for Labour. Of the five polls in the tracker, they’re on 17% with three of them. It’s a similar story for the Conservatives, who replicate their 13% here across three pollsters, versus much weaker shares with the other two.
Finally the Lib Dems and Greens are in a statistical dead-heat here, with a notional advantage to the Lib Dems. Although it’s margin of error in several other cases, this is the only poll with the Lib Dems ahead of the Greens. I remain dubious about such high Lib Dem shares, and especially where they outstrip (however narrowly) their constituency support: I simply don’t see where the current Scottish Lib Dems draw 12% from.
The Greens meanwhile can at least take comfort that even one of their worst pollsters (at both Scottish and GB-wide levels) have found them into double digits. That’s the joint lowest share in the current average, and that matters because the tendency for the Greens is to underperform their average, not against every poll, so alignment on 11% for their lowball pollsters bodes well for them.
Constituency Vote
Change vs Last Poll
Change vs 2021
Margin of error warning!
Even less change over on the constituency vote, which echoes a lot of what was said in the previous section. This is easily the lowest SNP share for this vote, it’s a shared peak for Labour with two other polls, Reform are middling, and it’s the best Lib Dem figure in the average. The slight difference is it’s also the best Conservative share rather than joint best, though it’s only 1% better than the next highest polls.
Note of course that the Greens cannot receive their polled share here given their limited slate of constituency candidates. More in Common do tend towards long fieldwork periods, which makes me wonder why they didn’t just wait until after the close of nominations to do this one. Adding junk Green figures to the narrative (with related impacts on the SNP) two weeks after nominations closed is not the most illuminating approach.
If we chuck the Greens out of most constituencies, their re-projected constituency share is just 2%, with the SNP going up to 35%, Labour to 20% and the Lib Dems to 12%. In other words, that adds 3% to the SNP’s advantage over Labour. If anything that might be an underestimate; the 3:1 ratio for Green voter movement is based on 2022 transfer patterns. It’s entirely possible and in fact quite likely that the current Green voter base is even less Labour favourable.
Seat Projection
Projecting that into seats might give us something like this:
Please see this page for how projections work and important caveats.
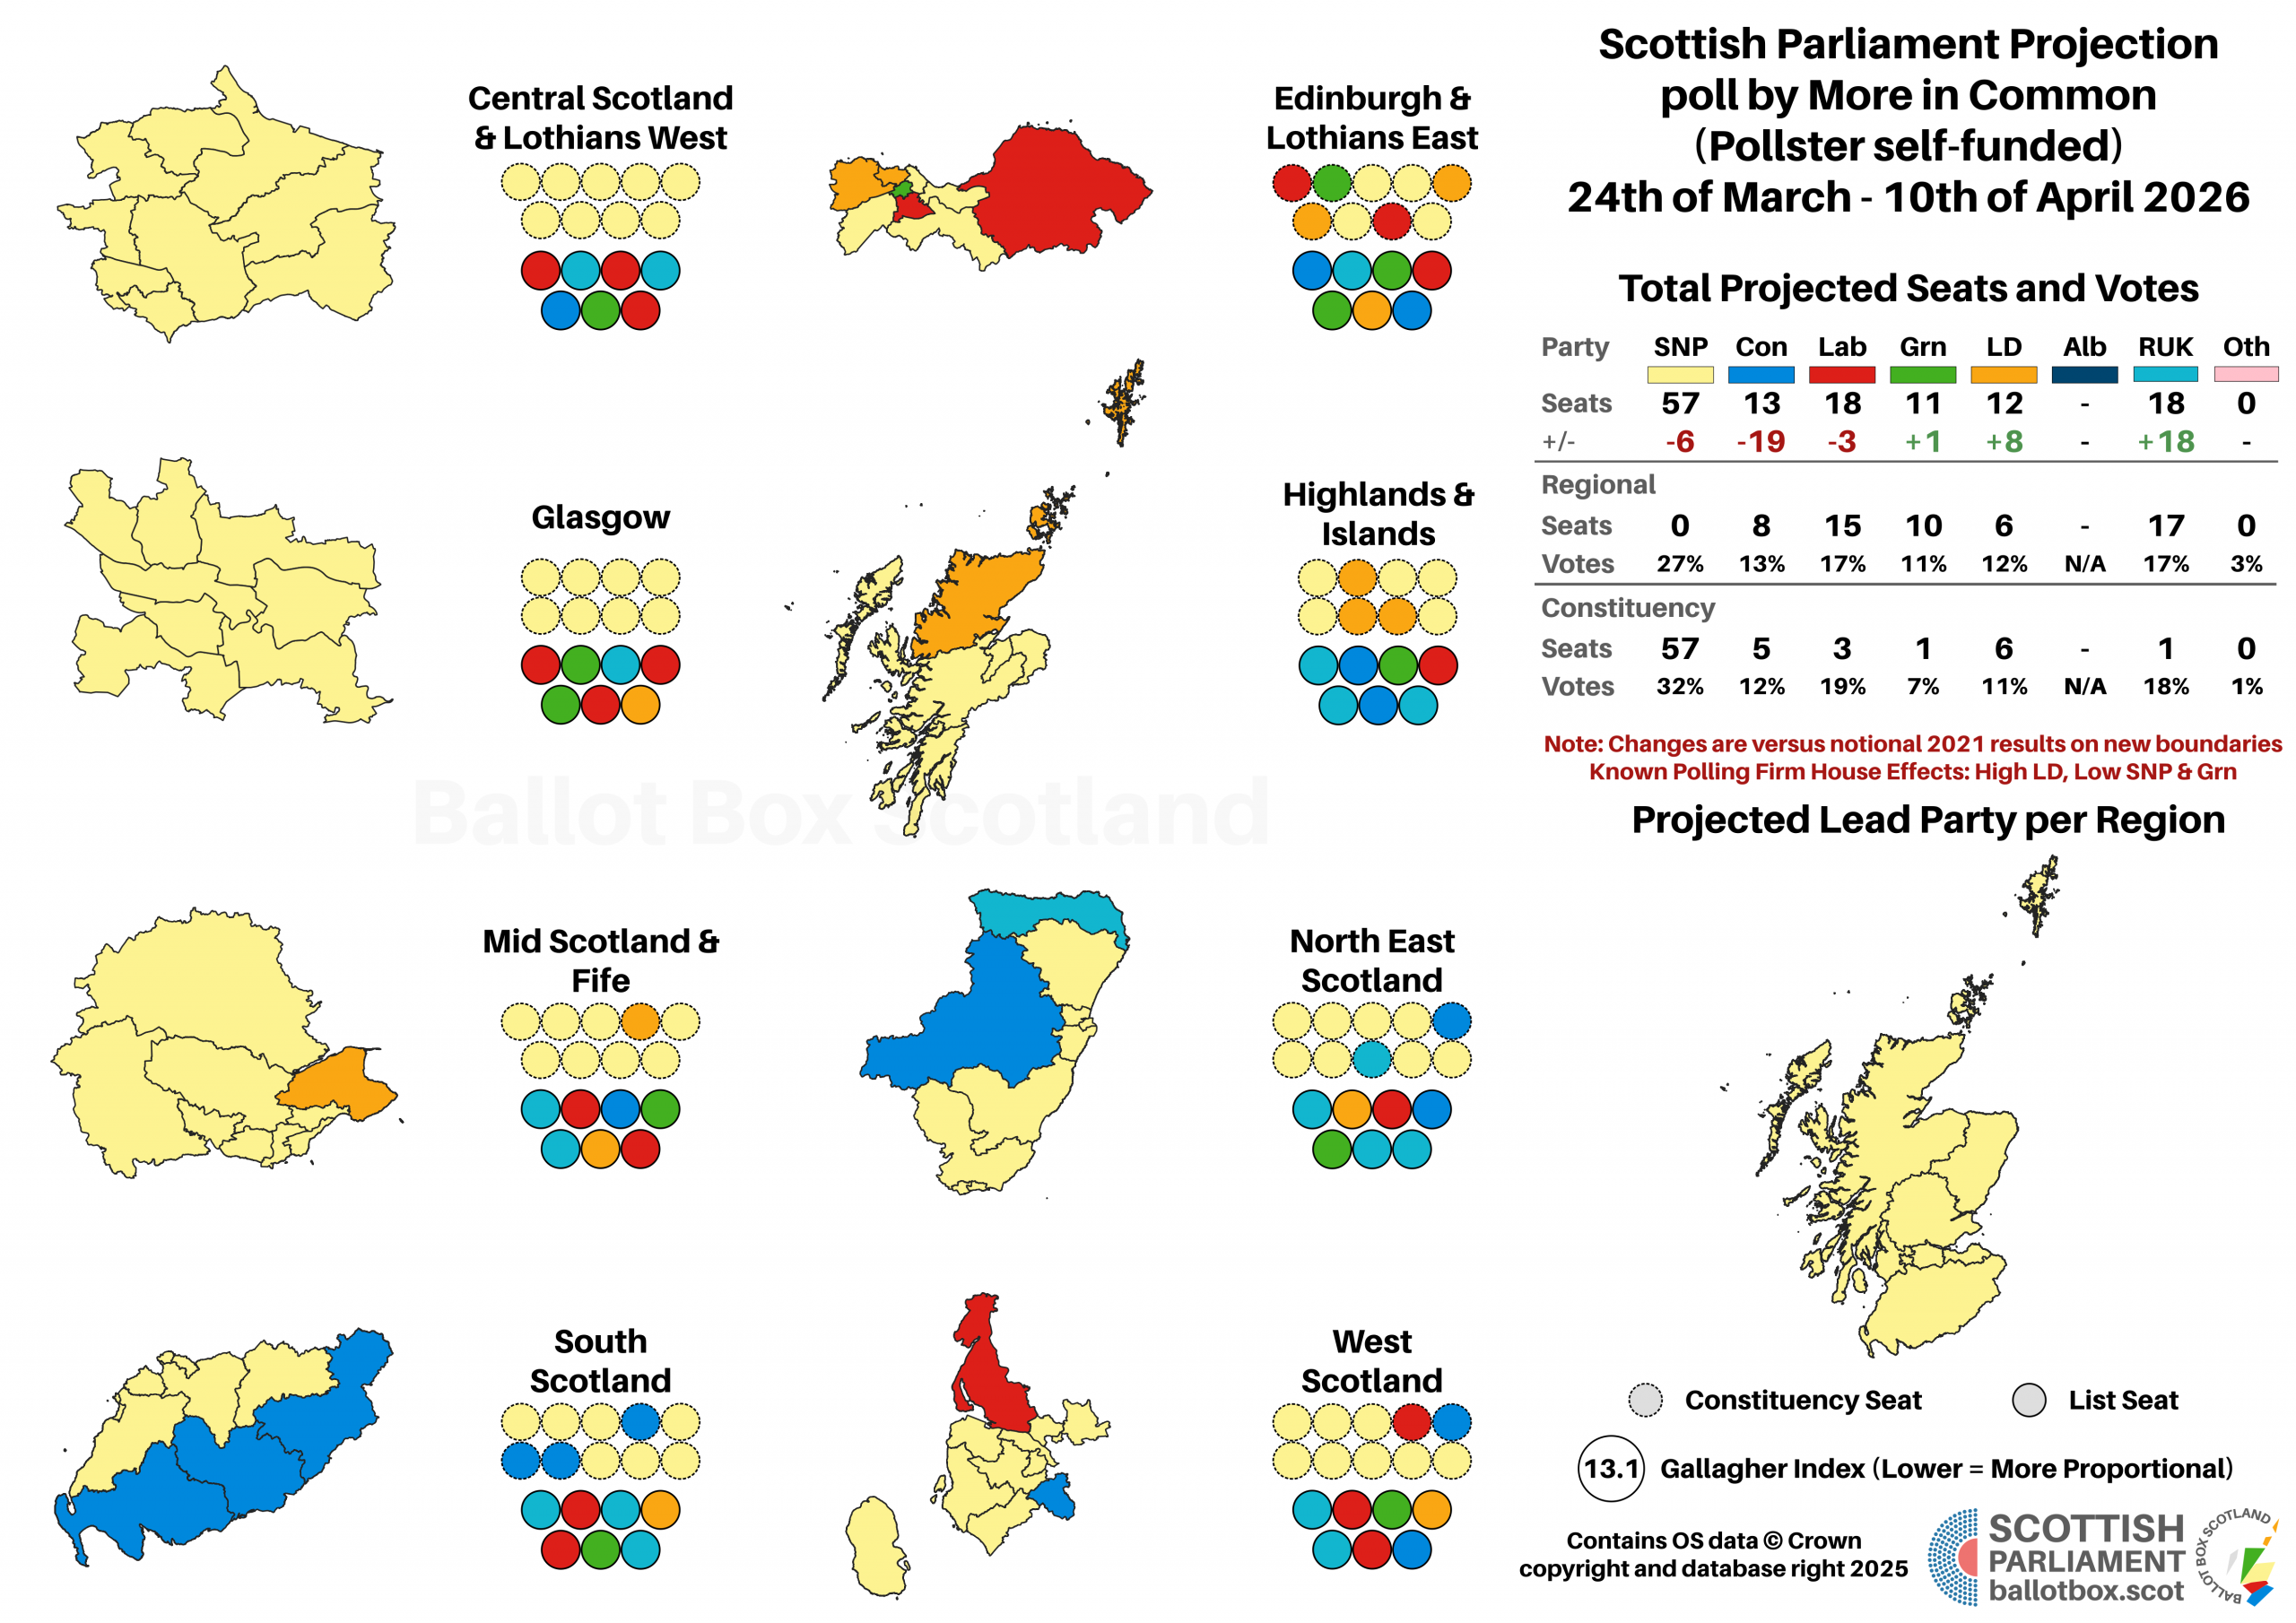
A weaker SNP position tips a good few constituencies in the direction of opposition parties and leaves them well adrift of a majority here. However, they’d still be able to achieve one with either the Greens (for a Pro-Independence bent) or the Lib Dems (for a more centrist approach to budgets). Abnormally weak as the SNP are in this poll, I have to say I feel that something more like this, albeit more towards 60 seats with Eastwood, Banffshire and Buchan Coast, and Galloway and West Dumfries in their column, feels a lot more realistic than recent MRPs suggesting a majority.
You may note that despite a flat Lib Dem vote they are the only other party bar the SNP to lose seats versus the last poll. That’s a simple consequence of every other non-SNP party making those tiny gains, which proportionally have to come from somewhere. Bear in mind though the fact this is likely an inflated Lib Dem share. For example as an actual Glaswegian, I can tell you categorically the Lib Dems will not win an MSP here: this is simply a feature of being at the peak of their polling plus the fact simple models cannot truly account for just how dead the party is here.
Possible Majorities
Note: these majorities relate simply to passing a vote in the Scottish Parliament. They do not imply the formation of a full coalition government.
- Traffic Light: Labour, Lib Dem and Green
- Independence Bloc: SNP, Green and Alba
- Grand Coalition: SNP and Labour
- Union Bloc: Labour, Conservative, Lib Dem and Reform UK
Hypotheticals
As ever, the last little bit of analysis concerns those hypothetical and more proportional voting systems that BBS likes to play about with. The use of pure FPTP at Westminster is an affront to democracy, and though Holyrood fares far better, AMS is still deeply imperfect. The examples here simply transpose the poll findings onto more proportional voting systems – the reality is that different systems would of course result in different voter behaviour.
If you find this or other Ballot Box Scotland output useful and/or interesting, and you can afford to do so, please consider donating to support my work. I love doing this, but it’s a one-man project and takes a lot of time and effort. All donations, no matter how small, are greatly appreciated and extremely helpful.
(About Donations)