Background
Let’s start this piece with an apology: it’s been a week and a half since this by-election. It is very unlike me to take quite so long to pull together an analysis piece. However, this by-election was on the 25th of April, which was the day Humza Yousaf ejected the Greens from Government, precipitating his own downfall as First Minister.
Politics obviously got very intense very quickly at that point, and I’m already just a little bit tired and needing some time to chill at the moment, so all of that took up a lot of my available political energy. Just to reassure any particularly kind readers who might worry, I’m not in a bad way or anything, nor do I feel I need a break for my mental health, it really is just being a little bit tired at the moment!
There was also a bit of a delay because Angus Council took a bit longer than I’m used to to publish the full dataset. This is their first by-election in some time though, and given I’ve been so knackered, I wasn’t in a rush to chase them for it either. Anyway, to the meat of this ballot!
The first Angus by-election since I started Ballot Box Scotland, for Arbroath West, Letham and Friockheim, was triggered by the resignation of Independent councillor David Fairweather. He’d served since 2007, and had been Council Leader for much of the preceding term. Rather oddly, it appears he had stood in 2022 with the intention of retiring mid-term; I will be frank and say I’m not sure what the point of not even getting two-fifths of the way through your term is, but we are where we are. In 2022 this ward had been relatively closely fought between the SNP and Conservatives, which in current circumstances meant I figured it was very likely to go Conservative.
Headline Results
Councillors and Key Stats
1 Councillor Elected: Conservative: Jack Cruickshanks
Change vs 2022 (notional): Conservative Gain from Independent
Change vs vacating: Conservative Gain from SNP
Turnout: 29.4% (-17.6)
Electorate: 13810
Valid: 4055 (98.9%)
Spoiled: 45 (1.1%)
Quota: 2006
3 Continuing Councillors:Conservative: Louise Nicol SNP: Serena CowdySNP: Martin Shepherd
Candidates
Conservative: Jack Cruickshanks Green: Mark Findlay
 Labour: Mark Hilton
 Lib Dem: Sandra O’SheaSNP: Kathleen Wolf
First Preferences
Note: Independent David Wren won 8.9%, Independent David Fairweather 8.1%, and Alba 1.3% in 2022.
First Preference History
I’m back to peak predictive form after a self-inflicted dismissing of a Highland Independent, with the Conservatives opening up a significant lead over the SNP, one that from past experience it would be nigh-on impossible to close. Whilst the Conservative vote share gain made it to double digits, remember that 17% of the vote in 2022 had gone to Independents. That means they had lots of votes up for grabs, as well as their usual benefitting from their voters being most likely to vote at all at a by-election, so don’t read too much into it. If we redistribute the 2022 non-returns, the swing looks more like +4.6%, positive but not huge contextually.
The flip side to that is that although the SNP’s loss of nearly 7% isn’t huge, and actually leaves them a bit above their worst share in the ward thus far, every previous election had Independents on the ballot drawing a significant chunk of the vote. That means this is a much worse result for the SNP than it might appear on the surface, amounting to a swing of -12% versus 2022 when recalculated for those non-returns.
Labour had a pretty good result here, with a significant swing both in absolute terms and relative to the re-calculated 2022 (up 7.2% in those terms). They should be very happy with that and, were it repeated at a full election, it’d be pretty much guaranteed to give them a councillor. It is however a useful reminder that even as Labour surge back into contention in the Central Belt, they simply aren’t going to be in the running in places like Angus. This kind of result, at a less pressured by-election, isn’t going to translate to a win in the new Arbroath and Broughty Ferry constituency, despite what I saw a particularly enthusiastic local Labour candidate think might happen after the Rutherglen by-election.
That leaves the Lib Dems and Greens, both of whom are up versus the absolute share in 2022. Although the Lib Dem increase is notably more than the Greens, in both cases it’s effectively neutral on the recalculated share; +0.8% versus -0.6% for the Greens. In by-election circumstances those aren’t particularly meaningful shifts, particularly for the Greens in a ward that wouldn’t be on their target list.
Transfers
Two-Candidate Preferred
A Conservative victory was a foregone conclusion given the size of their lead and likely transfer patterns, but the formalities of STV must be followed. Candidates dropped out in the order of their first preferences, with the Conservatives eventually coming just shy of accumulating a majority of the vote even before the SNP dropped out.
The most interesting thing here is that for both parties, this is a “better” performance than their first preference swings when accounting for 2022 non-returns, and for the SNP it’s better than their direct first preference losses. Again, that’s probably a consequence of there being no Independents on the ballot this time. We know most voters don’t go beyond a third preference, so reducing the number of candidates they have to pick between means they are more likely to end up preferencing one of the top-two candidates.
Detailed Results

Results by Polling District
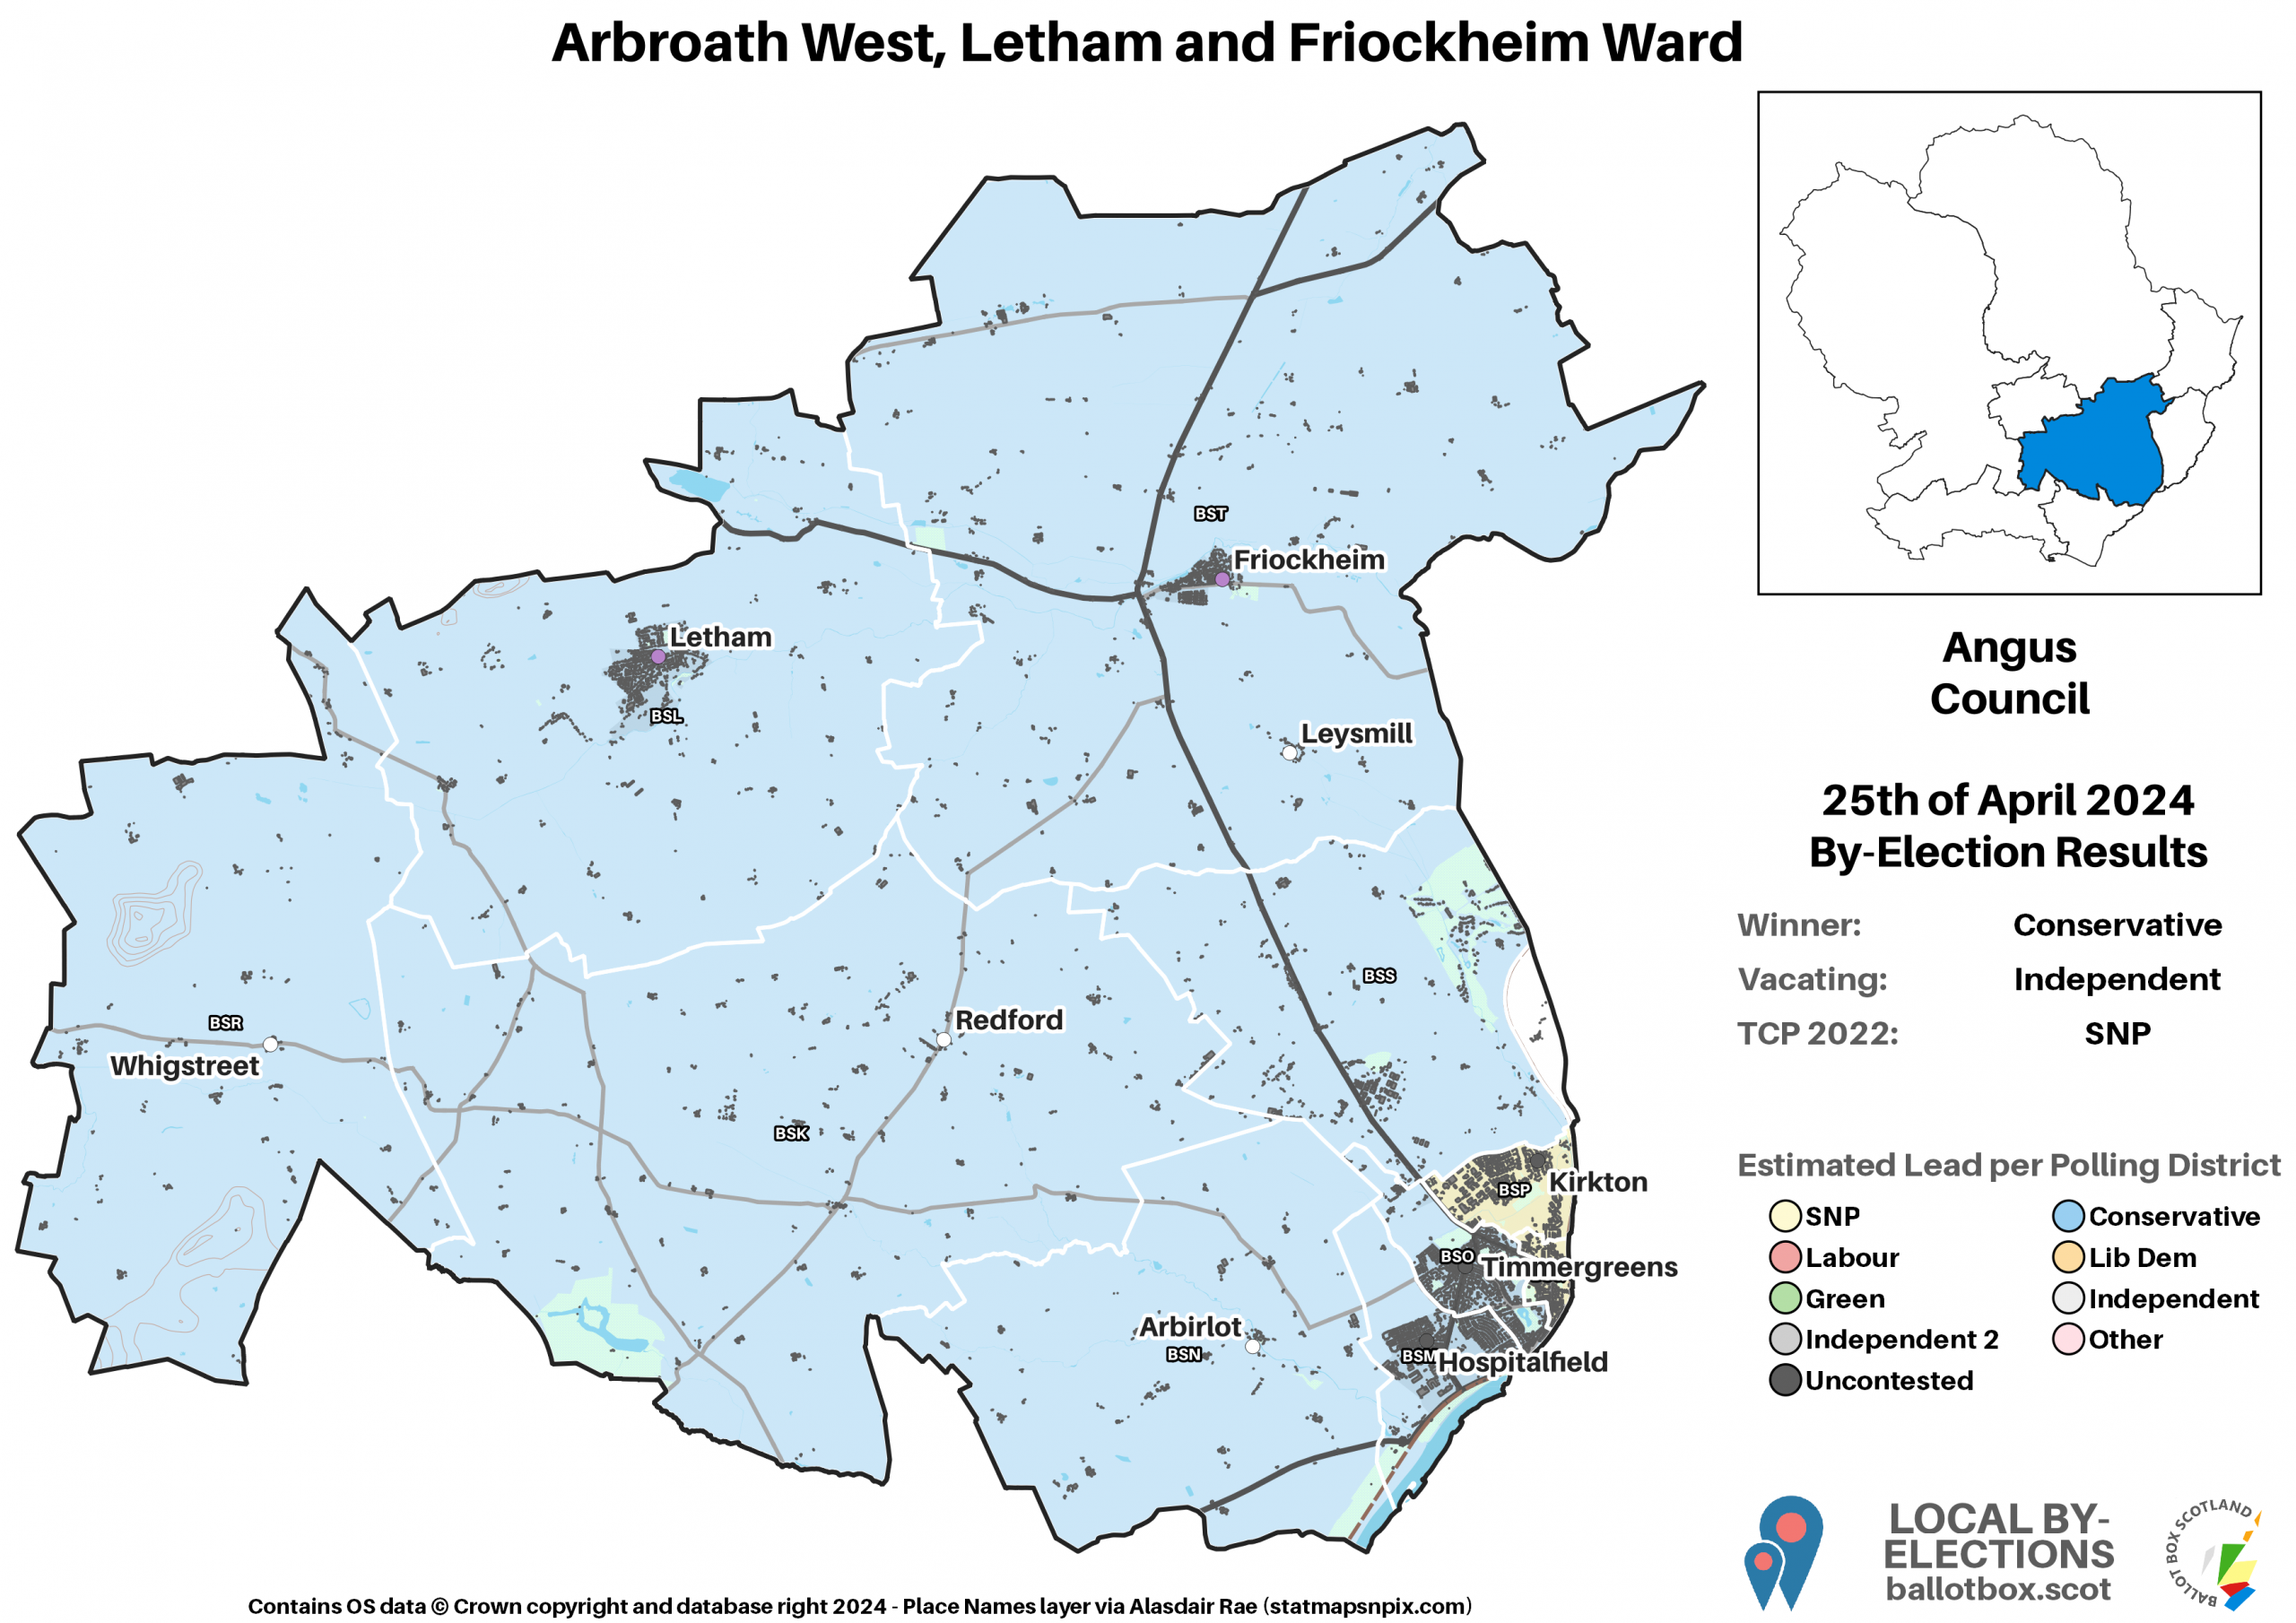
Relative to some other councils I’ve had to query in the past, some beautiful box merging work from Angus Council here, keeping all mergers tightly contained within districts without cross-mixing between any multi-box districts. However, unfortunately no map accompanying this due to changes to polling district boundaries. As Westminster constituencies have changed, councils have updated many of their districts, and I couldn’t find an up-to-date version of the district maps on the website. I’ve asked and hopefully they’ll get back to me, but until then, we only have the chart and then the location of each district’s polling place.
The Conservatives had their best result, winning just over a majority of the vote in Hospitalfield in the south west of Arbroath. They also led in all but two districts. The SNP were the leaders in those districts which covered the Kirkton area in the north of the town and an area west of the town centre, the latter being their strongest share overall, whilst the former was Labour’s peak vote.
The Lib Dems meanwhile had their best result in the districts covering Letham and the large rural expanse around it and Carmylie, and for the Greens it was the rural expanse centred on Friockheim and including Colliston. That’s actually a satisfyingly neat distribution of “best bits”, as it means every part of the ward name had somebody excelling there.
Second Preferences
For second preferences, it’s largely the usual, but there are interesting little currents underneath the headlines. The Conservatives were almost evenly split between the other Pro-Union parties, very narrowly favouring the Lib Dems, whilst they and Labour very clearly preferred one another. Angus may be an SNP-Conservative battleground but this is a major town, and even Lib Dem voters were less willing to second preference the Conservatives than you might see in more rural parts of Angus.
The SNP and Greens also had their usual mutual preference flows, but there might be just a hint of their voter bases peeling away from the other at the moment, perhaps appropriately given the day of the by-election. Green to SNP transfers are down about 7% overall, but that’s despite nearly 18% of their 2022 voters going for Independents, plus a paltry 1.4% to Alba, that weren’t available this time. For the SNP, their direct transfer rate to the Greens was about the same as 2022, but again that’s even though about 15% of their votes then transferred to Independents and 8% to Alba.
This is just one by-election, on a particularly intense day (albeit only just over half of votes were cast in-person on the day), so I would encourage people not to read too much into that just now. That’s especially true given young people, who tend to be the biggest support base for both the SNP and Greens, are least likely to turn out at by-elections. However, if this did become a sustained pattern, it might give both parties cause to worry about their councillor numbers in 2027.
That brings us to the end of this very delayed analysis piece; as I said earlier, if Angus get back to me with their new polling district boundaries, I may be able to make a map to visualise that outcome. This may otherwise become a bit of a pattern, depending on how much councils have rejigged their districts, where I might not be able to map district results where boundary changes have taken place.
This week’s Kilwinning by-election is not one of those places, as Ayrshire avoided Westminster boundary changes entirely. Don’t worry though, as there’s plenty of proposed Scottish Parliament boundary change discussion I’ve yet to get to, but will need to do so this week as there is now less than a fortnight to respond to the consultation.
If you find this or other Ballot Box Scotland output useful and/or interesting, and you can afford to do so, please consider donating to support my work. I love doing this, but it’s a one-man project and takes a lot of time and effort. All donations, no matter how small, are greatly appreciated and extremely helpful.
(About Donations)