Following a very strange mid-pandemic campaign – with very little in-person activity possible, Scotland has a new parliament. For the first time since Devolution, it’s a parliament which in terms of partisan spreads looks almost identical to what came before. It is, however, a much more diverse parliament when looking at the individuals elected. There are more women MSPs than ever before, including the first women of colour elected to Holyrood, and more disabled MSPs. Alongside the record turnout, that makes this an extremely positive election regardless of what partisan affiliations anyone may have.
There are always a million and one things to look into with any election, and I’ll do a lot of that over the next little while, in addition to slowly compiling each region’s results on the relevant page for easy access going forward. First though, it’s worth going over all the headlines from the 2021 election.
Overall Results
Total Seats
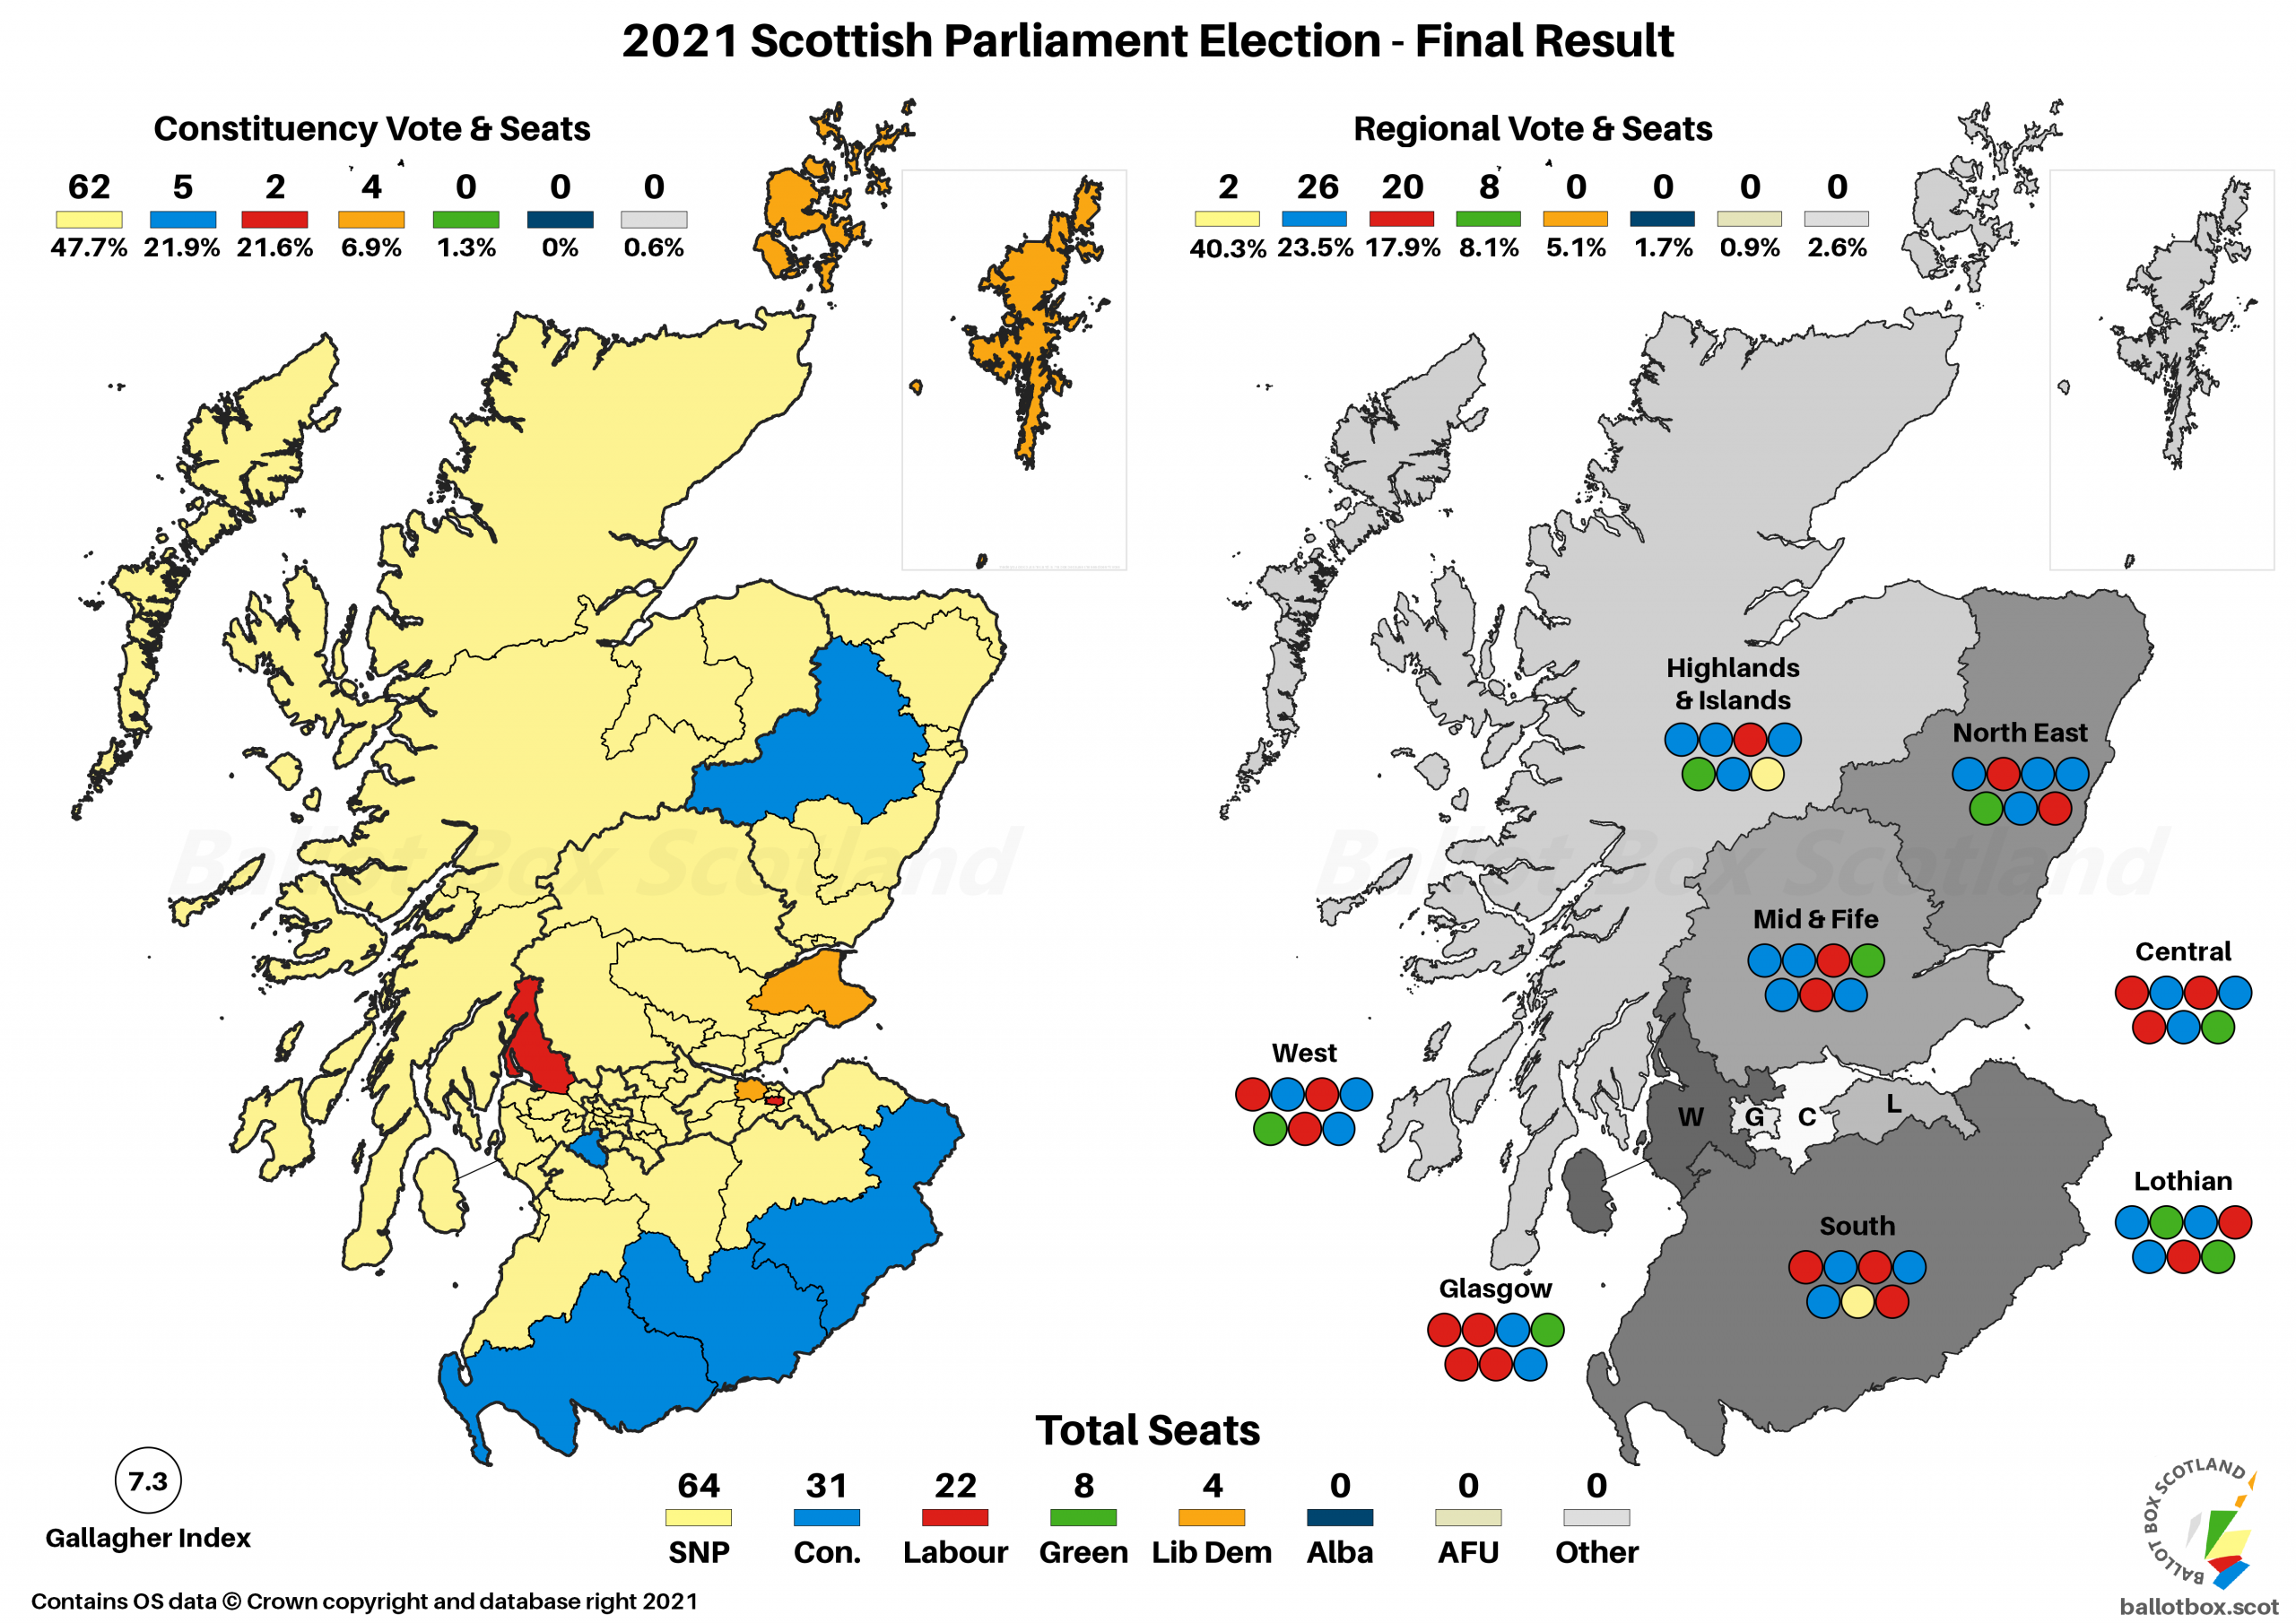
The big question in this campaign was whether the SNP would win an outright majority, repeating their shock 2011 result, or continue on as a minority. In the end, voters elected another SNP minority, with their 64 (+1) seats falling just one short of the magic number. Though it seemed likely the Conservatives would experience moderate losses, they actually emerged with 31 (nc) seats, the exact same as in 2016.
Although Labour hit another historic low with 22 (-2) seats, that was far less painful for them than most polling was suggesting. They’ve lost seats at every Holyrood election, but this is the smallest decrease yet. Cementing their position as fourth party, the Greens had their best ever result winning a total of 8 (+2) seats. Finally, the Lib Dems joined Labour in the worst ever result camp, with just 4 (-1) seats.
Regional Vote
Yes, I know everyone hates me consistently putting this vote first, but it’s the one that parliament is meant to be proportional to! Modest changes here are a large part of why the seat changes are so minimal. The SNP remained clearly out in front with 40.3% (-1.4) of the vote, whilst the Conservatives consolidated their second place with 23.5% (+0.6). Despite some media narratives of a “battle” for that position rooted in one agency’s polling there was no real competition for it, as Labour slipped further behind on 17.9% (-1.2%).
That means that of the five Holyrood parties, the Greens recorded the biggest change in their vote share when they received 8.1% (+1.5) of votes cast. Meanwhile, the Lib Dems were down only very slightly on 2016 at 5.1% (-0.2) but as we’ll see, the distribution of that vote was key.
On their first outing, Alba did very poorly, underperforming versus all poll bar one with 1.7% of the vote. Their pro-Union counterparts All for Unity didn’t reach a whole number, achieving just 0.9%. The remaining 2.6% was spread across the 17 other parties and 12 Independent candidates.
Constituency Vote
Over on the constituency vote, the SNP increased their share here despite a decreasing List vote for the second election in a row, with 47.7% (+1.2) of the vote. Though the Conservatives were down a tiny bit at 21.9% (-0.1), Labour’s larger dip to 21.6% (-1.0) means the Conservatives now place second by every Holyrood metric.
The Lib Dem’s drop to 6.9% (-0.9) isn’t quite as heavy as Labour’s, but is proportionally much worse for them. Having only stood in 3 constituencies in 2016, the fact they were present in 12 this time naturally led to an increase in the Green vote here to 1.3% (+0.7). Just 0.6% of the vote went to the 38 candidates from 11 parties, and the 15 independent candidates, contesting constituencies.
Final Outcome
Put that all together, and this is what the new political map of Scotland looks like. This is a slightly less proportional result than the last election, with the Gallagher Index increasing from 5.8 to 7.3. This is a measure of disproportionality, with results being more proportional the closer to 0 they are.

Compared to my final projection post, which didn’t specify a particular predicted number for any party, there were almost no results I didn’t foresee – almost. We’ll get into those where they arise when we take a look through each party’s results in turn.
Party Analysis
SNP
In that final projection, I’d expressed my scepticism that there would end up being the whopping 11% between the SNP’s two votes that polling averages were suggesting, and thought there’d instead be a narrowing from both ends. That proved to be the case as a slightly lower constituency vote but notably higher list vote than in polling resulted in a gap of 7.4%.
That narrower gap proved essential to the SNP’s net gain in seats. Although they got the last seat in Highlands & Islands, that was actually somewhat more secure than their 6th seat in South, where the last two list seats were hotly contested by the SNP, Labour and Greens. Had their vote slipped further they’d have lost that seat, and remained on 63 overall. It’s possible that voters in those regions were aware of their relative importance, as H&I was the only region where the SNP’s list vote increased, and South was the second smallest decrease.
From what is evident at this point of still relatively shallow analysis, that the SNP failed to pick up some key constituencies is what put the nail in the majority coffin. Though they gained three overall, none of them actually made a difference to their total number of seats. Most obviously, both Ayr and East Lothian are in the South Scotland region, so they just traded in two list seats for those.
Even Edinburgh Central ended up not being a net gain, as this time around they were proportionally entitled to 7 Lothian seats, so had the Conservatives held it there’d just have been a list seat shuffle. Instead, the SNP would have had to have gained any of Aberdeenshire West, Dumbarton, Eastwood, Edinburgh Southern, Edinburgh Western, or North East Fife to make up the difference.
SNP success in South constituencies had an unfortunate effect for two of their sitting list MSPs. Joan McAlpine and Paul Wheelhouse, second and third on the list, were not eligible for re-election this time. Both were first elected in 2011, and Wheelhouse had served as a junior minister for the past three years.
Overall, the SNP’s vote seems to have continued a general redistribution away from the North East that started in 2016, with that being the region their vote share decreased the most. However, relative to one another, their ranking of regions by vote share is almost as it was last time. The only change is Highlands & Islands displacing Mid Scotland & Fife for 5th place.
Conservatives
If the theme of this election was relatively little change, then the Conservatives were the embodiment of that, winning precisely as many MSPs as they did in 2016, and having very little national change in vote share. There were however some small shuffles, as they lost the Ayr and Edinburgh Central constituencies to the SNP. As with the SNP, neither of these had any net effect on the party’s number of seats, though only Ayr was fully compensated for by a list seat. To make up for their net loss in Lothian, they gained a fourth seat in Highlands & Islands.
That reflected quite substantial movement in vote shares below the national level. The Conservatives made pretty big gains not just in H&I, but also the North East and Central regions, but dropped a substantial amount in Lothian, causing it to drop from their fourth to sixth ranked region. That’s why they had a net loss of seats in Lothian, and didn’t make up for losing Edinburgh Central with an additional list seat.
Across their other constituencies, the Conservative vote share mostly increased, and they saw continued advances in the North East that put them within a few hundred votes of taking the formerly solid SNP seat of Banffshire and Buchan Coast, and brought Aberdeenshire East into marginal territory. Rather than reflecting new growth however, this is probably bringing their Holyrood vote more in line with the Westminster results in 2017 and 2019.
In other marginals where they were in contention, the gap between them and the SNP mostly widened. Most notably they didn’t pick up the Perthshire South and Kinross-shire seat that may have been vulnerable given the retirement of SNP stalwart Roseanna Cunninghame. That’ll probably be much harder for them to gain at the next election as a result.
Some changes too to their MSP group, most notably losing John Scott who had been their MSP for Ayr since 2000. He wasn’t on the regional list at all, so losing his constituency means the party have lost their longest serving MSP. Gordon Lindhurst was also placed too far down the Lothian list for re-election that way, and didn’t take the Edinburgh Pentlands constituency. Finally, Maurice Corry had been sunk to 8th on the West list so the result simply formalised his departure from Holyrood.
Labour
Formerly Scotland’s hegemonic political force, it speaks to how far Labour have fallen that there is broad agreement (myself included!) that their worst ever result at Holyrood represents a relative success. The party had feared much greater losses, which partly motived both attempts to remove and then the final resignation of Richard Leonard from the leadership. New leader Anas Sarwar wasn’t able to convert his personal popularity into gains for Labour, but he does seem to have steadied the ship.
Having lost East Lothian to the SNP, Labour have also been reduced to their smallest share of constituency seats with just two – though that exceeds their Westminster total. In those two seats however their vote share increased substantially, with Jackie Baillie continuing to be a remarkable political survivor, holding the most marginal seat in Scotland.
As East Lothian just traded for a list seat, what actually caused the decrease in the party’s total were losses in Central and Highlands & Islands. I have to admit to being very surprised by the former, as I had reckoned all four regional seats secure in my final projection – I hadn’t anticipated the Conservatives growing their vote share in Central, and the Green gain coming at Labour’s expense. In H&I the party dropped into single-digit vote share, and it becomes the first region to have anything less than two Labour MSPs in Holyrood’s history.
In terms of the distribution of their vote, Glasgow bucked the national trend of decreases by going up by half a point. That also led to it overtaking Central as their strongest region by vote share. Their worst decreases came in Mid & Fife and South, but neither of those were severe enough to cause a lost seat, and relative rankings of regions are otherwise unchanged.
For a pair of last term’s Labour MSPs it wasn’t the party’s losses that mean they haven’t returned to Holyrood, but instead being ranked too low to return. I didn’t expect either Glasgow’s James Kelly (5th) or South’s Claudia Beamish (4th) to return to Holyrood, and that proved to be the case. However, both are first in line for any vacancy, giving them the prospect of a Sarah Boyack-style return later in the term.
Greens
As has been their habit, the Greens underperformed their polling, but nonetheless improved on their 2016 result – indeed, they were the party with the most growth in this election. In addition to holding all 6 of the seats they won last time, they gained a seat in the North East, and elected their first ever MSP for Central Scotland. In terms of both votes received and seats won, this was their best ever Holyrood result, topping their haul of around 7% and 7 seats in 2003’s Rainbow Parliament. With Lorna Slater having won a seat in Lothian, this becomes the first time since that parliament both Green Co-Leaders (formerly Co-Conveners) have been MSPs.
Though the Greens achieved a record result, they were extremely close to simply matching their 2003 seat share, or to having 10 seats in total. In Central Scotland, they won the last seat by just 107 votes. In South, they missed out by only 115 votes, and in so doing failed to capture the Green MSP in every region they had hoped for. And in Glasgow, they were short 914 votes of a second seat.
Despite falling short of that second seat, Green growth in Glasgow continued to outstrip other regions, bringing it to within less than 1% behind Lothian, their historic best area. Mid Scotland and Fife also evidenced strong growth, overtaking Highlands & Islands to become the party’s third best region.
This election was also a major test of Green support in constituencies. They stood in a total of 12, many more than they’d stood in every previous election put together, albeit still a small minority. They failed to secure the Glasgow Kelvin constituency, but across the 12 achieved about 7.8% of the vote, versus 10.3% of the list vote in those same constituencies. That’s a ratio not dissimilar (though the opposite way about) to the Lib Dems’ two votes.
At the risk of inflating an already long post, it’s worth noting that that the marginal nature of some of their results appear to have come about from a Literal Democrat situation. A micro party by the name of Independent Green Voice – run by an alleged holocaust denier with very little to do with Green politics – was on the ballot in most regions, complete with a shiny new logo approved the week before nominations with the word “Green” in big bold letters. This party had no manifesto, it put no materials through voters doors, it ran no adverts – it was invisible.
And yet, it achieved around about 0.5% in each region it stood. That was more than Reform UK and UKIP, and in some regions more than the Family Party, all of whom actually did campaign, did put materials through doors, and did actually exist in some genuine sense. In Central they achieved 1854 votes, Glasgow 2210 votes, and South 1690 – remember that in South, Reform UK were standing a sitting MSP, and got just 779 votes! It can’t be any clearer that voters were confused by this party and voted for it in error, and that in so doing caused the Greens to miss out on two seats – though there’s nothing that can be done now, and it’s not the fault of the candidates elected instead.
This episode highlights two democratic points I’ve often made here on Ballot Box Scotland. The first is the fundamental nonsense of deposits as a means of ballot access. Far be it from preventing fringe candidates from contesting election, it has allowed a fringe group with no genuine support to appear on the ballot and sow confusion – and the Electoral Commission has questions to answer on that front too. The second is that whilst all PR systems are capable of producing fine margins, usually that’s the difference between one seat (or crossing a seat threshold) – not between three! As we move onto our final Holyrood party, we’ll have another example of the latter problem.
Liberal Democrats
Remaining Holyrood’s smallest party, the Lib Dems’ experience in this election looked very different depending on the day of the count. On Friday, they held all four of their constituencies, being the only opposition party to do so. Three of those were by substantial amounts, including huge gains in Edinburgh Western and North East Fife, whilst Shetland became a true marginal for the first time. As in 2016, that may have looked like a good result.
However, on Saturday, regional results trickling in made it clear they were not only going to fail to gain seats in South and West, but were actually going to lose their North East Seat, another eventuality I simply hadn’t thought likely in my final projection. This was driven by the loss of votes in the Aberdeenshire East and West seats, where dropping below 10% proved fatal to their chances. That left the party with their worst ever Holyrood result, such that they no longer qualify as a formal group in Parliament – though I do wonder if rules may be changed accordingly.
Effectively, the Lib Dems have continued to do exactly what I mentioned in their profile post – pile on votes in key constituencies, but fail to expand elsewhere. That’s great for First Past the Post, and terrible for AMS. Indeed, they further increased their number of lost constituency deposits from 48 in 2016 to 50 this time. They did increase their vote share substantially in Lothian, but it was offset by losses in Highlands & Islands and North East.
Overall though their list vote share was almost static. As with the Greens, there’s a certain degree to which the Lib Dems have been punished for not having support in the right places, rather than for not having support at all. They were already underrepresented by two seats in the last parliament, and that now increases to three. We’re also certainly at a point where the party would probably do worse under STV than they do with AMS, meaning their favoured electoral reform would be even less fair to them!
Alba and Others
There’s no disguising that this election was a dreadful debut for Alba. I’d said I thought their polling might be an overestimate, just like the Greens, and I was proven correct. They won just over half of what their polling average was, and far below what Panelbase had been quite wildly expecting. Even in the North East, their best region, they only scraped 2.3% of the vote, far below what Salmond needed to re-start his political career. After huge media interest, they won a smaller share than UKIP managed in 2016.
It was a similar story for the pro-Union version, George Galloway’s All for Unity, which won just over half as many votes as Alba. Their best result was 1.5% in the South, again a million miles away from what they needed to win a seat.
In the Highlands and Islands, Green-turned-Independent MSP for the Lothians Andy Wightman failed in his re-election bid. He was the best performing Independent in the country with 1.4%, but that was far, far short of what he needed. It did however perhaps contribute to the Greens relative underperformance in that region, it being the only area they lost list vote share in any constituency, plus two of the three where their share was unchanged.
Finally, Conservative-turned-Independent-turned-Reform UK Scotland Leader Michelle Ballantyne also failed in her re-election bid. Reform UK did abysmally, winning just 0.2% of the vote in her South region and nationally, barely ahead of the rump UKIP who won 0.1% of the national vote.
Phew! That’s us for the headline results coming out of this election. Over the next few days and weeks I’ll be looking in more detail at how votes shifted across the country for each party, what the new marginal seats are, and my usual dive into more proportional voting systems.
If you find this or other Ballot Box Scotland output useful and/or interesting, and you can afford to do so, please consider donating to support my work. I love doing this, but it’s a one-man project and takes a lot of time and effort. All donations, no matter how small, are greatly appreciated and extremely helpful.
(About Donations)