2023 in Review: Council By-Elections

2023’s Annual Reviews are slightly later than the past couple of years, falling in the hazy lull in between Christmas and New Year, after I got burned with late poll releases both years. However unless someone is holding back a poll for Hogmanay or Ne’er Day, we’ve had our polls for the year. That said, you just know that if I had published before Christmas, that would have triggered a poll under Sod’s Law. Before we get to those however, we’ll start with a quick run through the council by-elections over the year. This is the first full year of the term, given we had the full elections in May last year. 

By-Election Caveats

As ever, before we really start talking about by-elections, we need to get a range of caveats out of the way first. Regardless of the number and spread of by-elections, remember they always make up just a small fraction of Scotland’s 355 wards. That alone means these figures aren’t representative of the whole country.

Also important for many by-elections, especially in the more rural wards, is the absence of popular independent councillors. Councillors that continue to serve or who have sadly passed away obviously don’t appear on the ballot for by-elections, and so that can limit the usefulness of direct comparisons with May 2022 in their wards.

Finally, remember the most important aspect of STV – that the nice simple language used for FPTP of “gain/loss/hold” isn’t as applicable here. Whoever vacated one of three or four seats is not always the same as the overall winner at the last election. It’s entirely possible for the vacating party, the party that had a first preference lead, and the party that would have won a single seat election in May 2022 to all be different!

Seat Shifts

As usual, let’s start with how changes in seats, with all the complexity that involves under STV. The table below shows each of this year’s by elections with both the vacating party and 2022’s notional winner shown, alongside the eventual winner of the by-election. You can click the ward name to see the result analysis for each by-election.

And translating that table into a simpler chart format:

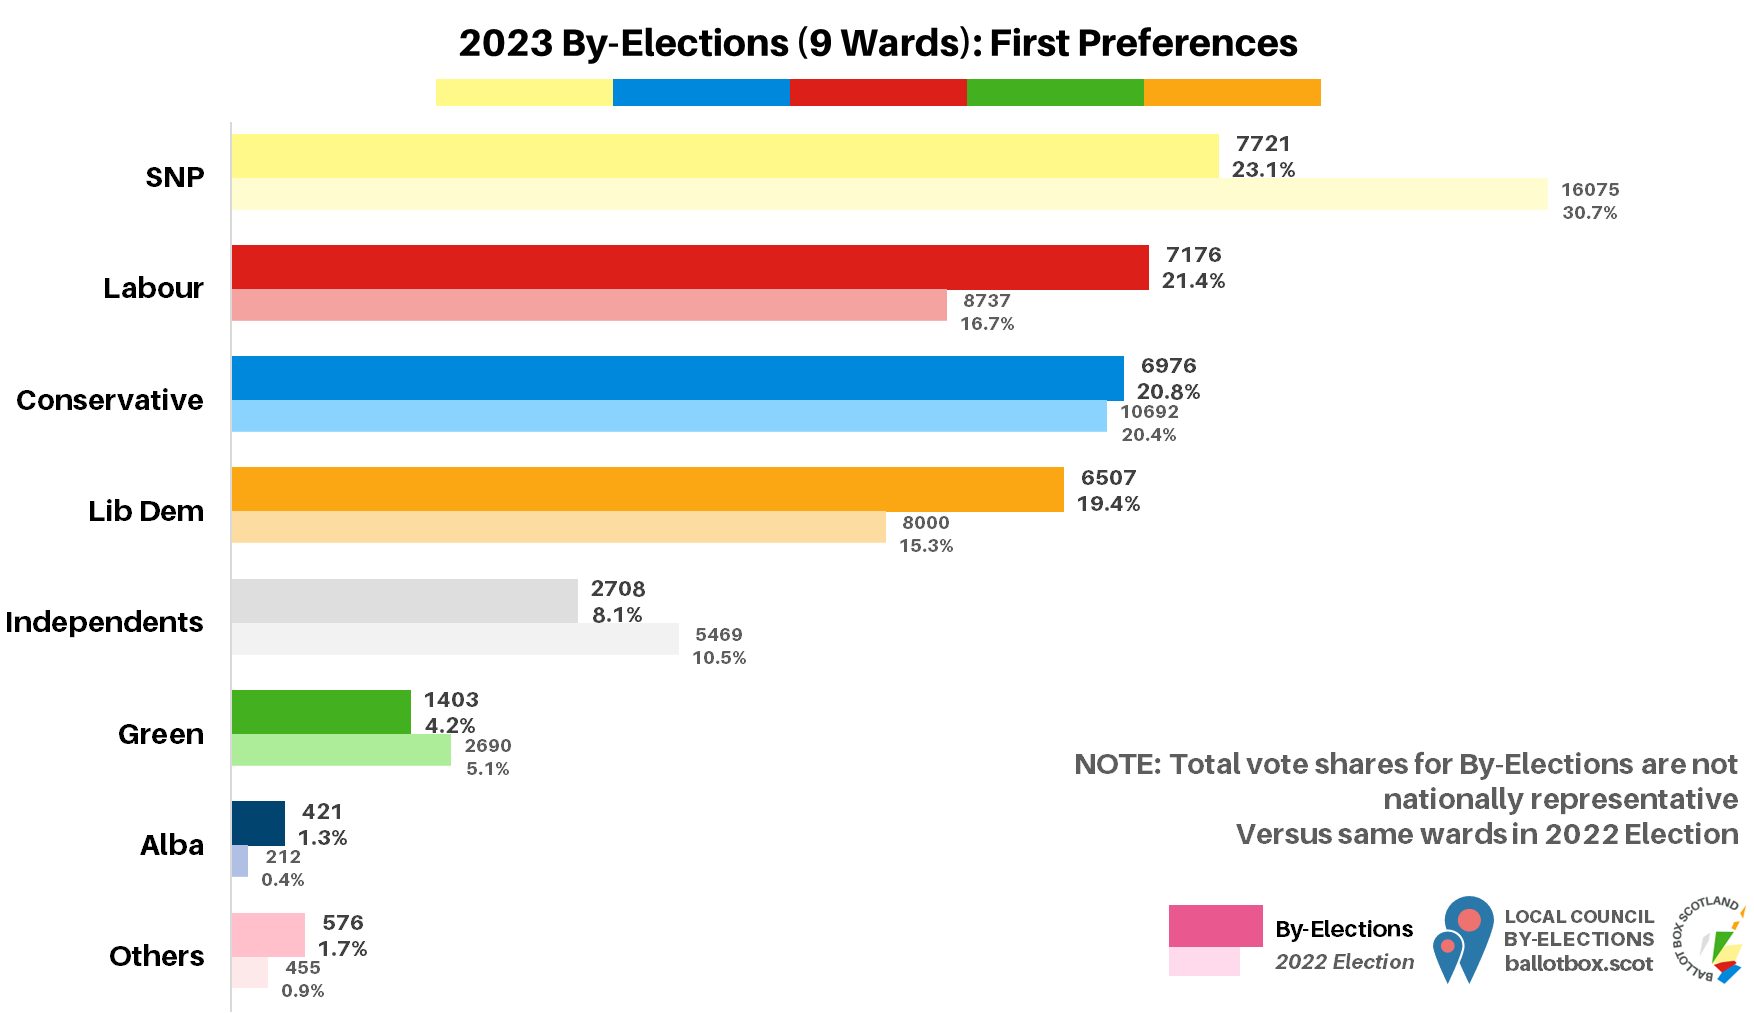
Visualising it this way really demonstrates the importance of being aware of how STV works. Whereas it was SNP councillors who created the vacancies for two-thirds of these votes, only a third of them took place in wards where the SNP had been the overall winner in 2022. Similarly, despite the fact that Labour didn’t cause any vacancies, they were actually the 2022 victor in two of the wards, which was important context for those two summertime ballots in Lanarkshire.

If we look first specifically at the comparison with seats vacated, which is more impactful for political control but less reflective of voter change (note Independents use slightly different terminology as they aren’t directly comparable to one another):

🔴Labour: Gained 4 (net +4)
⚪Independent: Vacated 1, won 2 (net +1)
🔵Conservative: Vacated 1, lost 1, gained 2 (net +1)
🟠Lib Dem: Vacated 1, held 1 (net nc)
🟡SNP: Vacated 6, lost 6 (net -6)

By this measure, there were a lot of gains at the SNP’s expense. Labour especially look to have had a great year, picking up four councillors they hadn’t previously had. If we instead do the more electorally relevant comparison with the May 2022 single-seat winner:

🔴Labour: Defending 2, held 2, gained 2 (net +2)
🔵Conservative: Gained 2 (net +2)
🟠Lib Dem: Defending 1, held 1 (net nc)
⚪Independent: Previously won 3, won 2 (net -1)
🟡SNP: Defending 3, lost 3  (net -3)

This looks a little less bad for the SNP, as whilst they still didn’t win any seats, their net loss is only half as big. It also looks a little worse for Independents as they end up with fewer overall wins than in 2022, though obviously you can’t really compare in those cases where a popular councillor wasn’t on the ballot by virtue of continuing to be a councillor. Labour’s figures are correspondingly less dramatic, considering that two of their new councillors came from wards they’d been the 2022 single candidate winners in anyway.

Interestingly, this is the first year since 2013 (from what I can make out through LEAP) where the SNP have failed to win a single by-election. Whilst I don’t have comprehensive data from the 2012 elections, from a quick scan of the wards that had 2013 by-elections I reckon only one of them would have been an SNP overall victory the previous year. In that sense, 2023 is a worse year for the SNP, as they had three genuine defences that they fell short in.

First Preference Votes

First Preferences across all 9 By-Elections

As if to emphasise how you can’t take a random collection of by-elections and take them as being nationally representative, across this year’s ballots there isn’t even a full 4% between the first and fourth placed party. Swings relative to 2022 also show that across these wards the Conservatives had been second at the full election, though of course Labour had been second nationwide, and the Lib Dem starting position was about twice as high as their overall vote.

Indeed, take special care with that Lib Dem figure. It is significantly inflated by the Corstorphine and Murrayfield by-election, which accounts for roughly a quarter of the total votes cast in by-elections this year, but a whopping 70% of the Lib Dem vote. That doesn’t detract from a relatively positive year overall, as out of the five other by-elections in wards they’d contested in 2022, they grew their vote share in four of them.

Whilst the topline vote figures are an interesting curiosity and nothing more, the swings are much more useful and tell a clear story. It shouldn’t be any surprise given how chaotic the year was for them in so many different ways that SNP support was down significantly. The only by-elections where their vote share increased were because the Greens collapsed in one and a popular Independent councillor wasn’t on the ballot in the other. Overall, it was a very bruising year to be an SNP candidate in a by-election.

Labour meanwhile experienced decent growth in their share, mirroring their upwards trend in national polling. In a reversal of the SNP’s struggles, Labour increased their vote share in all but two of the year’s by-elections – one because they hadn’t contested it at either vote, and the other because of complete Lib Dem dominance. That’ll be just as welcome, if not more, than having won a handful of new councillors, and bodes well for their prospects at the upcoming UK General Election.

The Conservative experience was much more mixed, with an effectively static share relying entirely on a significant positive swing in the same Girvan and South Carrick ward where an absent Independent had allowed for SNP growth. They only increased their vote share in two other by-elections, with the remaining six being often quite sharp declines. That fits both with general polling trends in Scotland, and the phenomenon I’ve described multiple times of voters opposed to the SNP concentrating behind the party most likely to beat them in a given local area.

The Greens joined their partners in government in having quite a poor year for by-elections. A little bit of that comes down to the combination of the fact that by-elections typically have lower turnout amongst the types of voters who support the Greens and the fact that only two of the by-elections were in wards the Greens have an active campaigning history in. However, one of those was Dunblane and Bridge of Allan where they’ve won a councillor in at the past three full elections. Yet their support there cratered to a mere 0.1% above their worst prior result in 2007, that alone contributing to most of the negative swing.

First Preferences across 7 By-Elections with Holyrood 5

If we take out the two by-elections without a full Holyrood 5 slate (South Kintyre missing both Labour and the Greens, Girvan and South Carrick only the latter), Labour actually pip the SNP into first place by five (5!) votes, whilst the Conservatives fall behind the Lib Dems. Again, that’s more about the wards that make up this selection than an accurate reflection of Scotland as a whole.

Of the by-elections in this pool, all but one come under my “City”, “Town” or “Urbanised” categorisations, i.e. the kind of places where Labour generally do quite well, with only one “Semi-Rural” ward where the party largely don’t exist. Important as they are to bear in mind, none of these caveats alter the fact that 2023 has not been a great year for the SNP, as we’ll see when we get onto the Parliamentary Polling side of this year’s review.

Looking Ahead to 2024

2024 already has three by-elections lined up, two due to resignations and one much more sadly due to the death of sitting councillor. Given two of these are in wards the Conservatives handily won the previous vote and one is a Glasgow ward where it was in fact the Greens that came out on top in 2022, expect the SNP’s losing streak to continue.

The remaining parts of the Year in Review pieces, covering Parliamentary and then Constitutional polling, are due up over the next couple of days. We’ve had frustratingly few polls tracked by what I’m now calling the BBS Standard Series lately, so some of what you’ll see in those is… well, it’s not going to be well received by some on one side of the divide, and they’re going to take that as deliberate malice on my part rather than how numbers work!

If you find this or other Ballot Box Scotland output useful and/or interesting, and you can afford to do so, please consider donating to support my work. I love doing this, but it’s a one-man project and takes a lot of time and effort. All donations, no matter how small, are greatly appreciated and extremely helpful.
(About Donations)