As usual, the second of our annual reviews looks back over the polling for both parliaments throughout the year, and what a year it’s been eh? Despite the lack of national elections in 2023, I don’t think Scotland has had a year as politically dramatic as this since the 2015 landslide that confirmed the SNP’s absolute dominance of our politics. Scottish politics can be a bit wild at the best of times, but we’ve really outdone ourselves as a nation this year.
If you were a bit merry last Hogmanay as the bells approached and you’d said to anyone, other than the most hardened partisan conspiracy theorists, that in the New Year Nicola Sturgeon would not only resign as First Minister but end up briefly arrested as part of a police investigation, they’d have rightly scoffed. Yet that’s exactly what happened, with her resignation triggering a bitter and highly damaging leadership contest after which nothing seems to have gone right for the SNP.
In the immediate aftermath of that contest it wasn’t a given that things would only get worse for the SNP. I pulled together some musings of my own on what might happen next, saying I wasn’t sure whether this could be the beginning of the end for the SNP’s time in government, or yet another mid-term slump they’d bounce back from. Nine months on from writing that, I’m inclined to lean towards “the end” rather than “mid-term slump”, given the state of polling over the year.
Polling Caveats
I haven’t typically had a caveats section for the parliamentary polling component of annual reviews, but the emergence this year of what I’m calling the “BBS Standard Series” makes it worth outlining some bits and pieces. Effectively, the Standard Series includes all published polls by British Polling Council member pollsters (that I’m aware of, stuff can slip the net) with two exceptions: the Scottish Opinion Monitor (Scoop) polls by YouGov, and anything from Redfield & Wilton after June 2023.
Scoop is kept separate because the methodology is slightly different to usual YouGov polls, which are included in the average and so I don’t want to mix the two. I still cover Scoop polls, I just track them as a separate series which you can see on the Additional Polling page and through the Scoop tag.
I stopped covering Redfield & Wilton after their June poll, after my initial excitement at having a regular Scottish tracker was replaced by disappointment at how weird and inconsistent their findings were, particularly on the Holyrood list vote for the Lib Dems (exceeding their pre-collapse record) and Greens (ricocheting from record high to no improvement on 2021 back to record high from month to month). Most polling firms have identifiable house effects (e.g. Ipsos above-average for SNP, similarly Survation historically for Labour) that are consistent and can be accounted for, but this was all over the place.
I’m not the only person to have raised eyebrows at the reliability of their polling, with other pollsters picking up issues such as oddly high Lib Dem voter favourability for Conservative politicians (source Tweet for that now protected, alas) or finding younger people and inner Londoners more likely to vote Conservative, against all sense and past electoral evidence. I would note with significant interest that in their most recent Scottish poll, Redfield & Wilton didn’t poll the Holyrood side of things, which rather suggests they’ve realised themselves what they were putting out on that front was flawed.
Although I also provide a chart of the polling average throughout the year, the primary target of my analysis is the quarterly average for Q4 (October through December). Given the variability in number, and source, of polls in Scotland, I’ve used Q4 as my basis for these reviews every year. This means that I’m at least comparing against the same time period each year, even if everything else is different. That also means that the final point on the chart of averages will not match the Q4 average.
This year we had four polls in the Standard Series over Q4; one apiece from Panelbase, YouGov, Savanta and Ipsos. Unfortunately, the most recent of these covered the 20th – 26th of November, so we have no December data in the average. This feels spiteful to me personally as the past two years I specifically aimed to get the Parliamentary Polling side of things out before Christmas, then got burned by a late poll release making me need to revisit all my averages. This year I deliberately waited until after Christmas, giving myself more work to do on my holidays when I should have been vegetating playing Baldur’s Gate 3, and of course there was hee-haw extra out.
Regional Polling Average Through 2023
By mid-December last year, the SNP were only 0.2% from their peak by this measure, itself basically the same as what they’d managed in 2021. That was boosted by a bit of the reaction following the Supreme Court decision that Holyrood doesn’t have any power to call an Independence Referendum, and had already eroded a bit even before Sturgeon announced she was resigning. Things only got worse for the SNP after that though, bottoming out below 30% which would be a remarkably poor result for them, taking them a bit below their 2007 share that I thought (and admit still feel, in the heat of a real election) would be their rock-bottom point. They’ve managed to claw back into the 30’s since then, but not by much.
Naturally, Labour experienced a relatively steady increase in their support over the year. Whilst a lot of their growth by the end of 2022 had come at the Conservatives’ expense, this year it’s more clearly come from the SNP. Support on this vote peaked in August and has slipped very slightly since then, but it’s still a comfortable advance. Notably, Labour had a lead over the SNP in a handful of individual polls included in this tracker, and tied with them in a few more. That makes 2023 the first year since the referendum to see the SNP slide into second place, and therefore Labour pull into first, in polling for any vote.
The Conservative trendline starts off with a bit of recovery, likely reflecting a continued settling of support after the mayhem that was the brief Liz Truss premiership, and was then roughly steady through the spring and early summer. They then dipped a little again over the summer, coinciding with another round of scandal and infighting that triggered a bunch of by-elections down south, before bouncing back up to end the year. They are still significantly down on their 2021 result, but not quite in the doldrums of 2022.
It’s a similarly wobbly trendline for the Greens, starting near a peak then seemingly getting caught up by proxy after Sturgeon’s resignation. By the summer they’d returned to a record high, but have ticked slightly downwards since then. Meanwhile the Lib Dems peak comes mostly from the period Redfield & Wilton were included, and they end up the only one of the Holyrood parties to end the year effectively right where they started it. That’s a better performance than at the last election though, so they’ll still feel it represents progress.
Unlike last year, I’ve actually included Alba on this chart. Like the Greens on the Constituency side of things, Alba aren’t always prompted for in polls. As such there are a few dates where their figure would be a fraction of a percentage point higher if they had been and it fell within the same general range as those that do prompt. Even with that in mind though, the best case scenario for Alba is that despite the SNP being down around 10% on their 2021 support, they have benefitted to the tune of a paltry 1%.
Regional Poll Average Q4 2023
If we look at the slightly different figures constrained solely to Q4, we can see how close things are between the SNP and Labour, with a gap of just 1.2% between them, but with neither hitting the 30% mark. As the list vote is the proportional ideal to which seats are allocated towards, the near tie here is pretty big news. If this was the result on the day it would only just beat the 29.3% that Labour won in 2003 for the weakest list vote performance for the largest party since the Scottish Parliament was established.
What obviously differentiates this scenario from what happened in the famous Rainbow Parliament of 2003 is that the SSP blew itself to smithereens that term, there are no credible Independent figures who could win seats these days the way Margo MacDonald, Dennis Canavan and Jean Turner did, and the Scottish Senior Citizen’s Unity Party were naught more than an interesting little flash in the pan. The second placed party is therefore a lot stronger versus the first than the SNP were against Labour that year, and as we’ll see when we get onto the seat projection it precludes the formation of any simple two-party coalition goverment.
Constituency Polling Average Through 2023
As is so often the case, in all honesty you can just transpose most of what I said about the regional vote onto the constituency and it’s basically the same. The only major differences are that the SNP have a much firmer lead in this vote, and one that hasn’t yet been matched or exceeded by any other party since the referendum, whilst Green support is much lower, not least as some pollsters don’t prompt for them on this question. Labour’s gap between their August peak and final December data point is also about three times as wide as it was on the list side of things.
Constituency Poll Average Q4 2023
In a certain sense, the Q4 average for the SNP represents their constituency vote “catching up” with their list vote. Last year their constituency figure was near enough identical to their 2021 result, whilst their list vote was down about 3%. The fact they’ve fallen a bit over 10% on this vote since last year therefore effectively equalises the loss to nearly 11% on both votes.
That’s quite significant in terms of the number of seats the SNP would be expected to end up with, as Labour in particular would be estimated to pick up quite a few more constituencies when they are 7% behind compared to being 10% short. AMS is never simple though so about half of the gain the SNP would have had from polling 3% stronger here would instead be from the Greens due to overhang.
Seat Projection
Projecting that into seats might give us something like this:
Please see this page for how projections work and important caveats.

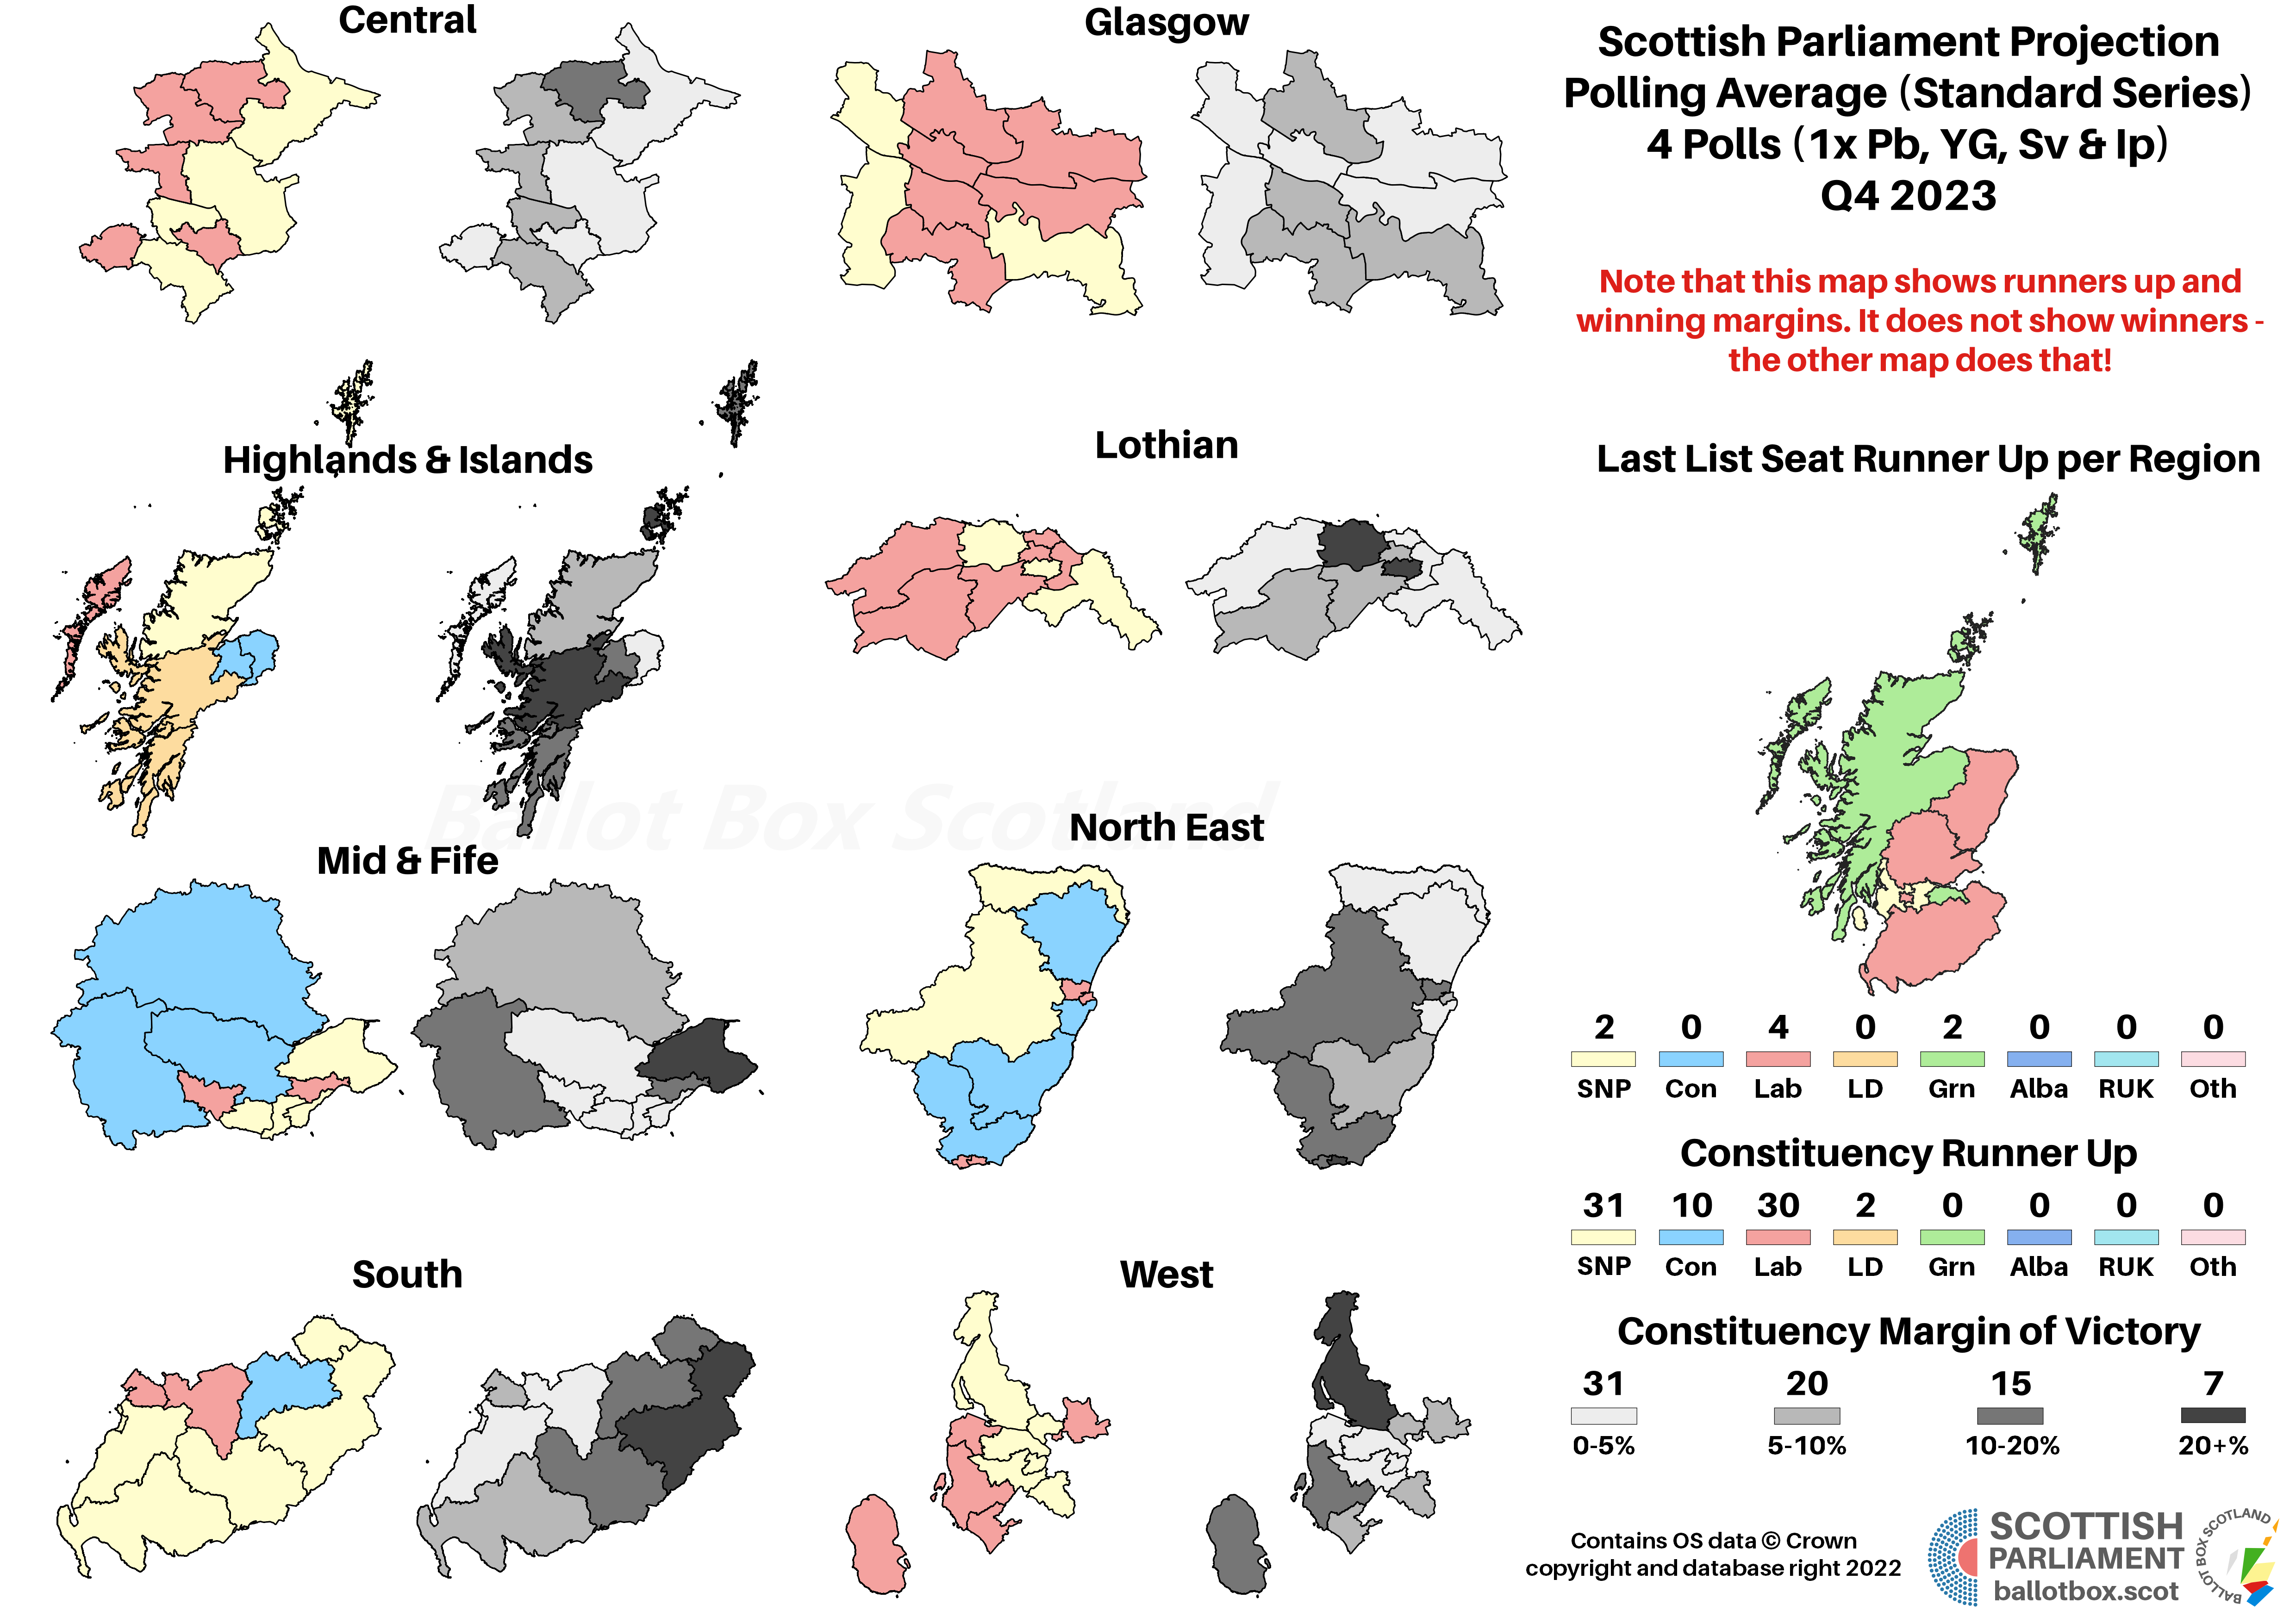
Although the SNP’s solid lead on the constituency vote helps firm up an advantage over Labour in seats, it’s not enough to prevent a huge loss in seats. Last year’s average squeaked into a bare majority, largely due to the Conservatives losing a constituency and giving the SNP more overhang, but here they are miles away from that. Indeed, even with a further increased tally for the Greens that comes from an easing of that overhang distortion (note that the Gallagher Index is half of last year’s), the current government of the two Pro-Independence parties comes up short at 59 vs 70 for the Pro-Union bloc. That wouldn’t necessarily make for smooth government sailing for Anas Sarwar though.
I’ve said a few times by now that my assumption is a Pro-Union majority leads to a Labour First Minister, but also that poses practical difficulties if there would need to be a reliance for the Conservatives on budgets too. That’s exactly what would happen here, as an alternative traffic light arrangement of Labour, the Lib Dems and Greens only tallies up to 60 seats, and it’s nigh-on impossible to imagine the SNP voting for a budget from the party that booted them out of office. Some like to point to local council arrangements that lead to de facto Conservative backing for Labour budgets locally, but that underestimates how much more difficult that would be to work at the national level.

Turning, as I so enjoy doing, to the hypotheticals, we first look at a reformatted version of AMS. This maintains the same constituency seats as the real system does, but adds a further 16 list seats, divvied up between redrawn regions and with one per region allocated based on the national vote. This gives a more proportional outcome without massively changing the workings of the system. Although these maps are too fidgety to do for every post, you do get them as a Festive treat to see how they shake out.
Unlike AMS-as-is, last year the SNP would have needed the Greens for a majority. In line with the main projection though, that governing pairing falls short here, with an even bigger gulf of 64 to 81. Although the SNP’s constituency advantage was eroded under ordinary AMS it still existed, as shown by the fact the traffic light option is much closer to viability here, at 71 seats versus the 74 held by the SNP and Conservatives.

If we get rid of the FPTP element entirely, replacing it with a more fully proportional model, the same trends continue. This naturally gives proportionally the widest gap between the Pro-Independence bloc on 56 versus their Pro-Union counterparts on 73. It also allows the absolutely minuscule 0.1% lead that the traffic light configuration has in votes to translate to the bare minimum necessary 65 for a majority, which in this nested matryoshka of hypotheticals would marginally ease a Labour First Minister’s budget passage by giving a range of options that could be played off against one another.
No wonk-y analysis for this chart, it’s just a visualisation of a range of different changes we could make to the voting system, and how those might pan out on current figures.
Westminster Polling Average Through 2023
It really shouldn’t surprise anyone that the Westminster figures largely mirror the Holyrood constituency trends; the SNP are down a lot, Labour are up a fair bit, the Conservatives are better than last year but worse than 2019, the Lib Dems are about where they were last year. There are some little distinctions within that though, including that this is the worst vote for the Lib Dems and represents a significant decrease versus the last election.
By contrast, Westminster is Labour’s strongest vote out of the three. Indeed, it’s only the presence of outlying 10% (Ipsos) and 9% (Opinium) leads that has led to the gap being just shy of 5% – given the SNP leads in the other polls were 4%, 1% and 0%, this would otherwise be running about as close as the Holyrood list vote. Some of the polls not included directly in the Standard Series even had a lead for Labour, meaning that overall I would describe Westminster polling in 2023 with the very terrible gag of “First Past the Post with List Vote Characteristics” (look up Deng Xiaoping if you don’t quite get it.)
Westminster Poll Average Q4 2023
With Opinium shunted out the average as belonging to Q3, the SNP’s lead over Labour further narrows down to just under 4%. That’s well within what I’ve been describing as the SNP’s danger zone, where Labour begin to pick up a rapidly increasing number of seats. Without changing any other party’s vote shares, Electoral Calculus reckon a 2.4% vote lead for the SNP is the point at which that nonetheless translates to a Labour seat lead, so it’s really not far off that point, especially given the fact most polls have been closer than that Ipsos one which widens the average here.
Seat Projection
I generally avoid doing detailed projections when we’re dealing purely with FPTP. Annual reviews are my one break with that policy, when I refer to Electoral Calculus for an indication. All the comparisons in the chart above are under new boundaries, in recognition of the fact those have been legally adopted and will be used for the next election, so it’s not much use comparing the existing constituencies. As you’d expect given that the SNP’s lead in votes has been significantly slashed, they’d be in for another massive loss in seats, projecting to just about half as many. Most of that obviously goes to Labour, though the Conservatives also recover from a projected wipeout in last year’s figures, and the Lib Dems would be secure in their heartlands.
Scandinavian Style Westminster

Just like Holyrood though, I do always like to look at Westminster if it wasn’t mortifyingly, miserably, indefensibly undemocratic. Whereas in previous years this was a corrective to a massively inflated SNP haul, it’s not actually all that different to the FPTP projection this time. The SNP do get cut down a bit, but so too do Labour, with the balance made up by the Conservatives.
There’s an interesting little parallel-but-distinct situation between the Conservatives and Lib Dems, in that under First Past the Post they’ve backed themselves into a small subset of constituencies they can win. However whereas the Lib Dems are so tightly concentrated that they can just about secure their fair share, Conservative support is still spread widely enough it costs them. It’d be much better to have a voting system that isn’t (at least quite so) vulnerable to geographic support spreads, recognising that it should be the number of voters not where they are that matter, but alas.
Looking Ahead to 2024
Unless the Prime Minister, anticipating a generational defeat for the Conservatives, clings desperately on until the last possible moment in January 2025, there should be a UK General Election next year. That is naturally going to be a huge focus for Ballot Box Scotland, and the General Election 2024 Hub page will be updated more frequently as it approaches. When we get some greater clarity about when it’s due I’ll also likely run another crowdfunder to plug the gap on what I’ve got on hand to commission another poll; for the purposes of not making my self-assessment tax return weird, I would prefer an autumn election to a spring one, Mr Sunak.
The last piece of the Year in Review series will go up tomorrow, looking at the big Constitutional question. Once again, a warning that due to the averaging used, it gives a result that I personally reckon is… slightly off, please don’t go throwing big temper tantrums at me about it when it goes live, I didn’t invent averaging!
If you find this or other Ballot Box Scotland output useful and/or interesting, and you can afford to do so, please consider donating to support my work. I love doing this, but it’s a one-man project and takes a lot of time and effort. All donations, no matter how small, are greatly appreciated and extremely helpful.
(About Donations)