As with last year, this year’s annual reviews are coming in that inter-festival lull between Christmas and New Year, just in case any late polling appeared as it had a couple of years previously. It didn’t, of course, because the rule is it does if I go early and doesn’t if I go late, but here we are!
This year was abnormally busy for by-elections, with a whopping 40 by-elections electing (due to a double in one ward) 41 part-term councillors. A large proportion of these were triggered by councillors being elected as MP, amounting for 17 out of the total, with one more of those left to go next year.
However even without those, the 23 others we had would have been the most by-elections in a single year since Ballot Box Scotland launched. The next closest year is 2021 which was just behind at 22 by-elections, and that was padded out by a few that had originally been scheduled for 2020 being postponed due to pandemic restrictions.
By-Election Caveats
As ever, before we really start talking about by-elections, we need to get a range of caveats out of the way first. Regardless of the number and spread of by-elections, remember they always make up just a fraction of Scotland’s 355 wards. That alone means these figures aren’t representative of the whole country, as even this year’s bumper crop only brought us to a bit more than 10% of the wards across Scotland.
Also important for many by-elections, especially in the more rural wards, is the absence of popular independent councillors. Councillors that continue to serve or who have sadly passed away obviously don’t appear on the ballot for by-elections, and so that can limit the usefulness of direct comparisons with May 2022 in their wards.
Finally, remember the most important aspect of STV – that the nice simple language used for FPTP of “gain/loss/hold” isn’t as applicable here. Whoever vacated one of three or four seats is not always the same as the overall winner at the last election. It’s entirely possible for the vacating party, the party that had a first preference lead, and the party that would have won a single seat election in May 2022 to all be different!
Seat Shifts
As usual, let’s start with how changes in seats, with all the complexity that involves under STV. The table below shows each of this year’s by elections with both the vacating party and 2022’s notional winner shown, alongside the eventual winner of the by-election. You can click the ward name to see the result analysis for each by-election.
And translating that table into a simpler chart format, that tells us a rather different story depending on what measure we’re looking at:
Versus Vacating
If we look first specifically at the comparison with seats vacated, which is more impactful for political control but less reflective of voter change (note Independents use slightly different terminology as they aren’t directly comparable to one another):
 Conservative: Vacated 4, gained 6, held 1, lost 3 (net +3)
 Labour: Vacated 17, gained 6, held 13, lost 5 (net +2)
 Green: Gained 1 (net +1)
 Lib Dem: Vacated 4, gained 2, held 2, lost 2 (net nc)
 SNP: Vacated 7, gained 4, held 1, lost 6 (net -2)
 Independent: Vacated 9, won 5 (net -4)
By this measure, there aren’t actually that many changes. The SNP had a net loss of a couple of councillors, we ended up with fewer Independents, and there are now a handful more Conservatives and an extra Green. Labour’s net gains on this one are basically cancelled out by the fact two of the Independents had been elected for them but expelled after criminal charges came to light.
Versus 2022 Winner (true Defending)
If we instead do the more electorally relevant comparison with the May 2022 single-seat winner:
Labour: Defending 13, gained 8, held 11, lost 2 (net +6)Conservative: Defending 4, gained 5, held 2, lost 2 (net +3)Lib Dem: Defending 2, gained 2, held 1 (net +2)Green: Defending 1, held 1 (net nc)Independent: Previously won 7, won 5 (net -2)SNP: Defending 14, gained 1, held 4, lost 10 (net -9)
This is where we see much bigger changes, and very much to the SNP’s detriment. They were the 2022 winning party in twice as many wards as they vacated, yet only won about a third as many by-elections. Indeed it became something of a game by the end of the year for Twitter partisans to triumphantly count how many by-elections in a row the SNP hadn’t won. Ironically enough by that point though we were in a run of overwhelmingly non-SNP wards (of the final 20 by-elections, the SNP were 2022 winners in only 4, and one of those by a mere technicality.)
As you’d expect given the general political atmosphere this year, it was Labour who benefitted the most from that SNP decline. There are no caveats for their net gains here, which saw them win about half as many councillors again on top of what they’d have had in 2022 terms. Regardless of measure the Conservatives are up, whilst the Lib Dems make actual gains with their two stunning victories in Strathallan and Colinton and Fairmilehead, ill-fated as the latter was. The Greens meanwhile may have made a little bit of history by winning their first ever by-election this year, but they did so in literally their strongest ward in the entire country, so it doesn’t actually amount to a real-terms gain.
Turnout
Note: Dunblane and Bridge of Allan had two by-elections this year, but it would not make sense to count the same voters twice in this context. As such, only the second by-election is counted in this total.
One of the things about council by-elections is that there’s so much data available it can be hard to decide what to include. If you were to go back through my annual reviews, you’d find slightly different measures of first preferences included at different points, as I tried to find ways of contextualising what results in a small subset of wards mean. One thing I’ve never tracked overall is turnout. Although I report turnout in the results analysis pieces and it goes on the social media charts, I haven’t typically summed it up across by-elections.
This year however, prompted in part by some sub-20% turnouts including a rock-bottom 12.4% in Glasgow’s North East ward, I decided to go back and tally up the turnouts for every by-election. What this shows is that relative to the same wards in 2022, turnout was down by 19.1%. As a proportion of the eligible electorate, 2.6 times as many people voted at the last Scottish Parliament election in 2021; 2.4 times as many in July’s UK General Election; and about 1.8 times as many in 2022’s local elections.
I’m forever pointing out that turnout matters for reasons other than simply perceived democratic legitimacy of the outcome, as vitally important as that is. It can also impact the outcome itself. Turnout is not equal across different groups in society. Older people are more likely to vote than younger, for example, and the wealthy more so than the poor. On top of that, different groups are more or less likely to vote for different parties.
Older and wealthier people are more likely to vote for parties of the right and/or the Union, whilst younger and less wealthy people lean towards parties of the left and/or Independence. You can see this in action in the polling district level data by comparing the in person and postal votes. Postal voters are older on average, and most of the time you will see the three primary Pro-Union parties do a little better in postals than in person votes, whereas it’s the opposite for the two major Pro-Independence parties.
Given that turnout at by-elections is so low, the parties favoured by higher turnout groups effectively start from a better position than in 2022 even if nobody who does vote does so any differently. I refer to this in preview and analysis pieces as “by-election conditions”, and it’s why relatively small swings in favour of for example the Conservatives or against the SNP generally don’t really indicate much of anything for those parties in isolation.
First Preference Votes
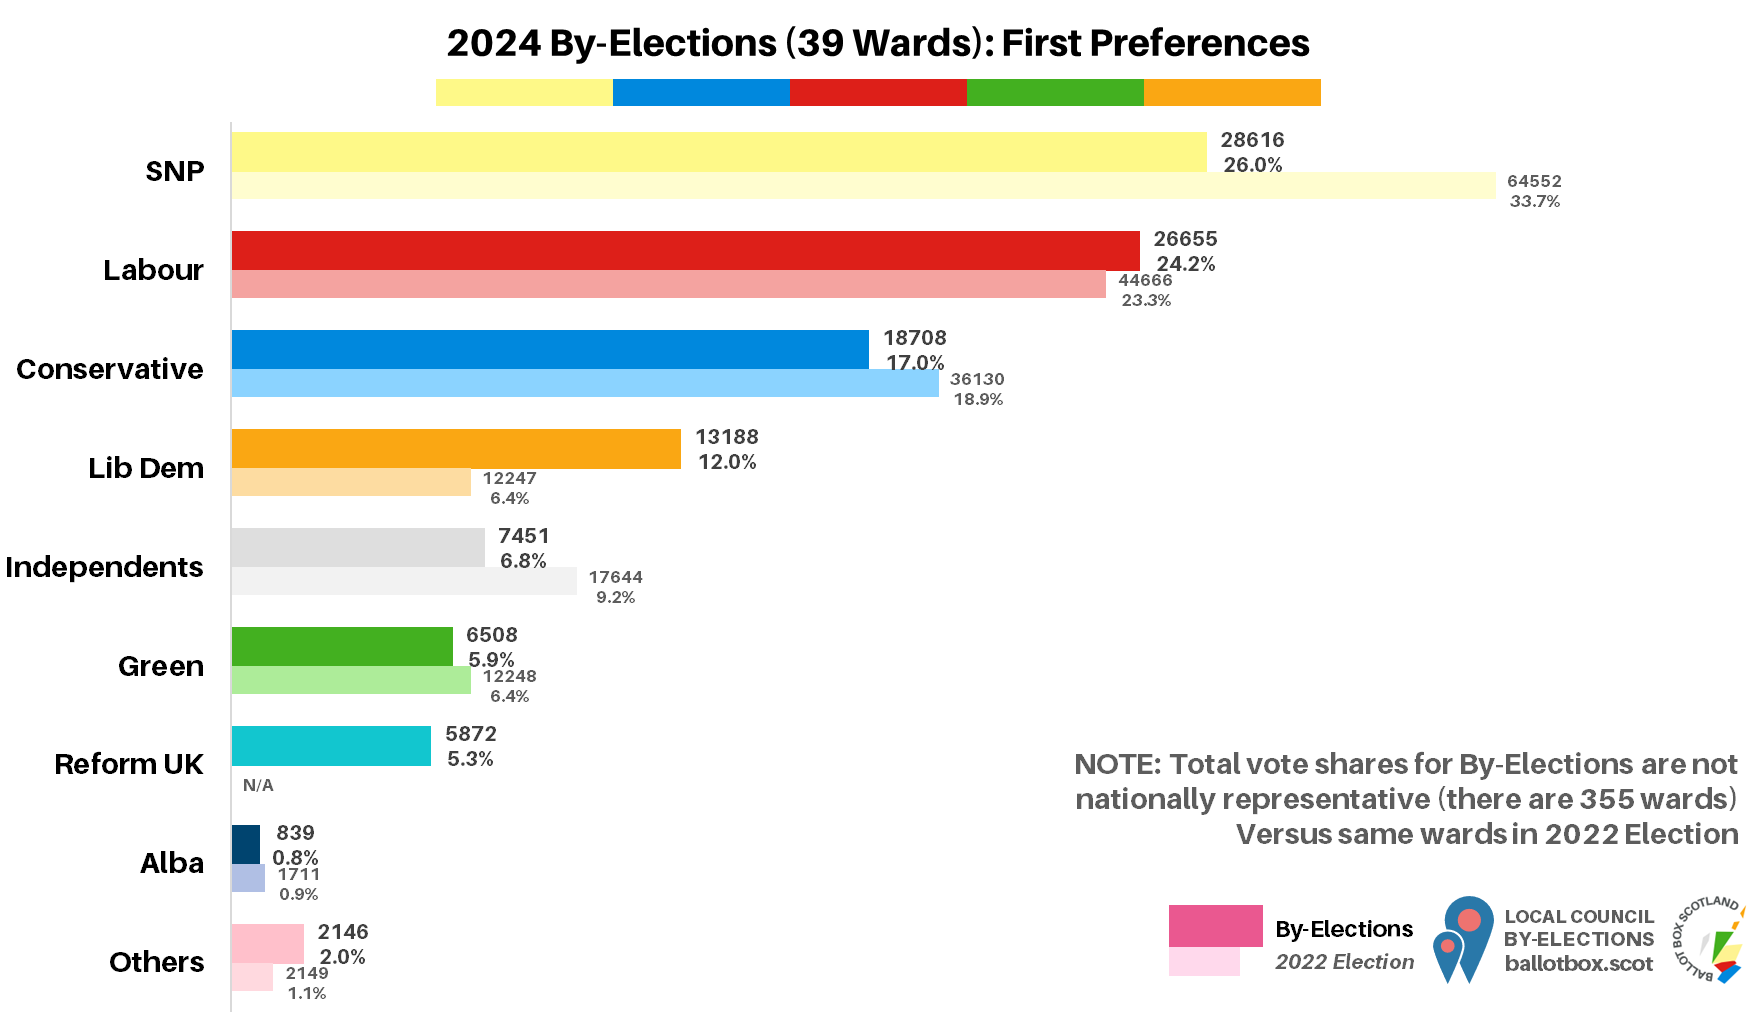
First Preferences across 39 By-Elections
Note: Dunblane and Bridge of Allan had two by-elections this year, but it would not make sense to count the same voters twice in this context. As such, only the second by-election is counted in this total.
If we look purely at first preference votes, we get a mixture here of expected and perhaps slightly surprising figures. On the expected front, the SNP being down very substantially makes sense given how far they’ve fallen from their peak. Similarly, the Conservatives losing ground in a year they had their worst-ever Westminster result in Scotland tracks, the Greens dipping slightly is plausible given the turnout points, and the sum and total for Independents falling is to be expected when some of the popular winning Independents from 2022 were, by definition, not on the ballot. Finally for the obvious bits, and speaking of not being on the ballot, Reform UK didn’t contest any wards in 2022 so register as a completely new force.
Other figures perhaps require a bit more explaining. Given how many by-elections Labour won, it might be a surprise to see they didn’t even make a whole percentage point gain compared to 2022. That’s because they actually started losing ground late in the year, when the realities of government began to settle in and Reform UK started appearing on ballot papers. The Lib Dems nearly doubling their share is more to do with the combination of some very strong areas coming up (Fort William), key gains (Strathallan), and contesting more of these by-elections than they did in 2022 (37 this year vs 28 in 2022) than it is any suggestion their national support has doubled.
First Preferences across 24 By-Elections with Holyrood 5
Note: Dunblane and Bridge of Allan had two by-elections this year, but it would not make sense to count the same voters twice in this context. As such, only the second by-election is counted in this total.
One of the difficulties in comparing the whole pool of by-elections is different patterns of contesting. There were a couple of islands by-elections that had no major party candidates for example, Labour continued to be absent from some more rural wards, and although the Greens were roughly as present as in 2022, that presence didn’t always match with other parties, most notably in Arran where the Greens ended up standing but the SNP didn’t. If we therefore compare just those by-elections that had all five Holyrood parties, we get slightly different figures.
The SNP and Labour are a bit closer together here, as this removes those rural Labour absences from the mix. That’s also why the Conservatives are more significantly down here, as they obviously excelled in those wards. The condensing down to a smaller subset of what was already a subset also gives the Greens a visual lift, as they were the most-absent of the five.
First Preferences across 13 By-Elections with Holyrood 5 and Reform UK
One final way of looking at First Preferences would be to extend the net beyond the Holyrood 5 and into Reform UK, who only started contesting by-elections after the general election. Although they stood in 19 wards in total (with 20 candidates due to not actually understanding STV!), only 13 of those saw them facing off against the full pack of Holyrood parties.
This is where we see some really significant impacts from Reform’s presence, with the top three parties suffering the most here. Labour’s very small gains reverse into a not insubstantial dip in support across the Reform-inclusive ballots, the SNP’s losses heighten slightly, and the Conservatives appear to lose out enormously. This is still only a very small section of the country, and as I’ll discuss in more detail in my parliamentary polling analysis it may be heightened by the fact we’re not actually in an election period, but it points towards a party that are likely to win at least some seats in 2027.
The Lib Dems need a big warning flag here: the primary reason they end up with such a huge gain here is because of their staggering roughly 24% gain in Colinton and Fairmilehead. That by-election makes up a massive 20% of the total votes cast in this pool of 13 by-elections, and thus helps to over-exaggerate the Lib Dem position. That’s not to say they haven’t made some half-decent progress overall, just not to expect them to more than double their share when the next set of locals actually rolls around.
A Year of Two Halves
Swings in the 10 Pre-GE BEs
Note: This does include the first Dunblane and Bridge of Allan by-election, as the two fell either side of the General Election.
Swings in the 30 Post-GE BEs
Given that we had a UK general election practically bang-on the mid point of the year, it’s worth comparing the by-elections we had before and after it. For brevity I’m just looking at swings here, and these show a huge difference across the two halves of 2024.
The first half effectively signposted Labour’s upcoming big wins at Westminster, with the SNP in freefall and Labour making big gains even in wards where they weren’t really in contention. In fact of the 10 pre-GE by-elections, Labour only won two of them, and had only been the actual 2022 winner in just one. Yet the second half shows Labour actively losing support relative to 2022, despite winning 17 out of the 30 by-elections and having been the 2022 winner in 12 of them.
Effectively, Labour continued to perform very strongly immediately after the Westminster election, but as Starmer’s new government seemingly ran aground on every reef it encountered, they began to similarly experience much rougher results in Scottish by-elections. It wasn’t universally worse than 2022, but by the end of the year, generally where a ward was both a Labour lead in 2022 and had a Reform UK candidate, Labour were losing share.
By-Elections: Backing Up, not Undermining, National Polling
Despite Labour’s overall success in terms of winning by-elections recently, national polling has turned quite strongly against them over the past few months. For some, this simply does not compute, and I’ve had many a reply or quote tweet from folk scoffing or surprised by how different polling looks. It seems unbelievable that Labour could be opening up a significant deficit with the SNP – and this is very deliberate phrasing, it’s not the SNP opening a lead – over a period where they were beating the SNP in a slew of by-elections. Yet you can piece together a clear explanation for why this is from the data and caveats throughout this piece.
For one thing, remember that this is just a small subset of wards. Especially after the General Election, this year was heavy on city and urban wards, with comparatively few rural by-elections. Even with a bit of a recovery for Labour nationally, the SNP outpolled them two-or-three to one in most rural areas in July. By-elections can’t give a full picture because they aren’t nationally weighted the way polling is. Labour’s path to a big Holyrood win runs through the Central Belt, not the Highlands, North East or Borders, whereas the SNP’s big wins have been built on being dominant absolutely everywhere.
Then we can refer back to the turnout section. Around two and a half times as many people, in relative terms, voted in 2021 as did in these by-elections. Although we might expect 2026 to be lower turnout than 2021’s record figure, it’ll still be at least twice the level of engagement. Remember too who turns out at by-elections: higher turnout groups, including older voters. Who, in a Scottish context, is more likely to back Labour and less likely to back the SNP? Older voters. Even within the wards that did vote this year, the relative share for the SNP will have been lower than what it would be at a parliamentary election, and Labour a little higher.
Then we can look at the emergence of Reform UK. They barely existed in 2021 – despite having picked up a defecting MSP and standing in every region, they only managed a laughable 0.2% of the vote. Now, they are polling well, and eating into Conservative and Labour support especially. That’s partly what was turning the post-GE by-elections into a net loss of share for Labour, and that was with them not contesting every ward.
Finally, recall what I said about the wards that were up for election in the latter part of the year. The final run of 20 (half of the total!) where people were getting very excited about the SNP not having won any of them until they finished with a win in Stirling East, they weren’t the 2022 winner in most of those anyway. It’d be like the Conservatives celebrating a streak of Labour losses across rural Gloucestershire, Somerset and Devon. It’s not indicative of anything in itself to lose a by-election you hadn’t won the full election in anyway – or, vice versa, to win a by-election where you had won at the full election.
Far from presenting an opposing picture to polling, recent by-elections back up polling by showing Labour on a decline, the SNP stabilising (i.e. not falling any harder than they already have), and Reform UK tearing into Labour share in heartlands like Glasgow’s North East or Whitburn and Blackburn in West Lothian. It only looks incompatible if you take the most incredibly shallow surface reading of by-election results.
Time to Bin By-Elections?
This piece is already a lot longer than usual, given how busy this year has been and the level of detail it was worth going into. However, there’s one last topic I think it’s worth touching on this year especially: I don’t think we should have by-elections in the first place.
That may come as a shock, both because I obviously enjoy covering them on BBS and because the political culture in this country leads us to expect vacancies to be filled via by-election. However, it’s an entirely reasonable and in fact I’d go so far as to say democratically necessary step to abolish local council by-elections.
The first and most important reason is that they simply do not make sense under STV. I’m always at pains to point out how different a single-seat by-election is from a multi-seat full election, and indeed how STV differs from FPTP. The whole point of us using STV in the first place is we recognise that giving representation only to the largest group of voters isn’t fair. So we say, in for example a four member ward, as long as you belong to a group of voters that amounts to just over 20% (after transfers), you get representation. Yet if that hard-won councillor vacates their seat, we tell those same voters to sling their hooks and jog on, because the by-election goalpost shifts to over 50%.
Even if (and I acknowledge as per my “by-election effects” caveats later, this never happens) everyone who voted at the full election turns out at the by-election and votes exactly the same way, minority voter groups therefore often cannot win their councillor back. In some cases, this can lead to single-party control of a ward (think the SNP in Perth City North this year), which is again utterly incompatible with the basic principle of STV that the diversity of voters should be matched by diversity of representation.
In the worst case scenario it could even change the entire administration of a council, not because voters across the council as a whole voted for that, but because voters in just one ward got an extra opportunity to vote. All of these are clear and serious breaches of the basic democratic principles of proportional representation and equal voting weight. Just because we culturally expect by-elections thanks to our utterly unrepresentative, majoritarian Westminster voting system does not actually make them democratically optimal in a proportional setting.
Then we have the issue of turnout. As established earlier, it almost halved across this year’s by-elections compared to the full election in the same wards. Whilst it’s certainly true that more can and should be done to drive voter engagement, by-elections are never going to be seen as important by your average voter. Electing one (or occasionally two) councillors just doesn’t feel important, and it will always have derisory turnout compared to full elections and all the media attention those garner.
To make matters worse, we’ve got two by-elections coming up next year arising from absolutely nonsensical circumstances. Although an SNP councillor had already triggered a second Colinton and Fairmilehead by-election, if they hadn’t, we’d have gotten one anyway after the Lib Dem councillor elected at the by-election resigned one week later, having put their house (that was a central part of their “vote for me, local” campaign) up for sale the day after the vote, intending on moving abroad.
In Glasgow’s North East ward, an administrative cock-up somewhere along the line meant the newly elected Labour councillor, already having been elected from a paltry 12.4% turnout, failed to resign their council job within the legally mandated timescale. My understanding is this is still with a judge for a final decision, but it’s likely to make those already utterly disinterested voters have to come back out to the polls again in short order.
It would be so, so much simpler if we just followed Ireland’s example and allowed vacancies to be filled by co-option. In most cases, where a vacancy arises we should simply allow the party the councillor was originally elected for to appoint a successor. This preserves the original proportional balance both within the ward and across the council that voters established at the full election, without the democratic distortion of running a majoritarian by-election.
It might still make sense to have by-elections to replace Independents (by definition not party-affiliated) or the very rare occasion where a party has de-registered since the election, but they shouldn’t be the default. I’d be sad to have a bit less to do on BBS overall (though this year I would have quite liked that), but our democracy would be a little healthier. It would also actually be good for our political understanding, reflecting on the previous section about results versus polling, not to have periodic bursts of data that are widely misinterpreted or deliberately spun into poorly supported or outright untrue narratives.
Alas, that last point may be why no party would get rid of by-elections. Being sure you can keep seats you fairly won unfortunately matters a lot less to most politicians than being able to occasionally smugly tweet things like “STUNNING GAIN FROM OUR HATED OPPONENTS”, absent the context that said hated opponents got 23% and one seat at the full election and their councillor resigned due to ill health, whereas you got 47% and two seats and therefore were expected to win.
Looking Ahead to 2025
We’ve already got a fair few by-elections on the cards for 2025, with a total of 7 on my radar. Two of those have arisen in wards that already had by-elections in just the past couple of months, in some absolutely wild circumstances, but I’ll get onto previewing those in the New Year.
The remaining parts of the Year in Review pieces, covering Parliamentary and then Constitutional polling, are due up over the next couple of days. We only had a handful of polls over the last quarter, and from just two polling firms, so don’t get carried away by what they say.
If you find this or other Ballot Box Scotland output useful and/or interesting, and you can afford to do so, please consider donating to support my work. I love doing this, but it’s a one-man project and takes a lot of time and effort. All donations, no matter how small, are greatly appreciated and extremely helpful.
(About Donations)