Overview
Though the Greens became Scotland’s fourth party at Holyrood in 2016, they’ve remained fifth at local and UK level. The Scottish Greens are still a relatively youthful party, only taking their current form in 1990, and tracing their ancestry only as far back as the early 1970’s. Compare with the three major UK parties, who were all formed in the pre-democratic era, and the SNP, which came together in the 1930’s.
It was only with the advent of proportional representation that the Scottish Greens started to get a look in – and that took until 2007 for local elections. It’s not that they were entirely absent in the FPTP era, just that they had a very limited presence. They briefly had one elected councillor for Highland Regional Council in 1990, who has been described to me as (and I quote) “the dolphin whisperer”, though he ditched the party very shortly after that. Presumably, the dolphins told him to.
In fact, at the final ever FPTP elections in 2003, the Greens stood just a single candidate. That’s perhaps not very surprising when you remember that was a year when Local and Holyrood elections were still combined – and the year of the Greens’ famous “second vote Green” slogan. Naturally, they’d have put a focus on the proportional election to Holyrood, rather than the non-proportional council ballot.
Contest Rates
Councils
The introduction of STV made it much more worth the party’s while standing in local elections, but even then they started small. In the first two elections they only put forward full slates in the two big cities, with much more limited spreads elsewhere. Indeed, they only contested just shy of two-thirds of councils at all in 2007, and fell back to just over half in 2012.
The Greens’ Big Bang moment was of course the 2014 Independence referendum, after which their membership ballooned. One consequence of that was a much wider presence in 2017, when 9 councils saw a Green on the ballot in every ward, and they contested a record 28 councils overall. By that second measure they in fact had more of a presence than the Lib Dems, who only contested 24.
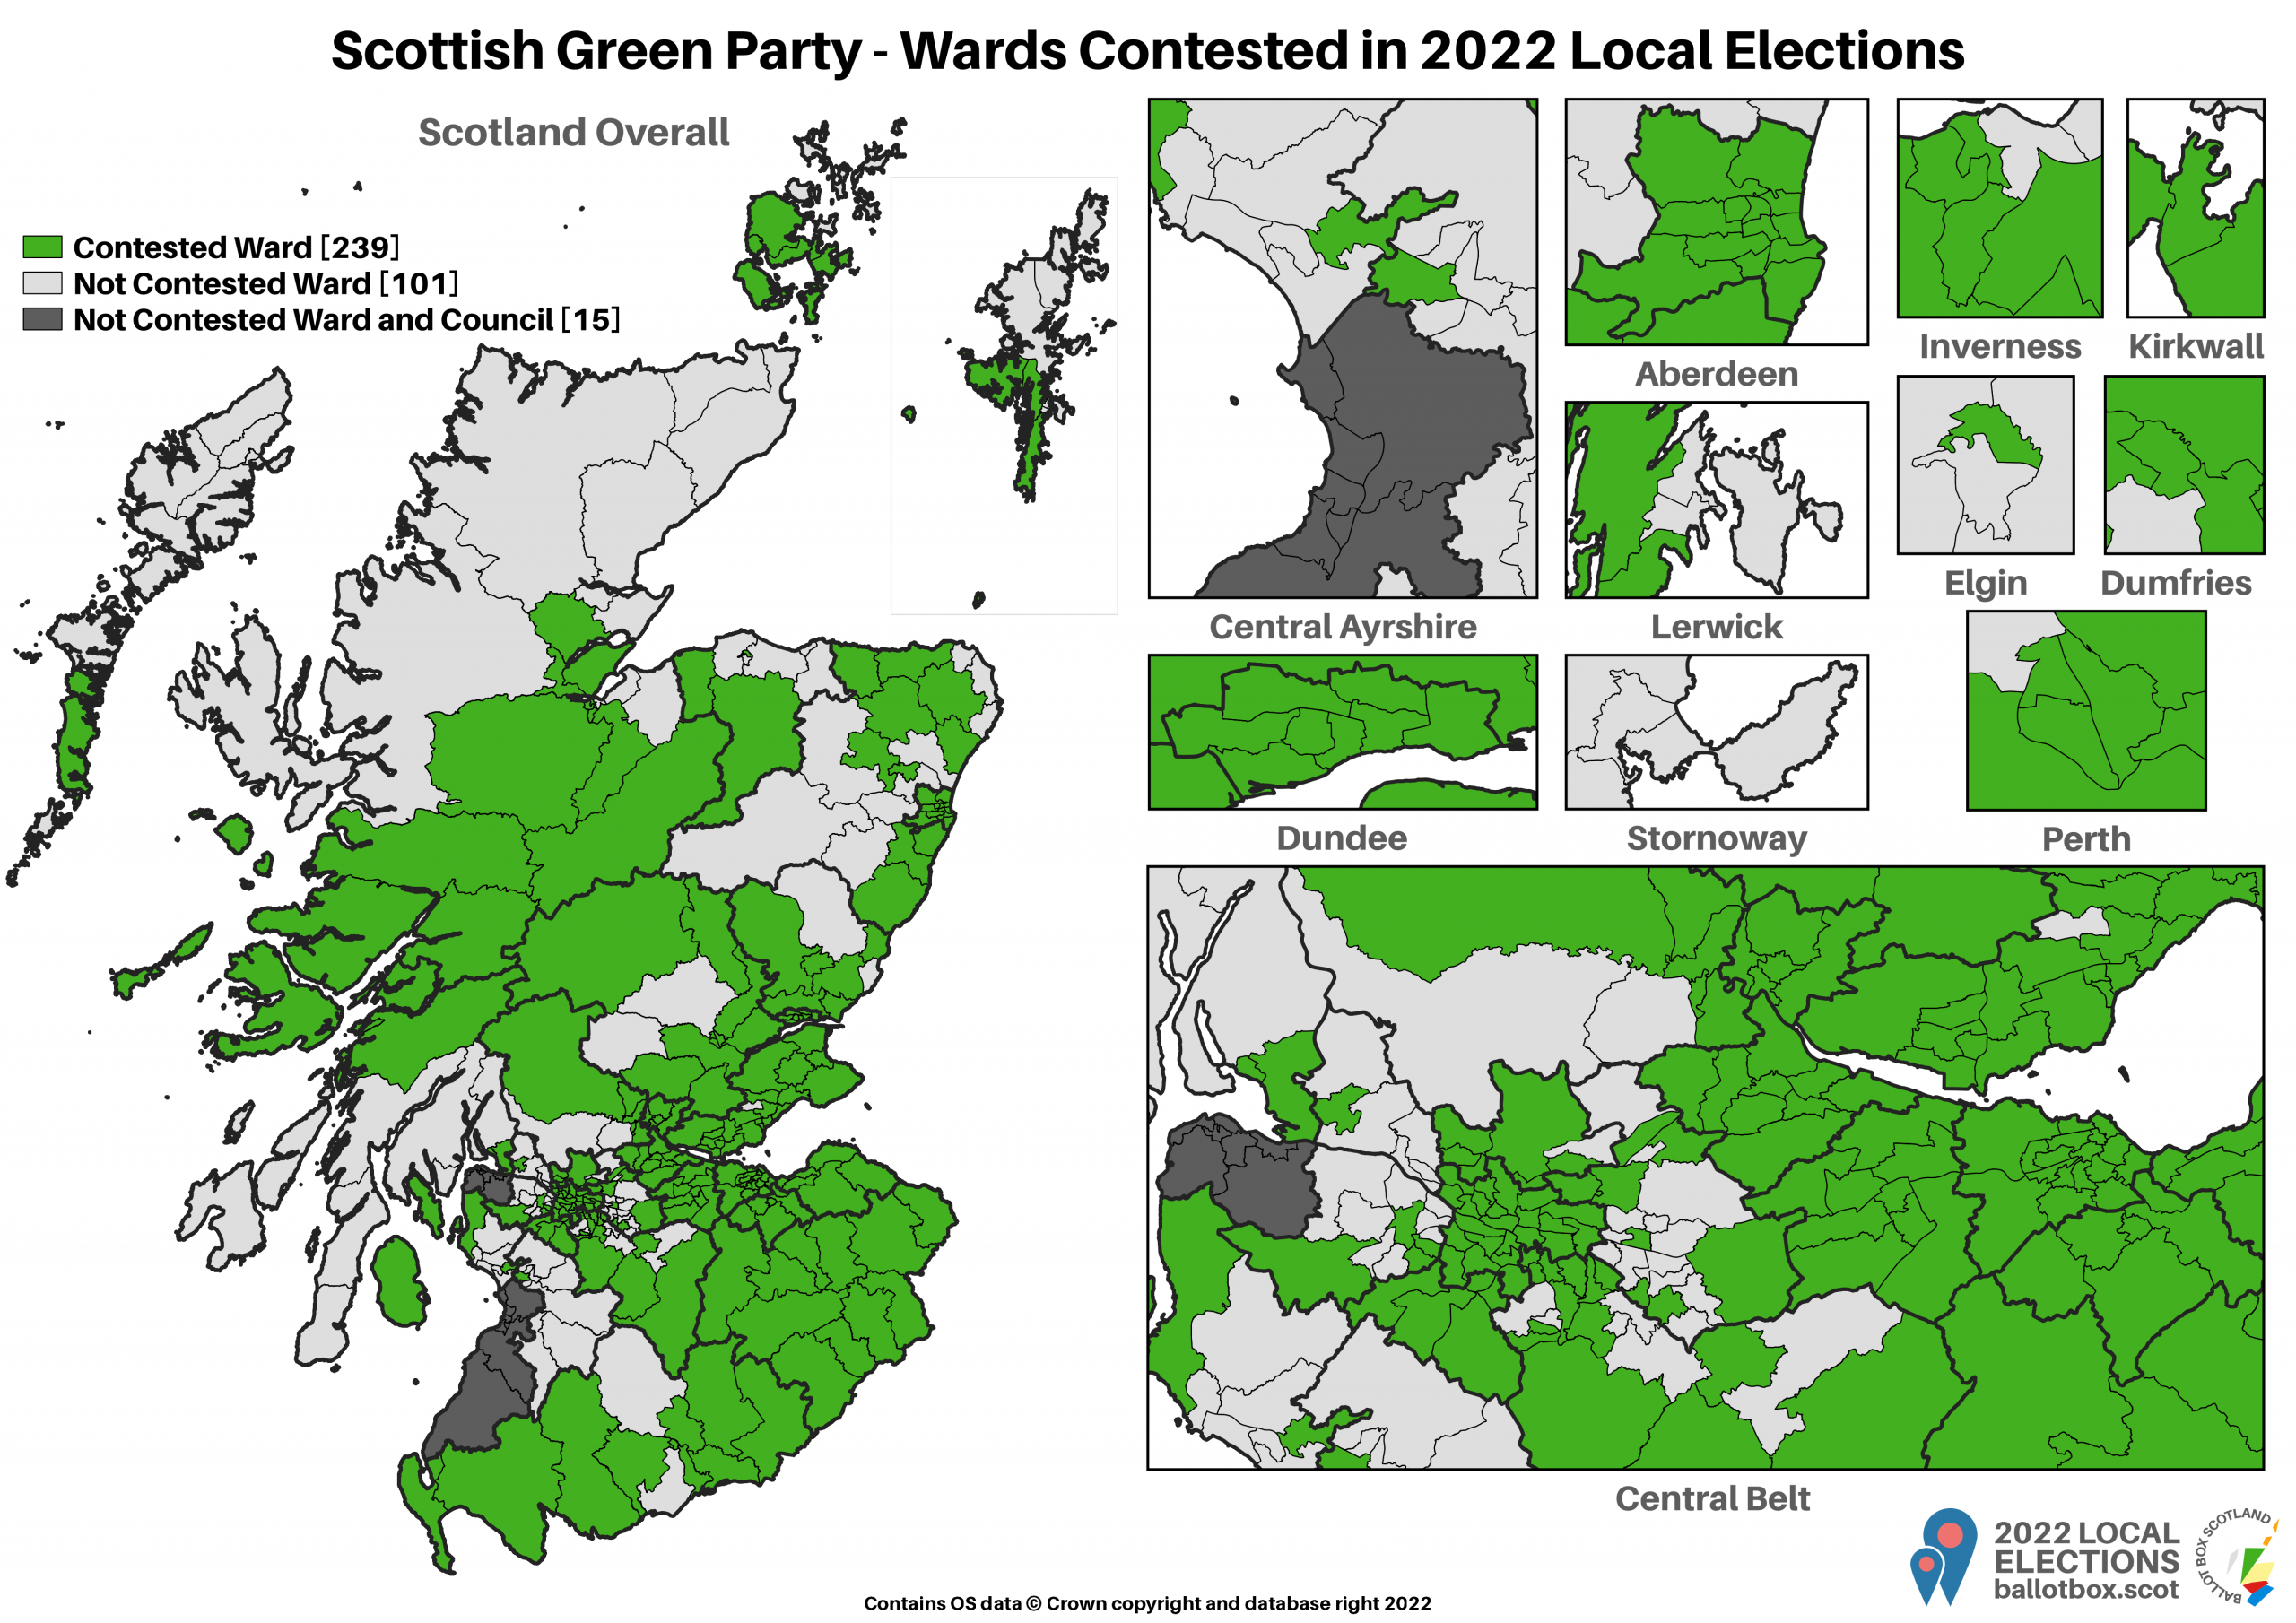
Compared to 2017 they’ve added Aberdeen, Dundee, East Lothian, East Renfrewshire, West Lothian and the Borders to their crop of fully contested councils. That’s the first time they’ve managed that across the four big cities. However, East Dunbartonshire, Fife (both short by 1), Stirling (by 2) and more dramatically Renfrewshire (by 8) have fallen into partly contested territory. Angus (with 6 wards), Shetland (3) and na h-Eileanan an Iar (1) are also going from uncontested to partly so, whilst South Ayrshire slips into uncontested, joining Inverclyde which is now the only area where the Greens have never stood locally.
Wards
Turning to the total number of wards, and we can see just how thinly spread Green candidacies were before their membership surge. They stood in only a bit over a quarter of wards in 2007, and just under that come 2012. Given the size of the Greens’ pre-referendum membership, this will have represented a much bigger portion of their activist base standing than the other parties.
With many more members in 2017 they stood in over twice as many wards as their previous record, and for the first time had a presence comparable to one of the Westminster parties, only 18 wards shy of the Lib Dems. This year the Greens have continued to grow and overtook the latter’s 2017 tally – however, as they also found more candidates, the gap between the two smaller parties is almost unmoved at 17 wards.
Similar to the Lib Dems though, this isn’t a picture of consistent progress, and instead is a real mix. Beyond the councils mentioned above, the Greens are more present in Aberdeenshire (up 5), Highland, Orkney, Dumfries and Galloway (all up 3), Argyll and Bute (2), and Moray (1). They are less present in North Lanarkshire, Perth and Kinross (both down 1), East Ayrshire (3) and South Lanarkshire (down 5).

Candidates and Councillors
Candidates Nominated and Councillors Elected
Of the Holyrood parties, the Greens have probably the most contrast between the two lines on this chart. Although their total number of candidates went down from 2007 into 2012, their number of councillors went up. That meant alongside growth in Glasgow and Edinburgh, they picked up a small handful of seats outside the big cities. Come 2017, their skyrocketing number of candidates didn’t mean the same happened with seats, where growth was slow and steady.
Wards Represented
Unlike the other parties, the Greens don’t have anywhere they have the support for two councillors, and thus there’s a 1:1 ratio between their number of seats and wards. It’s possible that results this year could indicate a ward or two they might want to try a double in 2027, especially if boundary changes introduce any 5-member wards to the big cities.
Share of Votes and Seats
Votes
A rather interesting shape to the vote share chart here. In terms of actual votes you can clearly see the benefit to having stood in many more wards in 2017. Even though they were less present in 2012, their share squeaked upwards compared to 2007 by the tiniest amount.
That’s also why their share in contested wards peaked in 2012 – that’s when wards they won seats in were at their highest proportion relative to number of wards contested. It went back down in 2017 not because of a loss of support, but because they were now standing in a lot more places, and thus weaker areas now made up more of their overall vote.
Seats
This chart is the same seat numbers as in the candidates and councillors chart, just shown as a share of the total. It’s a useful illustration of the fact that for all that STV is a form of proportional representation, it’s not a particularly proportional one. In both absolute and relative terms, Green representation is well below what their vote share would seem to justify.
STV is just a more difficult system for the Greens than Holyrood’s AMS is, as their vote share is relatively evenly spread. With 15-17 seats per region, the Greens can thus win MSPs with about 6% of the vote, as they did in the Central and North East regions last year. But since councils are (mostly) 3-4 seats per ward, similar shares such as 6.5% in Clackmannanshire and 6.9% in Midlothian weren’t enough for a seat, despite a total of 18 being up for grabs, as they didn’t poll highly enough in any individual ward.
Possible Outcomes
Note: Obviously, your personal perception of a good or bad result will depend on how much you like a given party. For the purposes of this piece, good and bad relate to how an impartial observer might view the result, taking into account other elections and the general situation facing that party. They are not a commentary on whether such results would be good or bad for the country.
Good Election
With that note about how challenging STV is for the Greens, expectations would be for more slow and steady growth this election. They’ll be publicly happy with any increase, but I’d put the marker of a truly good result at 25 seats. To achieve that would almost certainly require more than just building on past results in the two big cities, with growth and breakthroughs elsewhere. In theory, given their local results have historically tracked pretty closely to Holyrood support, their record result last year should have positioned them to achieve this.
Although they were set to be disadvantaged by the fact an Aberdeenshire councillor with a personal vote isn’t standing again, their surprise councillor in Highland’s uncontested Caol and Mallaig ward has balanced that out. On a good day they should also make a second Highland gain to give them a trio there, as well as win their first ever seats in Aberdeen and Clackmannanshire. Less dependent on party support and more on personal votes would be the possibility of picking up some Islands councillors, by re-electing defecting Independents in Orkney and na h-Eileanan an Iar, and a fresh party face in Shetland.
Bad Election
The Greens really don’t have seats to lose, so even a net loss of one would be a blow to them. They can however afford some shuffling of seats, as happened in 2017 when they lost incumbent councillors for the first time. As noted above a guaranteed Aberdeenshire loss has already been counteracted, and they are well positioned to do the same in Orkney. If that were to result in no net change overall however, that would still be a pretty poor result for the Greens given a year of comparatively strong polling for Holyrood.
If you find this or other Ballot Box Scotland output useful and/or interesting, and you can afford to do so, please consider donating to support my work. I love doing this, but it’s a one-man project and takes a lot of time and effort. All donations, no matter how small, are greatly appreciated and extremely helpful.
(About Donations)