After another little break between polls, this one feels like an “ask and ye shall receive” moment. There are a bunch of pollsters who now do relatively frequent Scottish polling, and the only one we hadn’t heard from in the Post-Sturgeon era was Ipsos. I’d hoped that gap would be filled sooner rather than later, and thanks to their ongoing partnership with STV News (link to original writeup), they’ve broken that dry spell with this poll (link to tables.) I’m always after a bit of diversity in polling spread, in part to even out what are the known house effects of each pollster, which I’ll discuss in more detail throughout this piece.
The previous Ipsos covered the 28th of November – 5th of December 2022. Changes are shown as (vs that poll / vs last election).
Regional Vote
It’s been nearly six months since we had voting intention from Ipsos, and rather a lot has happened since then, hasn’t it? That’s reflected here by a massive decrease in the SNP vote, and an almost equally large increase for Labour. There is a wider gap than with other pollsters, but we know Ipsos’ house tendency is to be stronger for the SNP than other pollsters – I’ll talk about that a little bit further on.
The Conservatives too recover a bit which combined with a Green downtick resolves the near-tie in the last poll, but still with what would be a record result on the day for the latter. In that sense, the Lib Dems are the only other major party apart from the SNP with nothing to be happy about here, as by matching their 2021 vote, this is their worst share since an Opinium poll in September 2021.
Constituency Vote
You can see the same general situation over on the constituency side of things – big SNP decrease, solid Labour and Conservative gains, and Lib Dems static relative to their 2021 result. The Greens do have a slight gain here too, but that’s margin of error.
Seat Projection
Projecting that into seats might give us something like this:
Please see this page for how projections work and important caveats.
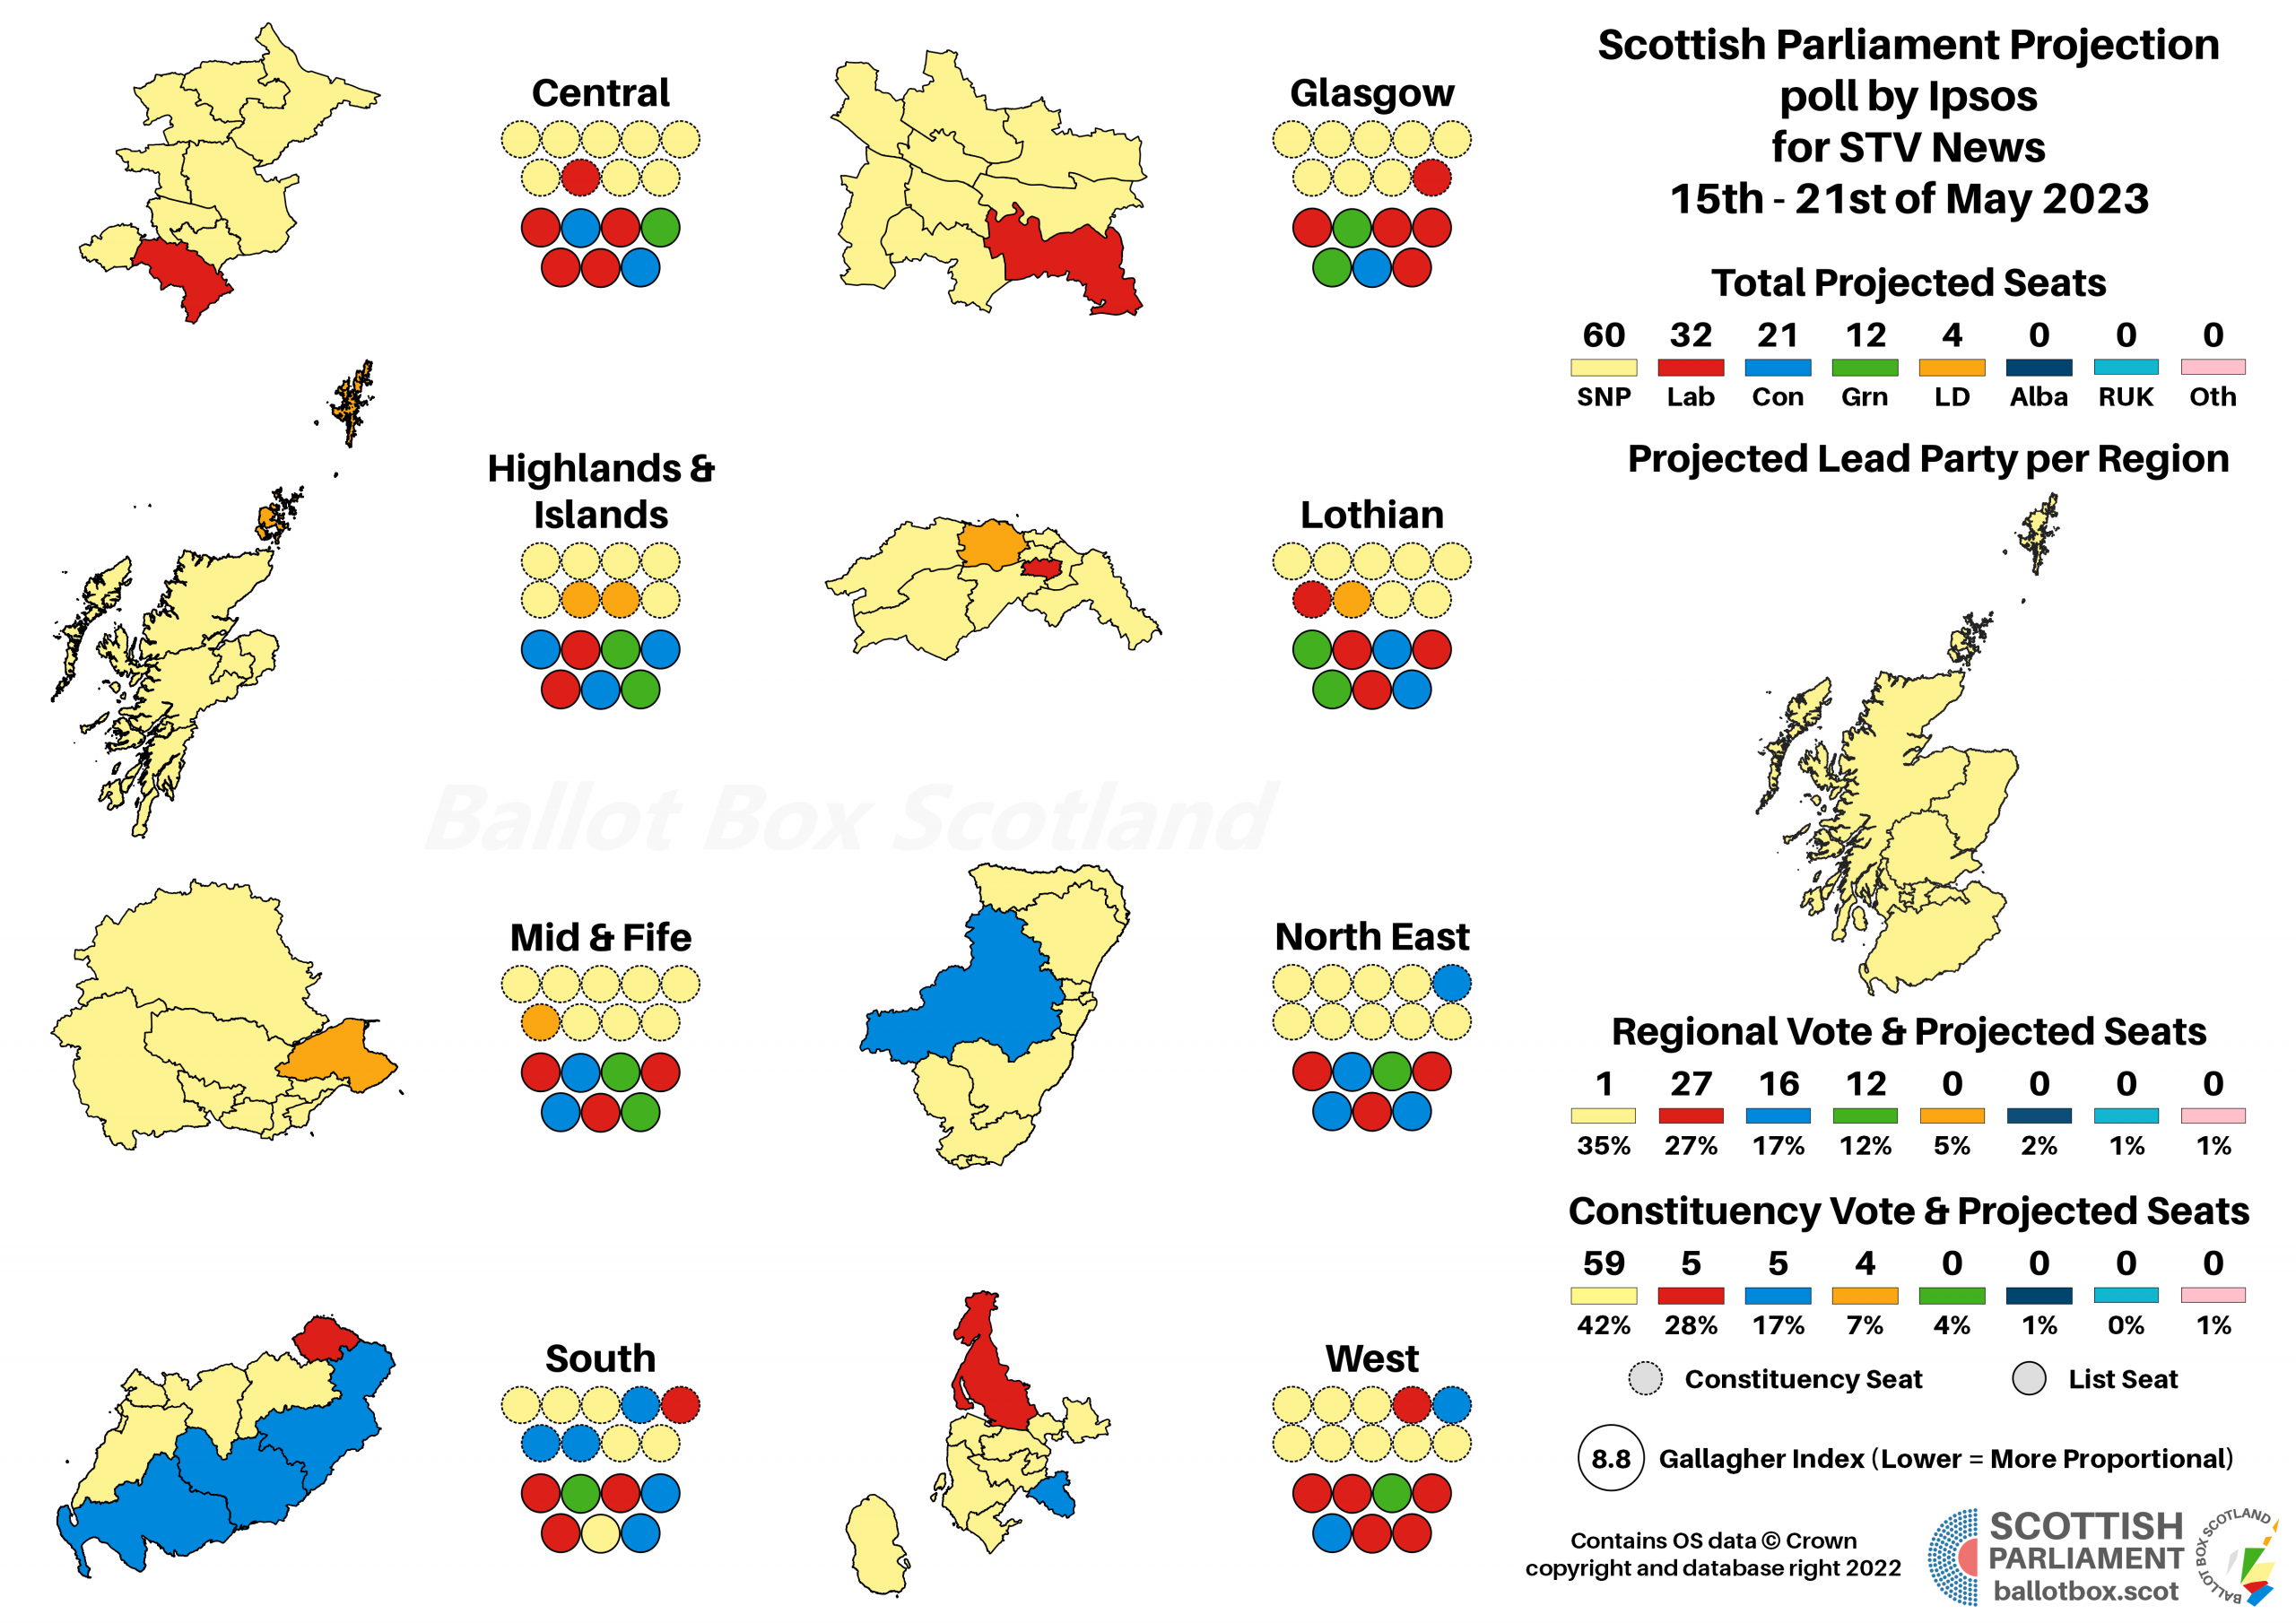

This is a trend-busting comfortable majority for the SNP-Green government, at 72 seats to 57 for the opposition. Whilst this isn’t the only recent poll with a majority under my model, it is the only one looking at all comfortable; compare with the bare-minimum 65 in the most recent YouGov. That’s to be expected when Ipsos are finding higher SNP shares than everyone else, but it’s part of why this poll looks so dramatically out of kilter with everything else. When Ipsos were finding bigger SNP-Green leads at a time everyone had SNP-Green majorities, it was notable but not remarkable. When they’ve got a big majority when everyone else thinks otherwise or by skin of their teeth, that stands out like a sore thumb.
It’s also worth the note that this is the first poll since the 2021 election to have the Lib Dems projected to make no gains on the 4 seats they won then. Most other polling since then has had enough wiggle room freed up that, at the very least, they regained their North East list seat. From a quick scan of other polls this term, Ipsos have been the only pollster with multiple polls not to have had a projection more than 5 seats, so this isn’t that far off their usual, and we can be probably say by this point that low Lib Dem shares are another clear Ipsos house effect.
No surprises that Westminster is another massive slip for the SNP vote, with the gains split evenly between Labour and the Conservatives, plus appearances for Alba and Reform UK. In line with the general theme of this poll, this is the only poll in a while suggesting the SNP would be out of what I’ve been terming their danger zone of a single-digit lead over Labour, where Central Belt constituencies start changing hands at a dizzying rate.
This is perhaps where the poll most dramatically differs from everyone else – an Independence majority not just after excluding Don’t Knows, but even with them in the mix. Although support for Independence hadn’t fallen as hard or far as for the SNP, it has generally been down from the brief spike after the Supreme Court decision, and not very far ahead of 2014. I’d be strongly inclined to view this as an outlier, but being an outlier isn’t the same thing as being complete rubbish!
It's All About the Trends
I think it’s worth a quick bit to talk about why this poll looks so different from other recent polls – and, indeed, the ways in which it isn’t different at all.
Certainly, if we look at headline figures, this does look a fair bit different to what other pollsters are finding. However if we look at the trends, it’s telling the same story. The SNP have been badly damaged by the past few months. Labour are the primary beneficiaries, now clearly the second party once again. The Conservatives have recovered a little from their Partygate and Trussonomics induced collapse. Support for the Union is up, though Independence support is running ahead of Pro-Independence party votes.
In reality, this isn’t any different to what we’d expect from Ipsos generally. They usually run 3-4% ahead of everyone else for SNP and Independence support. It’s just that, as I noted earlier, it looks a lot more dramatic when it’s giving comfortable Holyrood majorities, or indeed putting Yes ahead of No. We need to be aware of this particular house effect, but if we look at polling through the lens of trends rather than as a snapshot, it’s telling the same general story of SNP setback and Independence stagnation.
So what’s causing this difference? Well, some of it might be that Ipsos are telephone pollsters, whilst basically everyone else works by internet panel now. They might be hitting a slightly different demographic as a result, and thus picking up different things. Another part of it may be that, as I understand it, Ipsos are not weighting to get their 2014 IndyRef figures to the 55% No – 45% Yes of that vote. That’s often a point of contention that some pick out, if a poll seems to have more 2014 Yes than No voters, but we do need to remember we’re now almost nine years past the referendum.
It can be really difficult to talk about this delicately, but we’ve also got to recognise that means a lot of those voters are simply no longer with us. Speaking personally, both of my maternal grandparents voted in the referendum, and unfortunately I now no longer have either of them. As sad as that is, and believe me I miss them dearly, it’s also just a reality of human life. And that reality can have a big impact on political attitudes across the population. We know for a fact older voters are more likely to support the Union, whilst younger voters back Independence. We also know this is largely generational – i.e. it’s about the year you were born, not the number of years you’ve lived.
With that in mind, the people who’ve sadly passed since voting in 2014 are more likely to have been No voters than Yes voters. This far on from the referendum, it’s not actually beyond belief to suggest that of those who voted in 2014 and who are still around to vote now, the Yes side of that makes up a very slender majority. We’re measuring the electorate of now, not the electorate of nine years ago, even if it still mostly consists of people who could vote then. There’s still a possibility it’s not actually the case yet, but it’s not as outrageous and appalling to suggest as some may think.
None of this is to say Ipsos is right and everyone else is wrong, or vice versa! It’s just that they are different, and in a way that’s roughly within margin of error of some other pollsters. Emphasis here on some, because we have one pollster (Redfield & Wilton) who is out of kilter in the opposite direction. Especially for the list vote, they’ve found SNP figures significantly below what e.g. Survation, YouGov and Panelbase have found since Humza Yousaf took office. In a sense, Ipsos and Redfield & Wilton balance one another out at the moment – and that’s fine, that’s what poll aggregation is for, and so long as it’s not completely off the wall (see: R&W’s wild Lib Dem figures), we can rely on counterbalancing polls to smooth things out.
Hypotheticals
As ever, the last little bit of analysis concerns those hypothetical and more proportional voting systems that BBS likes to play about with. The use of pure FPTP at Westminster is an affront to democracy, and though Holyrood fares far better, AMS is still deeply imperfect. The examples here simply transpose the poll findings onto more proportional voting systems – the reality is that different systems would of course result in different voter behaviour.
A comfortable majority for the Pro-Independence parties under AMS as it is naturally means that even a slightly more proportional version of the system still splits in their favour.
However, if we brought in an almost entirely proportional voting system, that wouldn’t be the case. This would, more accurately, give a narrow 66-63 advantage to the Pro-Union parties.
Scandinavian Style Westminster
As usual, I’m just going to recycle my usual patter for the Westminster version of this PR model – we should use PR for Westminster, because this would be much more reflective of the electorate than what FPTP would give. That’s estimated by STV to be 44 SNP, 9 Labour, and 3 apiece for the Conservatives and Lib Dems – a rare example of me having a Westminster projection to hand, but a useful one for emphasising how deeply unfair FPTP is.
If you find this or other Ballot Box Scotland output useful and/or interesting, and you can afford to do so, please consider donating to support my work. I love doing this, but it’s a one-man project and takes a lot of time and effort. All donations, no matter how small, are greatly appreciated and extremely helpful.
(About Donations)