Today marks one month until the local elections on the 5th of May, and I’m excited to publish the second part of the exclusive Ballot Box Scotland poll. The local poll data here is part of the same survey conducted by Survation from the 24th to 28th of March, the “standard” parliamentary and Independence bits of which I covered yesterday. Changes in first preferences are versus the 2017 elections.
Local Election Poll
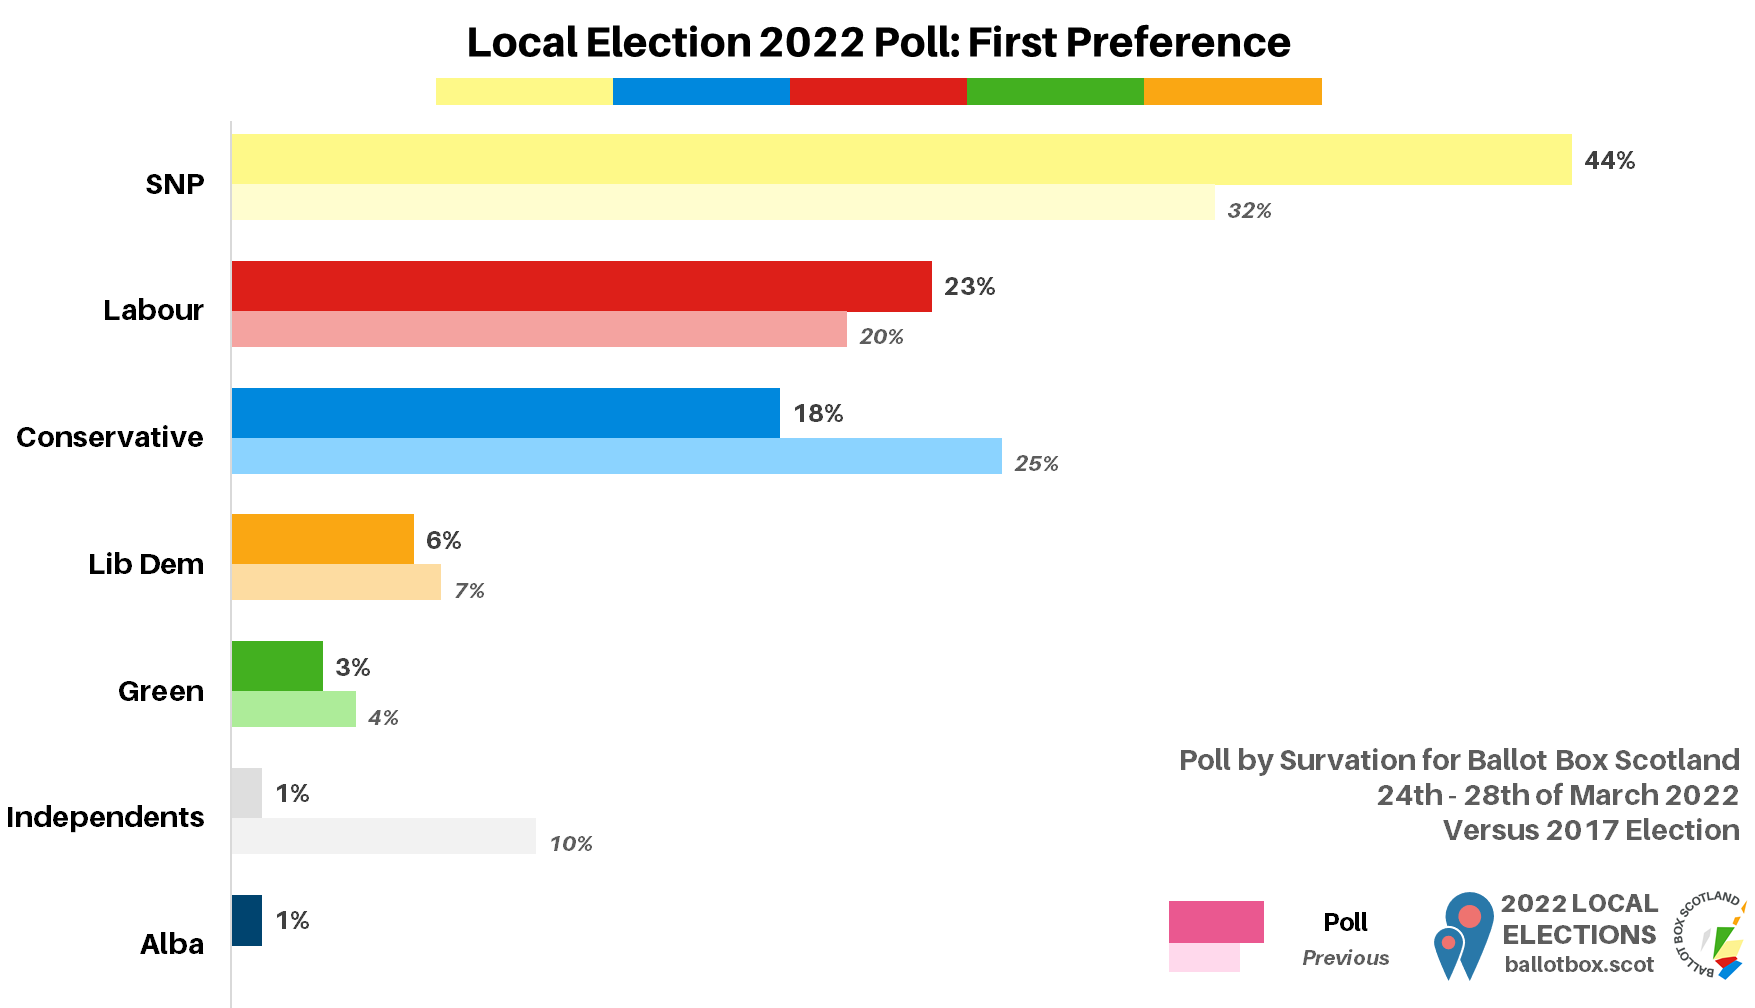
First Preference
Well, this is certainly… spicy! There’s a stonking share for the SNP here which would easily deliver their best ever set of local election results, far beyond anything they’ve ever achieved. Then, as with the Holyrood and Westminster components, there’s a clear lead for Labour over the Conservatives. Some noteable weirdness, I reckon, with those low Green and especially Independent shares. I have some further thoughts on various aspects of this, which I’ll expand on below, but let’s finish up the later preferences.
Important note before we move onto those: the figures here will look very different to what you’ll see in the tables, which remove the people who said they wouldn’t use later preferences. Obviously at an actual election those voters don’t just disappear. All percentages below are therefore relative to the total number of people who said they’d give a first preference.
Second Preference
We can immediately see that more people wouldn’t use their second preference – almost a quarter – than would use it for any one of the parties. Amongst those that would the Greens emerge as the most popular choice, though not too far ahead of Labour.
The Lib Dems prove third most popular, whilst the SNP are fourth most. That likely reflects the constitutional polarisation. Placing fifth out of the Holyrood 5 are the Conservatives, illustrating a lack of transfer friendliness for the party that has often cost them in the past.
Third Preference
There’s further drop off in third preferences, with almost half of those who gave a first preference saying they wouldn’t use a third. Although the order changes, with Lib Dems ahead of the Greens ahead of Labour, this is the same cluster of three parties as in second preferences. As the Conservatives are a more distant fourth and the SNP even further behind, this again points to a degree of polarisation.
My reading here would be that as the two parties most associated with unyielding positions on the constitution, perhaps the SNP and Conservatives both draw the strongest supporters of their side as first preferences, and put off the less heavily invested for later prefs. Meanwhile the other three Holyrood parties, still constitutionally aligned and defined but less rigidly so, prove more capable of attracting a broad spread of voters.
Total in Top 3 Preferences
We can sum all of those figures up (remembering rounding) to find how many people would include each party somewhere in their top three. Though the SNP weren’t highly favoured for later preferences, their first preference lead means they still emerge with 56% of voters likely to consider them highly. That’s relatively narrowly ahead of the 52% who would put Labour in their top three, the only other party to command majority support by that measure.
The Greens then take third place, though getting lots of later preferences does you no good if you aren’t getting plenty of firsts. With 37% they’ve got a bit over a third of voters open to ranking them at least third, whilst the Lib Dems are a bit lower down with 31%.
Bringing up the rear for the Holyrood 5 favourability rankings are the Conservatives. Only a bit over a quarter (27%) of voters would pick them as a first, second or third preference. Though not highly favoured, they’d at least have enough first preferences to win plenty of seats. The same isn’t true of Alba, who despite having three chances to be picked, feature in only 7% of voters top preferences.
Things That Make You Go "Hmm"
I reckon the first preference findings here will have turned a few heads, but I’m viewing this with a lot more caution than the rest of the poll. Polling always comes with caveats around margins of error and confidence intervals, and should never be treated as gospel anyway, but everything else was in the realms of what I expected, and this was a surprise. It’s important to emphasise that isn’t a judgement on Survation as the polling firm – they’ve done a great job pulling this poll together for me!
Instead, I think there’s simply a difficulty in accurately gauging local elections via national polling. By chance, I spotted Chris Curtis from Opinium making that point on Twitter just before I was expecting my poll to go into the field. He noted that a long-running bugbear of polling is working out who will actually vote in the first place, which has a huge bearing on accuracy. I’m also aware that another pollster, ComRes, simply believed it wasn’t possible to poll local elections properly, so don’t.
That’s going to impact every aspect of the local poll question, but per my comments earlier, there are three particular bits that I’m taking with an entire salt mine.
Suspicious SNP Success?
Across the four key parts of voting intention in this poll, the only one not to show the SNP in the mid-40’s was the Holyrood list. It’s therefore easy to view that as the outlier, and the rest as representing a “true” measure of SNP support. I have to admit I’m sceptical that’s the case. The evidence of various recent elections is that the SNP’s support in First Past the Post elections is exaggerated.
They haven’t won less than 45% of the Holyrood constituency vote since 2011, but they’ve never crossed into the 40’s for Local or European elections in the same period. Even when they were at their (recent) lowest in 2017, their Westminster share outstripped their local by 5%. That’s part of why I tend to view the SNP’s local share as likely to come out closer to their 2021 Holyrood list vote than this, which almost matches their polled constituency figure.
If the SNP’s share is much lower than this next month, one possibility is precisely as Curtis suggested in the linked tweet earlier – pollsters not picking up that SNP voters have least propensity to vote. Although in democratic terms I’d be hoping for a further increase in turnout this year, in line with Holyrood’s boost last year, it’ll still be much lower than any parliamentary level. In addition, as a party with a strong presence nationally, they’ll be impacted by this second point…
Invisible Independents?
Although I knew it might be hard to capture, I’d specifically asked for Independent to be included as an option in the poll. Independents always do well in local elections, especially in rural Scotland, so I thought it was important to do so. As it turned out, they barely registered, with just 1%. Even if you’re not convinced by either the SNP or Green segments, this figure is obviously just not right.
Interestingly enough, there has been something of an exodus of Independents this year, particularly in Highland. There are far fewer standing, or re-standing. That’s likely to impact on the overall share for Independents, and if I was betting I’d say they could fall below 10% for the first time, potentially as low as 7-8%.
That’s still a sizeable chunk of the vote though, and it has to come from somewhere. Given that it’s rural areas that are most strongly Independent, you’d expect that to eat away at both the Conservative and Lib Dem votes the most. The SNP would also, as I said, be substantially impacted to given they are strong everywhere. The best Labour and Green areas by contrast are relatively rarely home to Independents.
Grim Greens?
Given they won 4.1% in 2017, 3% would be a weak result for the Greens, but it seems like an underestimate. Now, I know some readers will immediately default to “bah, you’re only saying that because YOU’RE a Green!” I want to again emphasise that on Ballot Box Scotland, I put massive stock in being truthful and accurate. It would serve absolutely no purpose for me to deliberately misrepresent things – it would damage my reputation, and also my income.
In addition I find being shouted at online very, very unpleasant and generally try to avoid giving people reasons to do so. The fact I’m writing this in full knowledge some people will be pretty nasty to me as a result speaks to how much I think this is a useful and accurate point to make. This is based on cold, hard evidence, which is as follows:
Firstly: Tactical Green votes at Holyrood are limited, and would have made no sense before 2016, yet the party always had MSPs. Last year, the Scottish Election Study found just 10% of Green list voters were doing so tactically, versus 62% who were basing their decision on policies. In addition, across the 12 constituencies they contested, they won 7.8% of the constituency vote versus 10.3% of the list. Extrapolated nationally, that’d give roughly 6% of the constituency vote had they stood everywhere. That’s a lot higher than constituency polling finds.
Secondly: Green performance at local elections has previously tracked Holyrood results closely, when you account for not standing in every ward. In the 218 of 354 they contested in 2017, their share was 5.9%. Overall, in directly comparable areas, the Greens preserved roughly 80% of their vote share from Holyrood 2016 through to 2017. This effect is strongest where the party is – see 10.2% to 8.7% in Glasgow (85%) and 12.9% to 12.4% (96%) in Edinburgh.
Thirdly: We’ve also had local by-elections aplenty, and this is where the most useful, local election specific evidence comes from. Through 2021 and at the start of this year, there were 23 by-elections. The Greens contested 18, across which they won 7% of the vote. In only three of those did they win anything less than 4% of the vote, all in weak Green areas.
Fourthly: European elections have likewise typically been higher for the Greens. That’s been true even when, for example, some pre-election polls ahead of the 2019 EU election put them on 3-4%, before they went on to win 8%. Combined with this poll and my point about Holyrood constituency polling, the case I’m building here is that perhaps using Westminster as the core reference point for everything, including polling, doesn’t work for gauging Scottish Green support where it actually matters in PR elections.
I know this section has went on for a long time, but that’s because I’m trying to lay out as much evidence as possible, so you can see my position is well-founded. Some of you will doubtless still just go “biased!”, but I hope most folk can see why I’m viewing this with some scepticism. At a time when Greens are polling the best they ever have, and a year on from their best ever Holyrood result, going backwards locally would seem unlikely. It does no one any favours to refuse to understand a party’s support base just because you don’t like them, and here at BBS I’m all about improving people’s understanding of politics.
Now – having paused to catch my metaphorical breath – none of this is to say that May couldn’t prove me wrong. I would be glad to be proven wrong, because then it’s a data point that I can use in future! But if my scepticism is proven justified, it might prompt some reassessments of how we approach political coverage here.
Attitudes Towards Local Government
Moving on from the party political aspects of the local polling, I also asked a few questions about local government more generally. As with proportional representation, folk may be aware that BBS takes a position supportive of smaller, more local councils. That’s investigated in more detail in the BBS-adjacent New Municipalism project.
Effectiveness
This started out with a very simple question about how folk felt about local government in general: “Thinking about your local council, how effective do you think it is at managing services and representing your local area?”
Much to my surprise, bang on half (50%) of respondents reckoned their local council was effective, compared to 42% who thought it was ineffective. Councils get a lot of stick, so I was frankly expecting this to be much more negative. However, note that the strongly negative feeling is more widely felt than the most positive.
Size of Councils
Participants were then asked outright what their view on the geographic size of Scotland’s councils was: “Some countries have different sized council areas to Scotland, for example separate councils for larger towns and rural districts. Which of the following statements comes closest to your view?” (The option statements were longer, but I’ve distilled them down to their key meaning.)
The findings here are much less surprising, with almost half (48%) reckoning the current councils are about right, compared to just under a third (32%) who felt they should be more local. Only 6% thought they should be larger. As much as I personally support more local governance, it’s not an issue high up most people’s agenda, and I didn’t expect it to be. On top of that, local government is by its very nature local, so it’s unlikely folk are really aware just how oversized our councils are.
Effectiveness of Smaller Councils
Notwithstanding that there wasn’t mass enthusiasm for this to be the case, the poll finished by asking about how effective smaller councils would be: “If councils in Scotland represented smaller areas, how effective do you think they would be at managing services and representing your local area?”
In another instance of just the general weirdness of the voting public, by far the largest group of respondents (42%) said they thought smaller councils would be more effective, even though in the previous question only 32% had said they felt councils should be smaller. I’m fascinated as to the roughly 10% who will presumably therefore think they’d have a better council if it was more local, but nonetheless don’t want that to be the case!
Anyway, a further just over a quarter (26%) didn’t feel it would make any difference, and just shy of a fifth (19%) thought they’d be less effective. I reckon that suggests there’s a bit of an open door to be pushed at there, though admittedly a campaign of local government reform is never going to set the heather alight.
And that wraps everything up for the first ever Ballot Box Scotland poll! This was a huge step forward for this project, and I’m immensely grateful to the very generous supporters who contributed to the crowdfunder which enabled me to commission this poll. Moving forward, I’d love to have more polling carried out, and I’ll be working out whether the degree of normal income from BBS enables me to do so by itself, or with further crowdfunders to augment it.
If you appreciate my work and can afford to do so – and goodness knows that right now money is tight for everyone! – please do consider chipping in via my usual donation link below. Local election coverage pieces will resume next week with my series of party profiles, so check back then!
If you find this or other Ballot Box Scotland output useful and/or interesting, and you can afford to do so, please consider donating to support my work. I love doing this, but it’s a one-man project and takes a lot of time and effort. All donations, no matter how small, are greatly appreciated and extremely helpful.
(About Donations)