After a blissful rest period with nary a poll in sight following May’s election, the first pollster out the gate since then has proven to be Panelbase, commissioned by the Sunday Times. This analysis piece was rather delayed because Panelbase really excelled themselves in terms of keeping the tables back.
They are notorious (well, to me) as the pollster that always take the longest to publish tables, but given we’re ages away from any election, I thought a few days wouldn’t be a real problem. It actually took over a week, and I’m pretty sure (albeit I didn’t actually get a response) it was my email enquiring after the tables that led to them appearing later that day. It wasn’t really all that worth waiting for, as we’ll get onto!
Folk who have followed BBS throughout the election (and earlier) may notice a substantial reformatting in this piece. Hopefully it all works neatly – please just let me know if anything looks wrong!
Display format for figures:
- Party/Option – Vote% (Change vs last poll by agency / vs last election or referendum)
Note that Holyrood figures are, of course, purely versus the May election.
Regional Vote
For folk looking for deep meaning in this poll, there really isn’t any. Yes, the SNP and Labour are down versus May. Yes, the Greens and Lib Dems are up. Yes, the Conservatives are static. In all cases, the changes are entirely within the margin of error.
In other words, it’s mathematically quite likely there has been next to zero change since the election. That should hardly come as a surprise, given how little time has passed, and how little any new Parliament would be able to do prior to breaking for recess!
One little note is that I’d been expecting that once the tables came out they might include a figure for Alba. That wasn’t the case – evidently, either Panelbase or the Sunday Times decided the party’s lacklustre performance in May doesn’t merit any further attempts to gauge their support.
Constituency Vote
Again, there’s really nothing much we can read into these figures. The SNP, Labour and Lib Dems are down, but it’s within margin of error. The Greens and Conservatives are up, but yep, that’s margin of error.
I appreciate that’s a little bit of a cop-out analysis, but it’s true! If you were hoping for great excitement just a few weeks after the election, I’m afraid that was never likely.
Seat Projection
Projecting that into seats might give us something like this:
Please see this page for how projections work and important caveats.
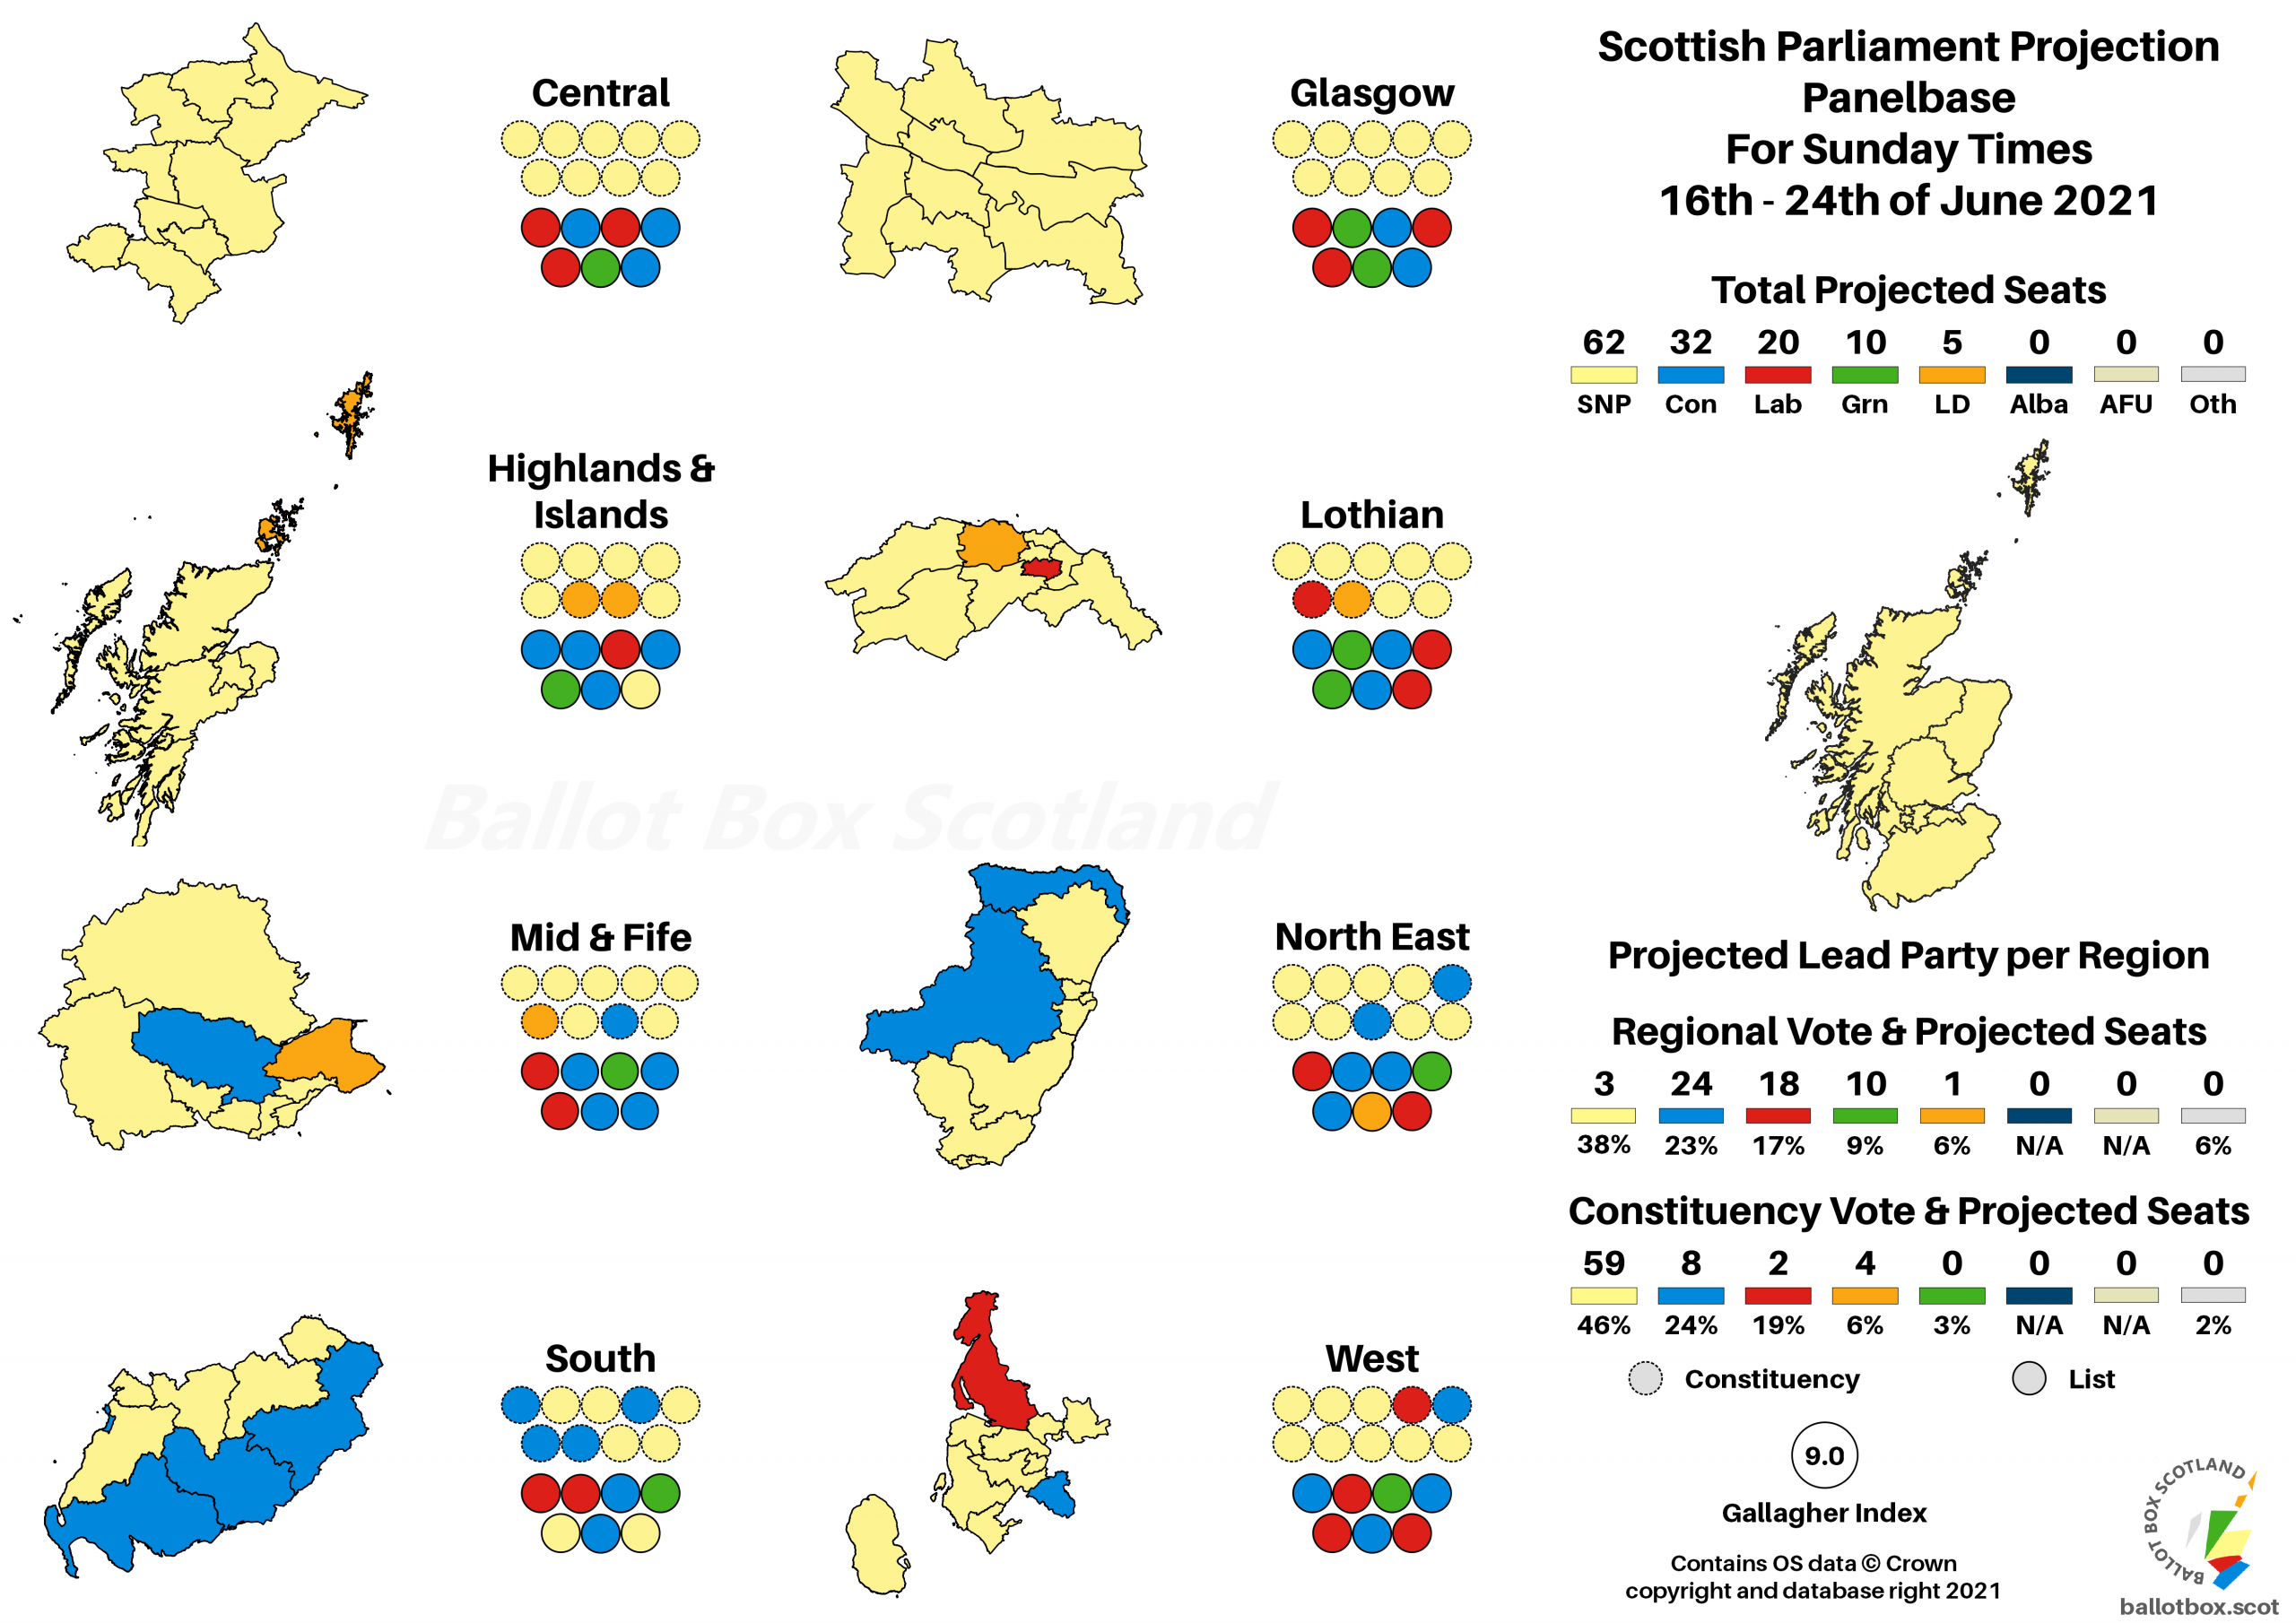

Although this is all within margin of error, there were quite a few close calls at the election, so even these small shifts tip a few seats. The Conservatives pick up a handful of constituencies, though that only leads to a minor net effect on their seats. Denied a seat in South and a second in Glasgow by fractions of a percent, the Greens naturally project to gaining those seats in this scenario. And the Lib Dems weren’t a million miles off that North East seat they lost, and it’s the first one they’d be expected to regain with any future growth.
Although Panelbase were pretty prolific during the election campaign, by my records this is actually the first Westminster voting intention they’ve had since November. That’s why this looks slightly more dramatic than the Holyrood figures, at least for the two largest parties. The SNP were riding at their highest at the end of 2020 whilst the Conservatives were in the (relative) doldrums, so this mostly just reflects catching up with what has happened since then.
As with the Holyrood Regional VI, I was expecting a smaller party showing here, but for the Greens. Oddly, despite them being included in every other Panelbase poll since the 2019 election, they were subsumed into “Others” this time. Long story of this entire poll short then is I could therefore have written the analysis piece quite happily last week even sans-tables, given I had all the data.
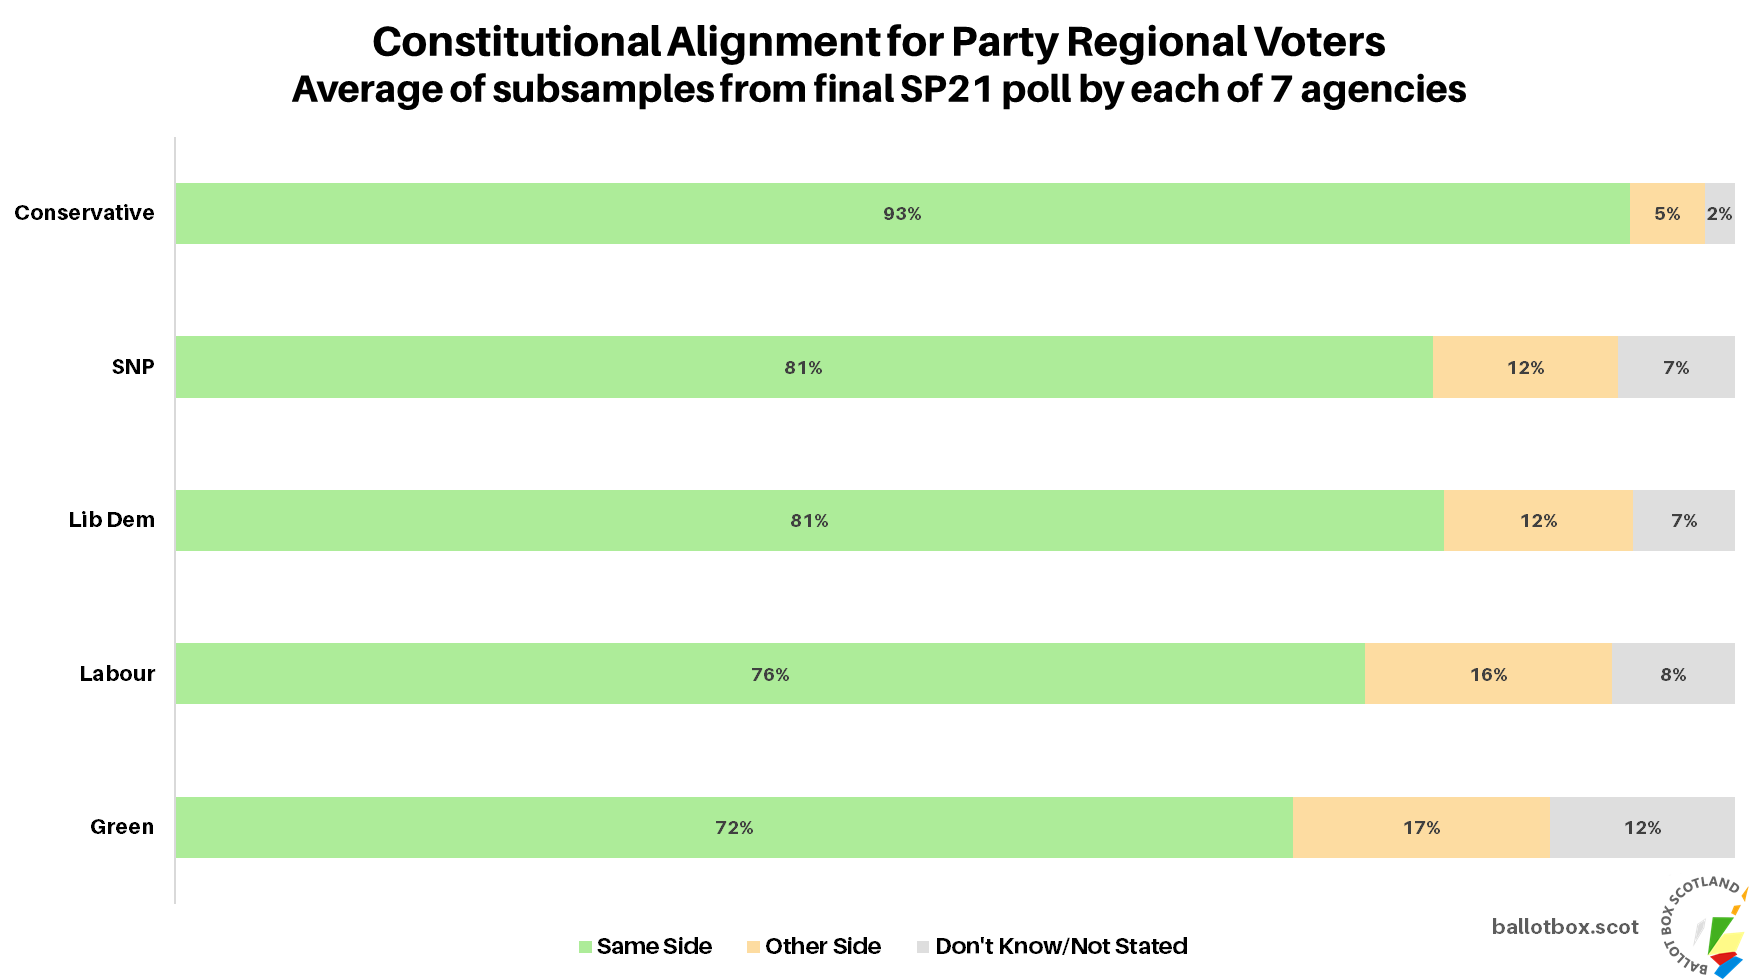
This poll continues the trend we saw at the end of the Holyrood campaign of movement back towards the Union. Though the current position is still within the margin of error, the tilt has now consistently been Pro-Union. Independence is still polling higher than the 2014 result, and combined with the Holyrood arithmetic that’s likely to keep the issue on the agenda throughout this term, but the year of Yes leads has firmly ended.
Council Area Projection
Please see this page for how projections work and important caveats.

On a simple Uniform Swing versus 2014, the Union might be leading in 23 councils, down from 28. Meanwhile, Yes is possibly ahead in 9, up from 4 at the referendum.
Timing of a Referendum
A plurality of respondents don’t want there to be a referendum within this term of parliament. However, there is an overall majority for holding one at some point in the next five years, though less than a fifth of Scots think it should be in the next year.
Hypotheticals
As ever, the last little bit of analysis concerns those hypothetical and more proportional voting systems that I have a bee in my bonnet about here at BBS. The fact Westminster uses pure FPTP is an affront to democracy, and though Holyrood fares far better, AMS is still deeply imperfect. The examples here simply transpose the poll findings onto more proportional voting systems – the reality is that different systems would of course result in different voter behaviour.

As this one boosts the number of list seats and uses a more proportional mechanism for apportioning them, the SNP are in a slightly weaker position than under our unreformed system. The combined SNP-Green share gives them a handful more than is necessary for a majority, thus delivering the same constitutional tilt to the chamber.

This model goes even further and totally strips away the SNP’s advantages from both FPTP and the regionalised nature of the list seats, whilst everyone else benefits from increased proportionality. There’s a very slender pro-Independence majority here, with the bare minimum 65:64, reflecting how finely balanced the electorate is between each camp.
Scandinavian Style Westminster

Note that the comparator here is only versus this same model in the last poll, as I don’t do pure FPTP projections. The differences with FPTP however would be extremely stark, this giving the SNP far fewer seats – as is democratically appropriate. We can see the effect of that shift since the distant November poll in seats shifting away from the SNP and Labour towards Conservatives and Lib Dems.
If you find this or other Ballot Box Scotland output useful and/or interesting, and you can afford to do so, please consider donating to support my work. I love doing this, but it’s a one-man project and takes a lot of time and effort. All donations, no matter how small, are greatly appreciated and extremely helpful.
(About Donations)