Myths-chief Making
Long term followers of Ballot Box Scotland will know that there are several myths and misconceptions about the Scottish Parliament’s Additional Member System (AMS) of voting that drive me up the wall:
- “Constituency MSPs are personally elected and List MSPs are unelected!” Complete rubbish, you know fine well Joe Bloggs MSP got elected because of the party logo next to his name. You know this because your opinion on whether it’s good or bad he was elected is based on that logo too.
- “The voting system was specifically designed to prevent the SNP from winning a majority!” Two unrelated truths being merged into conspiratorial rot. The Lib Dems wanted proportionality, Labour wanted to secure their own dominance, AMS seemingly achieved both goals.
- “The Greens only win seats due to tactical votes from the SNP!” The data from studies and other elections clearly points to this being untrue. You also rarely see this kind of complaining about vastly more rampant tactical voting under First Past the Post.
One of the most frustrating though is the common claim that by winning their famous majority in 2011, the SNP “broke” the semi-proportional AMS. To be clear, it absolutely is possible to “break” the system by winning more constituencies than your correct proportional share of seats. Where this happens in other countries with similar systems it’s known as an “overhang”, and they compensate for it. We don’t, and as I’ll get onto shortly, that can have huge consequences.
However, that didn’t happen to a serious degree in 2011. In fact that election was the least broken result seen at Holyrood up until that point, and remains jointly so with the 2016 election. It’s also important to remember that AMS is meant to be regionally rather than nationally proportional. Each of our 8 regions is a separate voting area and how people in South vote is irrelevant to what MSPs Glasgow elects and vice versa. The mere fact the SNP won list MSPs in 7 of the 8 regions in 2011 tells us those results were correctly proportional: you can’t win list seats you aren’t proportionally entitled to!
Only in one region did the SNP fail to secure a list MSP: Lothian. If you run the figures, it turns out that the SNP did overhang there. They were due 7 seats yet won 8 constituencies. That did Shirley-Anne Somerville in, as her seeming dead-cert list placing meant nothing when she ended up their only constituency loser in the region. More significantly, it knocked the Lib Dems out of the list seat they were proportionally entitled to. That’s just one seat different out of 129 though.
Why are you booing me? I'm right
When you press journalists and commentators on this, I’ve found they can really bristle. “Ah but it’s a proportional system and it’s not supposed to give a majority!” Sure. There’s a vast difference between “unexpected” and “broken”, however. In 2011 alone, both Spain (a single party) and Croatia (a coalition standing on one list) also elected majority governments on vote shares not dissimilar to the SNP, despite purely proportional systems. Proportionality makes majorities hard, it doesn’t make them impossible.
Naïve as it may be for me to say in 2025, your job shouldn’t be to sensationalise things for clicks. It should be to help the public understand what’s going on. The fact it’s so easy to check this stuff really adds to my frustration. If you’re writing a column or article, you absolutely have access to spreadsheet software as well. Plug the numbers in! You can easily work out for yourself the “AMS Ideal” result: just ignore the constituencies and do all seats in each region off the list vote, then compare with the actual outcome.
Overhang in Previous Scottish Parliament Elections
If anything, the “SNP broke the system in 2011” myth massively lets Labour off the hook for deliberately putting their finger on the proportional scales at the outset. The total advantage of 6 seats the SNP have squeezed out of AMS over three elections doesn’t even equal the 7 Labour got in the first election alone. There then wouldn’t have been a majority for the Lab-Lib Executive in 2003 (they won 67; they should have had 60) without overhanging. Meanwhile, none of the SNP’s overhangs have had any bearing on government formation… so far.
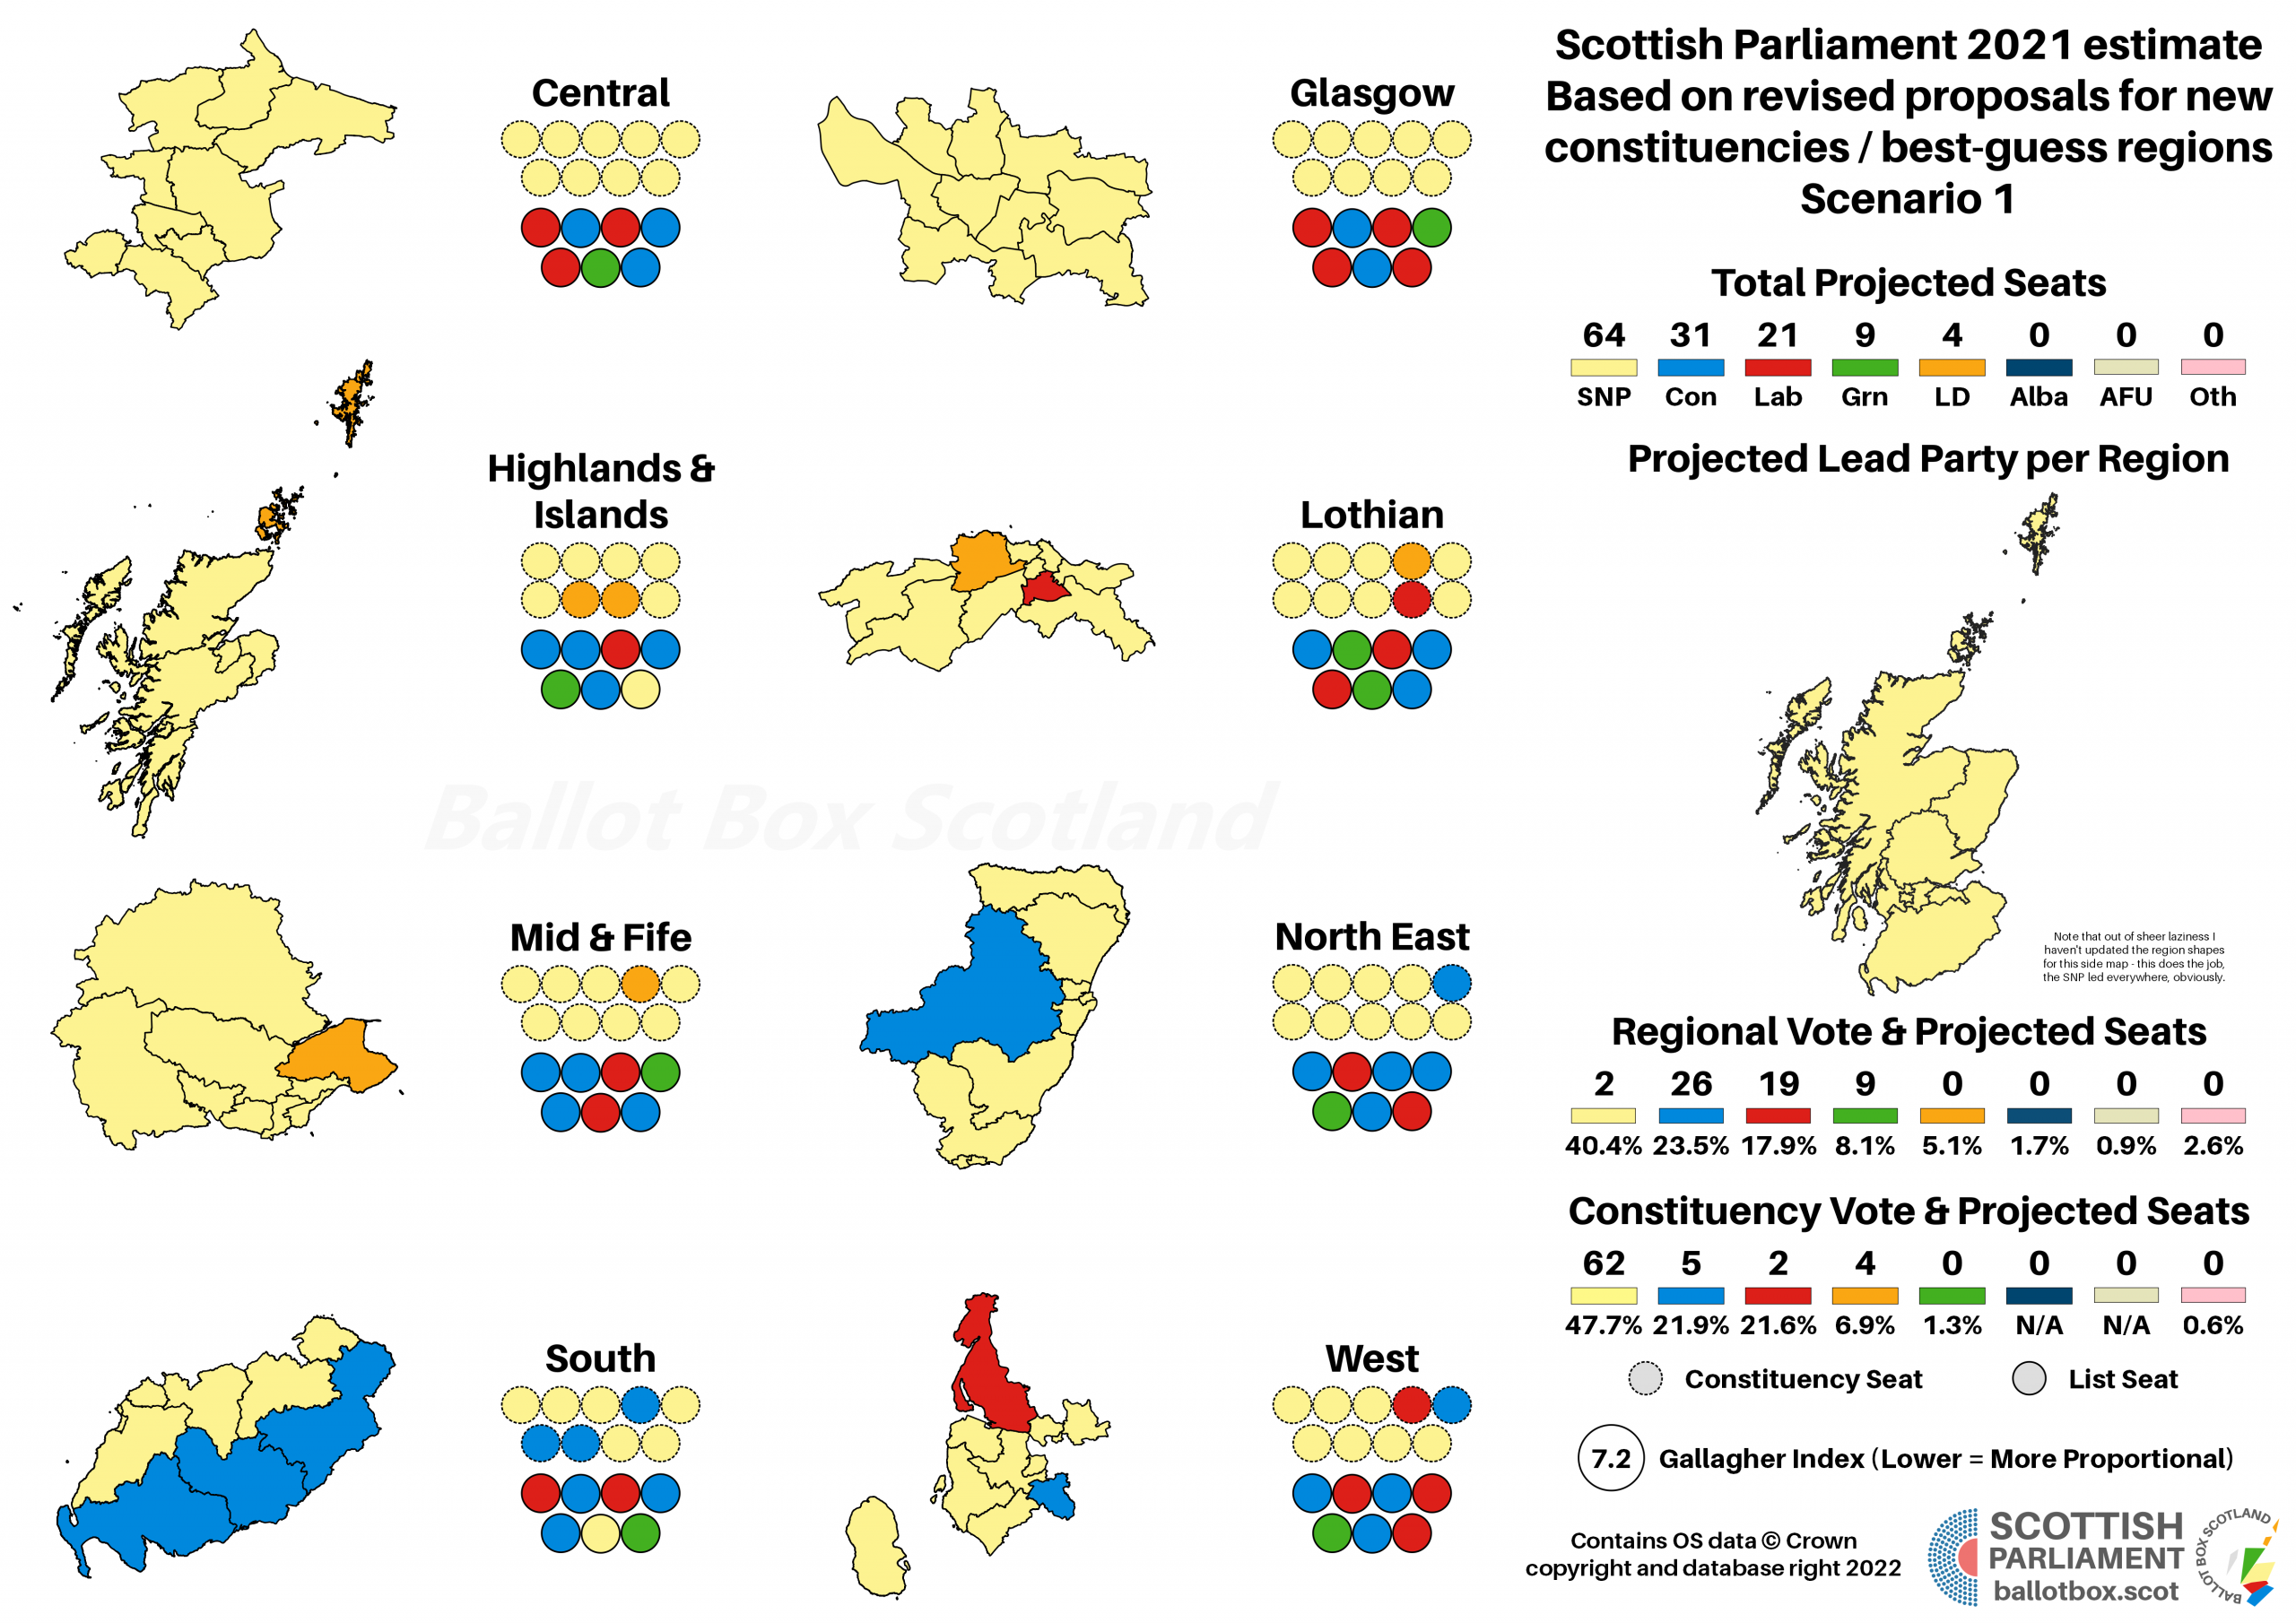
How the SNP Might Break AMS
Current polling suggests that could change next year. If we take the average at time of posting, which is the 18th of June datapoint, we can see that despite a huge decrease in the SNP’s list vote (the vote driving proportionality), their seat share is only down very marginally on 2021:
Regional Vote (average on 18th of June 2025)
Seat Projection (based on average on 18th of June 2025)
Vote Change vs 2021
Seat Change vs 2021 (New Boundaries)
Given that our system is meant to be proportional, this simply doesn’t reflect how people are intending on voting. As much as it may upset some people to hear this, the SNP absolutely should be losing huge numbers of MSPs on polling like this, and there should not be a Pro-Independence majority. The fact that there is one is, of course, a rich irony, rooted as it is in the majority role for FPTP within AMS.
For all that it’s a myth to say the system was designed to specifically stop the SNP winning a majority, it’s true to say Labour accepted this form of PR because they expected the FPTP element would sufficiently secure their dominance. So it proved in those first two elections, and even in 2007 they won a narrow majority of constituencies, but that wasn’t to last and they’ve been suffering the consequences for 15 years.
Especially given their continued support for FPTP at UK level, Labour have little right to complain. They can however rest assured that I’m doing it for them, as a lifelong supporter of the fundamental principle of PR, regardless of who it benefits (or doesn’t). What’s even more remarkable about this is that even if you disagree that the outcome should align closely with the List vote, and think there should be a big role for the Constituency vote, that simply doesn’t justify this outcome either.
Averaged SNP Vote and Seat Shares (June 2024 to June 2025)
There have of course been fluctuations over the period, but see how the SNP’s vote shares are nigh on identical now to where they were last June. Their constituency vote is exactly the same, and their list vote down by just 0.4%. Their projected share of seats however has increased by nearly 15%. Given they started this period expected to win 31% of seats, that means in relative terms they’re doing one and a half times better. How on earth has that happened? That’s where what’s happening to their closest competitor comes in.
Averaged SNP Leads over Labour (June 2024 to June 2025)
Unlike the chart showing vote shares, this one actually shows upwards movement for the SNP on all measures, since their lead over Labour has mostly grown since last year. Or, rather, Labour’s Scottish revival has gone fully into reverse over that period. Once that put the SNP back in front, there was a period where their lead in seats was only a little higher than their lead in votes. That was basically reflective of the fact that the proportionality of AMS isn’t perfect, but it was still working pretty well.
The tipping point according to my model seems to have come in early December at around a 7% constituency lead (remembering the effect of my model redistributing the Green vote in most constituencies). At that point their seat lead rockets up to near enough 16%. It then goes on to peak with a constituency lead of 14% leading to a projected seat lead of 30%. Although it’s ticked back down a little since, it’s still an extremely healthy lead.
Projected Overhang (based on average on 18th of June 2025)
What this all means is that right now, the SNP are projecting to an absolutely democracy-defying 18 seat overhang. That’s one in seven seats, and comes at the expense of 7 Reform MSPs, 5 Labour, 3 Conservative, 2 Lib Dem and 1 Green. That’s completely ridiculous and not how the system is meant to work. It’d be equivalent in one election to the total overhang across the first five (1999 up to 2016)!
In case it hasn’t been clear enough already, my frustration with this isn’t because I’m specifically unhappy with the SNP benefitting from this. It was absolutely absurd when Labour doubled their seats across the UK on a static vote share last year. It’s just as absurd the SNP are doing 1.5x better in projected seat terms when their share of the vote has similarly not ultimately moved over a period of a year. If you truly, genuinely believe in democracy this should outrage you regardless of party: voters, whether you agree with their choices or not, deserve to have their views represented and voices heard.
I simply do not accept that even within the confines of FPTP these kinds of outcomes should be considered legitimate. Indeed, whilst it’s hardly going to have people out on the street in protest, it’s the kind of thing that absolutely wrecks people’s trust in politics and makes them disengage entirely. If mass withdrawal of support barely dents a party’s number of MSPs, how on earth else can you hold those parties to account?
A Case in Point
It’s all well and good pointing to overall figures, but it’s useful to really dig into how exactly the SNP’s constituency dominance could break the system if it’s not backed up by regional vote share. I’ve pulled out the data for the North East region from the current (as of the 18th of June) projection to serve as a little case study, as it’s often the worst affected region. First things first, let’s look at how the seat allocation process would run for ideal proportionality under AMS:
North East Projected List Vote Share (based on average on 18th of June 2025)
North East Seat Projection (Actual AMS, based on average on 18th of June 2025)
North East Seat Allocation (AMS Ideal, based on average on 18th of June 2025)
I appreciate this is a little hard to follow by the time it gets to later stages, when seats are determined by pretty fine margins! Even if you can’t quite see who is on top at each point, you can eyeball who won a seat in a given round by watching for who drops in the next round; e.g. since Labour drop between rounds 5 and 6, they must have gotten the 5th seat. What this shows us is that on the current projection for the North East region, the SNP should be due 5 MSPs.
However, the constituency results are projected to be 9 SNP and 1 Conservative. That’s a chunky four seats more than the SNP’s fair share, which has to come from other parties. You don’t actually need to do any further arithmetic to work out who loses out, you just discard the final four non-SNP winners from the above process. For clarity though, this is how it would shake out (note I’ve shown this as rounds 11 through 17 for comparison with the above, counting the constituencies as the first 10):
North East Seat Allocation (Actual AMS, based on average on 18th of June 2025)
See how this version only gets as far for the non-SNP parties as what was round 11 on the AMS ideal chart? Add in the fact that the SNP win two further rounds (12 and 16) in the ideal version, and that means the process cuts out four rounds short. In other words, the parties that fairly and proportionally should have won seats at rounds 13 (Labour), 14 (Conservative), 15 (Reform) and 17 (Reform) don’t. Overall, the SNP end up with just over half of the seats in the region, when they should have had under a third – tied with Reform.
You can see the risk this poses to smaller political parties in particular by where the Lib Dems and Greens fall in the order here. In the ideal version they are so comfortably positioned that there are 7 further rounds (5 of them with non-SNP winners) after the point they would win their seats. With the constituencies so skewed though, they end up with the 5th and 6th list seat respectively, and the Greens only by a hair over Reform. With 17 seats up for grabs, 7.6% of the vote should be a guarantee of a seat, not a close shave (the SNP winning Aberdeenshire West and a handful more Reform votes throw them out in this scenario).
Final Thoughts
With 10 months to go, there’s plenty of space for things to change. At the time of writing, Labour’s polling average has picked up very slightly from their recent low, and the SNP’s has slipped a little from already pretty marginal recovery. Perhaps that trend could continue, helping to erode the SNP’s severe overhang and restore the intended proportionality. If Labour make up even more ground, refer back to 1999: they could end up with their own overhang, something that Edinburgh and Lothians East is especially at risk of.
However, if current polling holds right up to the day, we would be looking at the most disproportionate result in the history of the Scottish Parliament. It’ll be much less bad than pure First Past the Post, and for that we should be thankful, but that’s not good enough. Difficult as it would be to get consensus at Holyrood for reform (where it’d need two-thirds backing), even the risk of this should have any true democrat considering replicating the highly proportional system of neighbouring countries like Norway.
If we did have a more proportional outcome, either by the votes delivering that under AMS or by a better system in the longer term, right now that would make for a very difficult parliament to govern. Don’t fall into the trap of thinking it’s better an unfair but more workable outcome than a fairer but chaotic one. Voters need to feel their vote counts, and our political parties should be capable of winning seats on the strength of their arguments and message, rather than relying on a poorly designed system to work in their favour. Scottish Labour at least should have learned that lesson in 2011, and if they haven’t, they may yet live to further regret it.
If you find this or other Ballot Box Scotland output useful and/or interesting, and you can afford to do so, please consider donating to support my work. I love doing this, but it’s a one-man project and takes a lot of time and effort. All donations, no matter how small, are greatly appreciated and extremely helpful.
(About Donations)