Not that you could tell it from the weather in Glasgow, but summer is in full swing, which means ordinary parliamentary politics is on hold. There aren’t many polls cropping up for Scotland, by-elections are months away, and the usual summer silly season has plenty happening but none of it within Ballot Box Scotland’s wheelhouse. It therefore seemed like the perfect time to take a little delve into something I’ve been wanting to look at for a while: what if the Greens adopted the habit of the other four main parties, and stood in every constituency?
The Green Gap
For Scottish Parliament elections, the Greens are widely known not to have ever contested very many constituencies at all, and indeed to also have a general tendency to be absent for UK Parliament votes. Unfortunately, the resulting data deficit combines with garden variety partisanship to mean the Greens remain probably the most poorly understood of Scotland’s major parties, and certainly that’s the case in terms of where their support is coming from and why. Yet explanations and data are there for those who actually care to look, and we can use that to build a clearer picture than you might initially think possible.
Why don't the Greens contest many constituencies?
Deposits. It’s as simple as that. Everyone reading this is probably familiar with the £500 deposit you have to pay to get on the ballot in the first place in both Scottish and UK Parliament elections. If you win at least 5% of the vote you get it back. This is such a weel-kent aspect of our politics that to “lose your deposit” is understood to mean a party or candidate has done badly – especially if it’s one of the major parties.
However, tying ballot access to cash deposits is fundamentally unfair and undemocratic. The Electoral Commission itself, the body charged with ensuring our elections are conducted fairly and legally, has recommended that they be abolished, and I’ve written about an alternative myself previously. This has been resisted by both the Conservatives and Labour, ostensibly because deposits help prevent frivolous candidates from standing for election.
This is obviously nonsense. You only need to look at any UK Parliament by-election, of which we had three quite recently, to see that the circus quite regularly comes to town despite deposits – and let’s not even begin to talk about the number of clowns that stood for London Mayor in 2021 despite a whopping £10,000 deposit! In reality, £500 is a near-nothing cost for a frivolous vanity run by an independent or a party not seriously intending to win. Even for a small handful of seats, this is relatively easy to cobble together. But for serious smaller or newer parties, it’s not just £500, because it applies separately to each constituency.
To contest all 73 constituencies in the Scottish Parliament therefore sums up to £36,500, plus another £4,000 to contest all eight of the regions, for £40,500 in total. And crucially, the whole thing about a deposit is that you have to pay it up front. Even if you’re confident you’ll get some or all of that cash back, it’s not available to spend during the election campaign itself. Again, for frivolous vanity runs, this doesn’t matter as they aren’t trying to win. But for serious competitors, it means less money available to pay staff, print leaflets, run advertising, or produce broadcasts.
The effect of deposits for smaller parties is to both make it harder for them to get on the ballot in the first place, and then when they are it has quite literally come at the expense of actual campaigning that would win votes. Whether the larger parties admit it or not, they like it this way. It benefits them. They have more resources anyway, so some of them being bound up in deposits doesn’t hurt so much.
How would deposits have affected the Greens?
Although the Greens didn’t stand in many constituencies in 2021, they did stand in some. In fact, contesting 12 out of 73 constituencies (one-sixth) wasn’t just four times as many as they’d done at any individual election previously, but three times as many as they’d done in the history of the Scottish Parliament up until then. They’d stood in three in 2016, and prior to that just one in 2007. We’ll get on to where they stood and what we can learn from that a bit later on, but what that means is that there were 61 seats without a Green constituency candidate, which therefore saved the Greens £30,500 in deposit costs.
Elections in the UK are very low-expenditure affairs compared with, for example, the US, so £30,500 in additional deposits would have been a significant hit to the Greens’ campaign chest. Campaign spend has to be carefully recorded and reported, and we therefore know that the Greens’ spend over the four month “regulated period” in 2021 was £231,902.48.
In other words, if the Greens had chosen to contest every single constituency at that election, the cost of additional deposits would have been equivalent to reducing their remaining available campaign spend by 13.2%. That is a huge chunk of cash for a party to give up, and especially when doing so would have made precisely zero contribution to them winning more seats. But of course, parties carefully weighing up how best to use their resources isn’t anything new. Not all constituencies are treated equally by any party.
The Conservatives spent more cash trying to win Moray and Banffshire and Buchan Coast than they did in Glasgow Southside or Paisley, whilst Labour were the exact opposite. Lib Dem expenditure was high in Caithness, Sutherland and Ross, and practically non-existent in Cunninghame North. Even the SNP poured more cash into flipping marginal Edinburgh Central than on what they knew would be a comfortable hold in Kilmarnock and Irvine Valley. The Greens choosing not to contest the majority of constituencies at all was just a different approach to the same thing: wisely targeting limited resources to get maximum return.
Where the Greens Did Stand
Direct List and Constituency Comparisons
Usefully, the Greens stood in a good mixture of constituencies. These were also widely distributed across the country, with only Central not seeing a Green constituency candidate. Whilst the seats their two co-leaders contested, Glasgow Kelvin and Edinburgh Northern and Leith, are the party’s two strongest constituencies by regional vote share, constituencies like Inverness and Nairn or Paisley are more middling, whilst Galloway and West Dumfries and Ettrick, Roxburgh and Berwickshire were their fourth and seventh worst, respectively. That’s a lot more helpful for understanding than if they had only stood in areas they were strongest, as you could hypothesise that a stronger existing base might be more likely to vote Green on both ballots.
What stands out immediately is that the Greens did indeed pick up a fair few constituency votes where they stood. Having talked about deposits above, they managed to get that returned in seven seats. The favoured social media theory that the Greens exist only due to tactical voting by SNP supporters on the list has never stood up to serious scrutiny, and this is a key recent bit of evidence for it being bunk. If people were only voting for the Greens as a tactical list vote, we’d expect them to have won few-to-no constituency votes, and that simply isn’t what happened.
In terms of patterns, there is some degree of relationship between a strong list vote and a strong constituency vote – the top two by list vote are the top two by constituency vote, and likewise the bottom two are the same on both votes. This isn’t perfect though, as Glasgow Pollok was the third worst by list share, but only fifth worst by constituency. Similarly, Glasgow Provan leapfrogs Aberdeen Central on the constituency scale. Another interesting little titbit is that in Glasgow Kelvin their constituency share was actually higher than their List vote, perhaps reflecting the fact the party were in genuine contention to win there, unlike any other seat.
Constituency Carry Over
We can also look at that in terms of how much of the Green list vote was “carried over” into constituency support. Note that the ratios here may differ very slightly from what you’d get directly calculating against the previous chart, due to a combination of rounding and the fact I’m comparing the total number of votes rather than the shares, and no constituency had an equal number of valid votes cast on both ballots.
Again, if we look at this in terms of patterns, it is generally the case that the stronger constituencies had a higher ratio of constituency to list votes than weaker. However, the Glasgow constituencies have a notably high ratio, whilst the Edinburgh ones fall further down the table than you might expect if the relationship was entirely as simple as “strong equals better”.
Edinburgh Northern and Leith I can’t really explain. Given Edinburgh is historically the Greens’ core stronghold, you’d think it would have been similar to Glasgow in terms of maintaining strength across both votes, especially in their second best constituency in the country by list vote. For Edinburgh Central, where they won barely more than half of their list share, I think that’s a clearer example of tactical voting on the constituency side.
The Conservative victory there in 2016 had been a shock, and the Greens had even been blamed for it happening, though if the SNP had won the seat it would have thrown off proportionality and rather than the Conservatives experiencing a net loss, it’d have blocked a second Green list MSP, so I don’t expect the Greens to be particularly apologetic about that outcome. Nonetheless it was a clear and intensely fought marginal ahead of 2021, so you’d expect a lot of ordinary Green voters to hedge their bets and go SNP to block the Conservatives locally.
Overall Figures
Across all 12 constituencies they contested, the Green constituency vote share was 7.8%, versus 10.3% of the list vote in the same constituencies. In terms of raw votes, this amounted to their constituency support coming in at three-quarters (75.3%) of their list support. On average, it was 73.3%, and the median was 66.5%. The average actually comes out pretty close to the ratio between the Lib Dems’ constituency and list vote which was 73.1%, albeit the other way around with a better constituency tally.
If we eliminate Glasgow Kelvin from the mix as the sole outlier where the party got more constituency than list votes, it’s 6.2% constituency versus 9.4% list, or two-thirds (66.6%), the average is instead 69.1%, and the median 66.2%. That’s a bit lower, but it’s still a clear majority of votes carrying over between the two votes, and given the example of Edinburgh Central in particular, it’ll be deflated by the much more common tactical vote, which is on First Past the Post votes.
A Full Green Slate
Using what we know about Green constituency results where they did stand, let’s envision the scenario where they had a full slate of candidates across all 73 constituencies.
Process
On a first pass, the 61 constituencies the Greens didn’t contest were split into four roughly equally sized pools based on the ranking of their 2021 list vote. Constituencies at the upper end were designated “strong”, with a starting point of 75% of their list vote carrying over, moving down through medium (70%), weak (65%) and very weak (60%). The two regions (Central and West) that didn’t have any strong Green constituencies had their top result nonetheless designated as such.
This initial figure was then reduced by 10% for constituencies most likely to be subject to tactical voting. Finally, reflecting the unique circumstances in Glasgow, constituencies (excluding Rutherglen, which is in the region but not the city) with a higher list share than Provan were increased to 90%, and those lower to 80%. I didn’t move Edinburgh down just as most of the seats were below the Northern and Leith ratio anyway. The Greens were then assigned the relevant number of votes in each constituency, with other parties losing out in rough proportion to established transfer patterns in 2022 – most votes coming from the SNP, a reasonable proportion from Labour and the Lib Dems, and practically none from the Conservatives.
None of this is intended to be a fully accurate claim as to what the Greens would have got in a given constituency. The only way to know that would have been for them to stand. Instead, it’s a quick-and-easy rough estimate as to what would be a broadly believable spread for the party, with a whole barrel of salt for individual constituency estimates. We also can’t know for sure what proportion of Green votes would have come from each of the other parties and whether it would have mirrored 2022 transfer patterns so closely, not least because those patterns varied across the country in a way I’ve not accounted for here in the name of simplicity.
Estimated Results
Only one constituency changes hands compared to the real 2021 in this scenario – the Conservatives hold on to Ayr rather than the SNP picking it up. However, this has no effect on the total number of seats, as it just trades off one of the list seats between those parties instead. Some of the non-changes we can nonetheless be pretty sure of. For example, although Banffshire and Buchan Coast was a relatively narrow SNP hold over the Conservatives, it was also the Greens’ third worst list result, so there’s no way they could have split the vote enough.
On the other hand, seats like East Lothian and Perthshire South and Kinross-shire are a bit more wobbly. It’s possible that the loss of Labour constituency votes to the Greens would have been lesser in both constituencies, in East Lothian because Labour were clearly in contention to win, and in the Perthshire seat because they had fewer votes to start with, meaning the Greens might pick up more from the SNP instead. East Lothian would again have been immaterial, just leading to the SNP and Labour trading a list seat in compensation, but PSK going Conservative would have led to the SNP losing a seat to Labour after list allocations were settled.
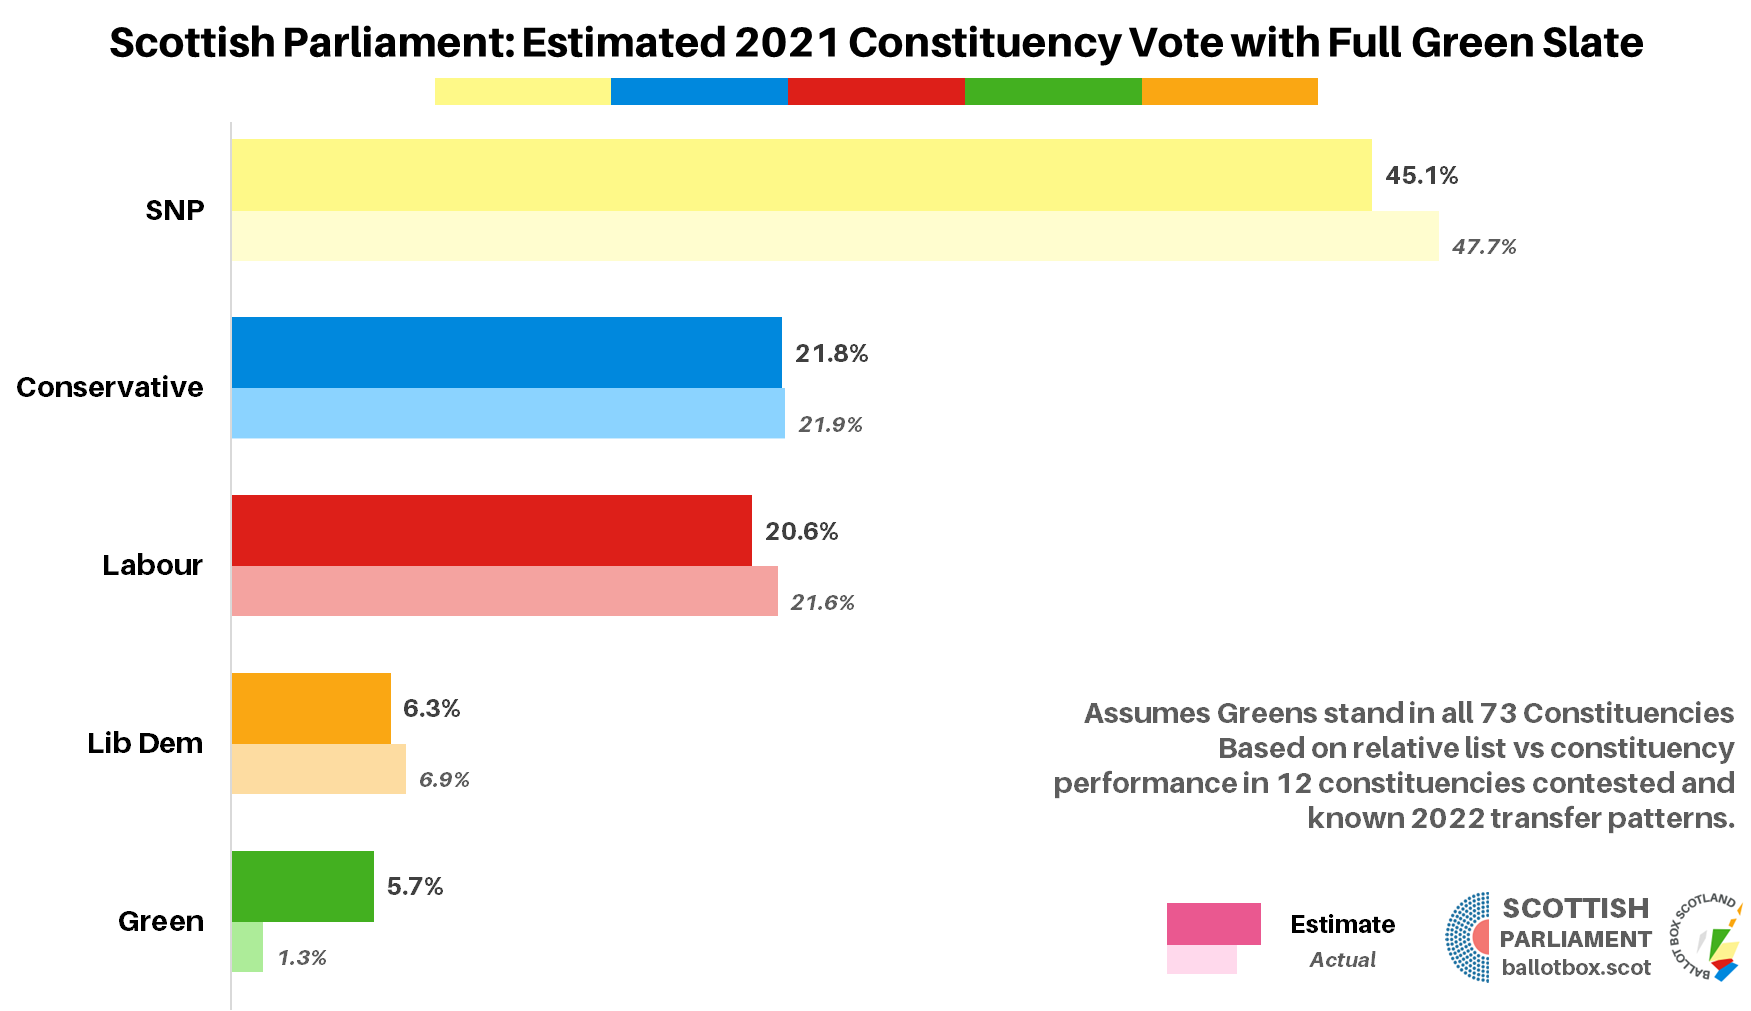
Overall, the total Green constituency share in this scenario comes out at 5.7%. That still leaves them in fifth place for this vote, but at only 0.7% behind the Lib Dems, it’s a good bit closer than the Lib Dems’ deficit on the list which is 3%. That means carrying over just over two-thirds (69.5%) of their list vote to the constituency, with an average of 66.9% and median of 64.8%. The Greens would also hold their deposits in 34 constituencies under this scenario, compared to 23 for the Lib Dems. Combined with the fact they held their deposits in all eight regions, the Greens would have had £21,000 of deposits returned and lost £19,500 worth.
Final Thoughts
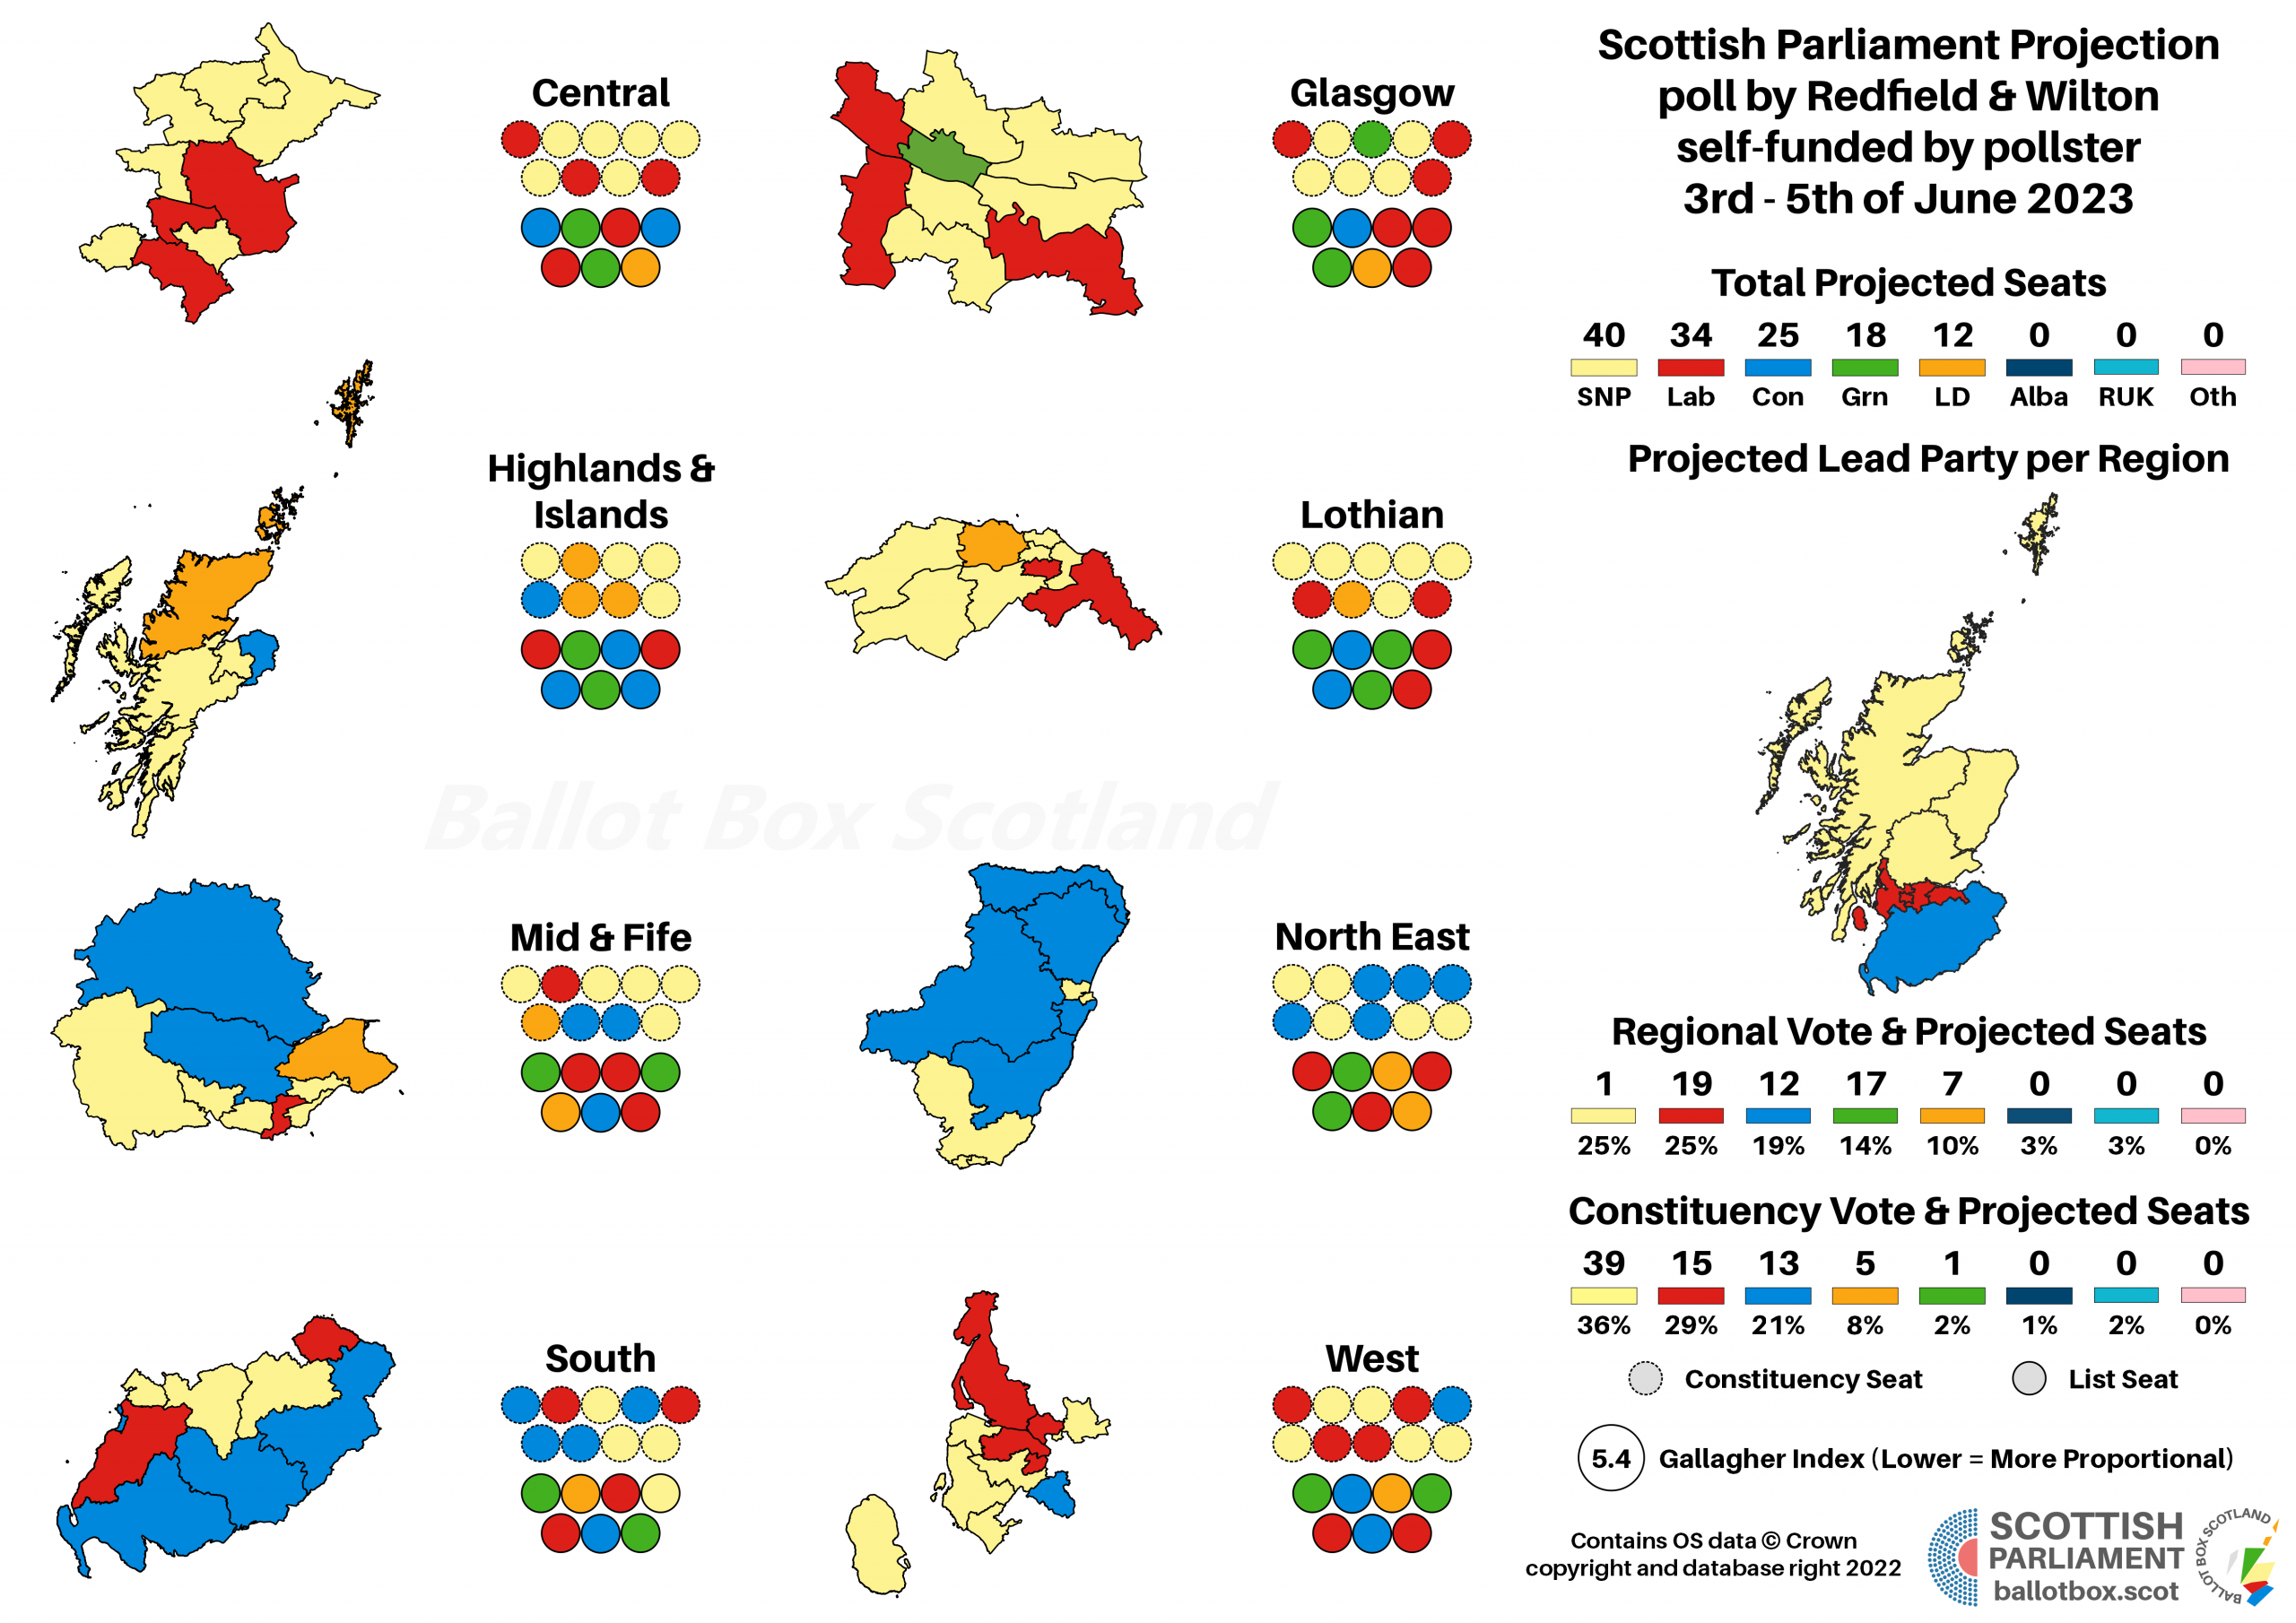
All of this ties in to something I’ve said a few times when covering Holyrood polling: pollsters struggle to get a “realistic” Green share. When they do find higher numbers, for example a recent 7% for Panelbase, it’s clearly a lot more than the Greens could possibly win with limited contesting and so looks unrealistic. But at the same time, finding only 2% of the national vote is unrealistic against what’d they achieve if they did have a full slate nationally. It’s a Catch 22 whereby nothing is quite right because everybody is doing their weightings differently and no one really knows how to account for the Greens at constituency vote level because they haven’t really stood in many.
What’s interesting though is that it’s clearly not simply that First Past the Post knocks Green vote shares downwards. Although their performance is notably worse on that vote where they have stood, in general it still massively exceeds their Westminster shares. Take Edinburgh Northern and Leith for example – at 13.1% of the vote, that was far in excess of the 3.3% they won in the similar (but not identical) Westminster seat in 2019. Similarly, 3.6% in Glasgow North that year is paltry compared even to the 4.9% crossing the river in the much less naturally favourable Glasgow Pollok at Holyrood.
My theory is that effectively, most voters aren’t necessarily thinking in terms of FPTP or tactical voting, but instead what the election is for. Everyone knows Westminster is purely FPTP and that often needs tactical voting, and everyone knows Holyrood uses Proportional Representation and it doesn’t so much. The exact detail of how Holyrood’s PR system works isn’t really known or relevant to most voters, and so lots of people (would) just vote Green on both ballots because they feel less pressure not to do so than at a Westminster election. What will be fascinating then is to see how each of those elections then play out next time on this front.
We’re due a UK General Election by January 2025, and like most commentators I’m of the view it’s likely to fall at some point in 2024 rather than force a campaign over Christmas. The Greens stood in about a third of constituencies in 2019; with a role in the Scottish Government for the first time and a bit more resource than what was effectively the second snap election that year (remember 2019 also saw European Parliament elections we thought we’d dodge), will they stand in more as a matter of either growth or credibility? How will they do? At the next Holyrood election, do the Greens move on from their “toe in the water” approach at 2021 to wider contesting? And will that help prove or disprove what’s written here?
If you find this or other Ballot Box Scotland output useful and/or interesting, and you can afford to do so, please consider donating to support my work. I love doing this, but it’s a one-man project and takes a lot of time and effort. All donations, no matter how small, are greatly appreciated and extremely helpful.
(About Donations)