Scottish politics may have had a particularly silly Silly Season this summer, but it’s been comparatively quiet on the polling front. I say comparatively, as there have of course been the monthly trackers from Redfield & Wilton that for reasons outlined here I simply do not consider particularly credible and therefore have ceased covering. Yes, yes, we know, I’m a Green / Nationalist plant out to rig my coverage, please go and be tiresomely abusive elsewhere, thank you, the rest of us can get on with our lives understanding that I’ve not got an incentive to make myself a focal point for hatred so can be trusted to be acting in good faith.
Breaking the lull in polls out from actually reputable pollsters, YouGov (link to tables) dropped some figures this week. Although this appears to have been conducted on their own steam rather than for a client, it took about a week after fieldwork concluded for them to publish; I’ve been as fast as possible after that, but that’s why it’s a good few days ago now.
The previous YouGov covered the 17th – 20th of April 2023. Changes are shown as (vs that poll / vs last election).
Regional Vote
There’s basically something for all bar one of the Holyrood parties to enjoy here. For the SNP although it’s a comparatively low share, there’s a bit of upwards motion which they’ll desperately want after a torrid few months, ensuring they remain at the head of the pack. Labour nonetheless continue to grow, with one of their strongest list vote results since the election.
Though both the Greens and Lib Dems are down a single, entirely within margin of error, point versus the last poll, their figures are still a good bit better than the election and would guarantee their MSP ranks swell. That leaves only the Conservatives wallowing truly in the doldrums, support slipping significantly since the last poll and even more so since the election.
Constituency Vote
The SNP will be even more relieved to see the constituency figures, which have slightly higher levels of growth and which re-open, however barely, a double-digit lead over Labour. Although it’s always the case that the list vote is the most important for overall seat distribution, at the SNP’s current level of support on that vote, the better they do on the constituency side of things the more of their current crop they can hold onto.
This is nonetheless still a very good share for Labour that would see them re-take a number of the constituencies they lost years ago. The Conservatives are again weakened on this vote, as are the Lib Dems, whilst the Greens have a very mild upwards tick.
Seat Projection
Projecting that into seats might give us something like this:
Please see this page for how projections work and important caveats.

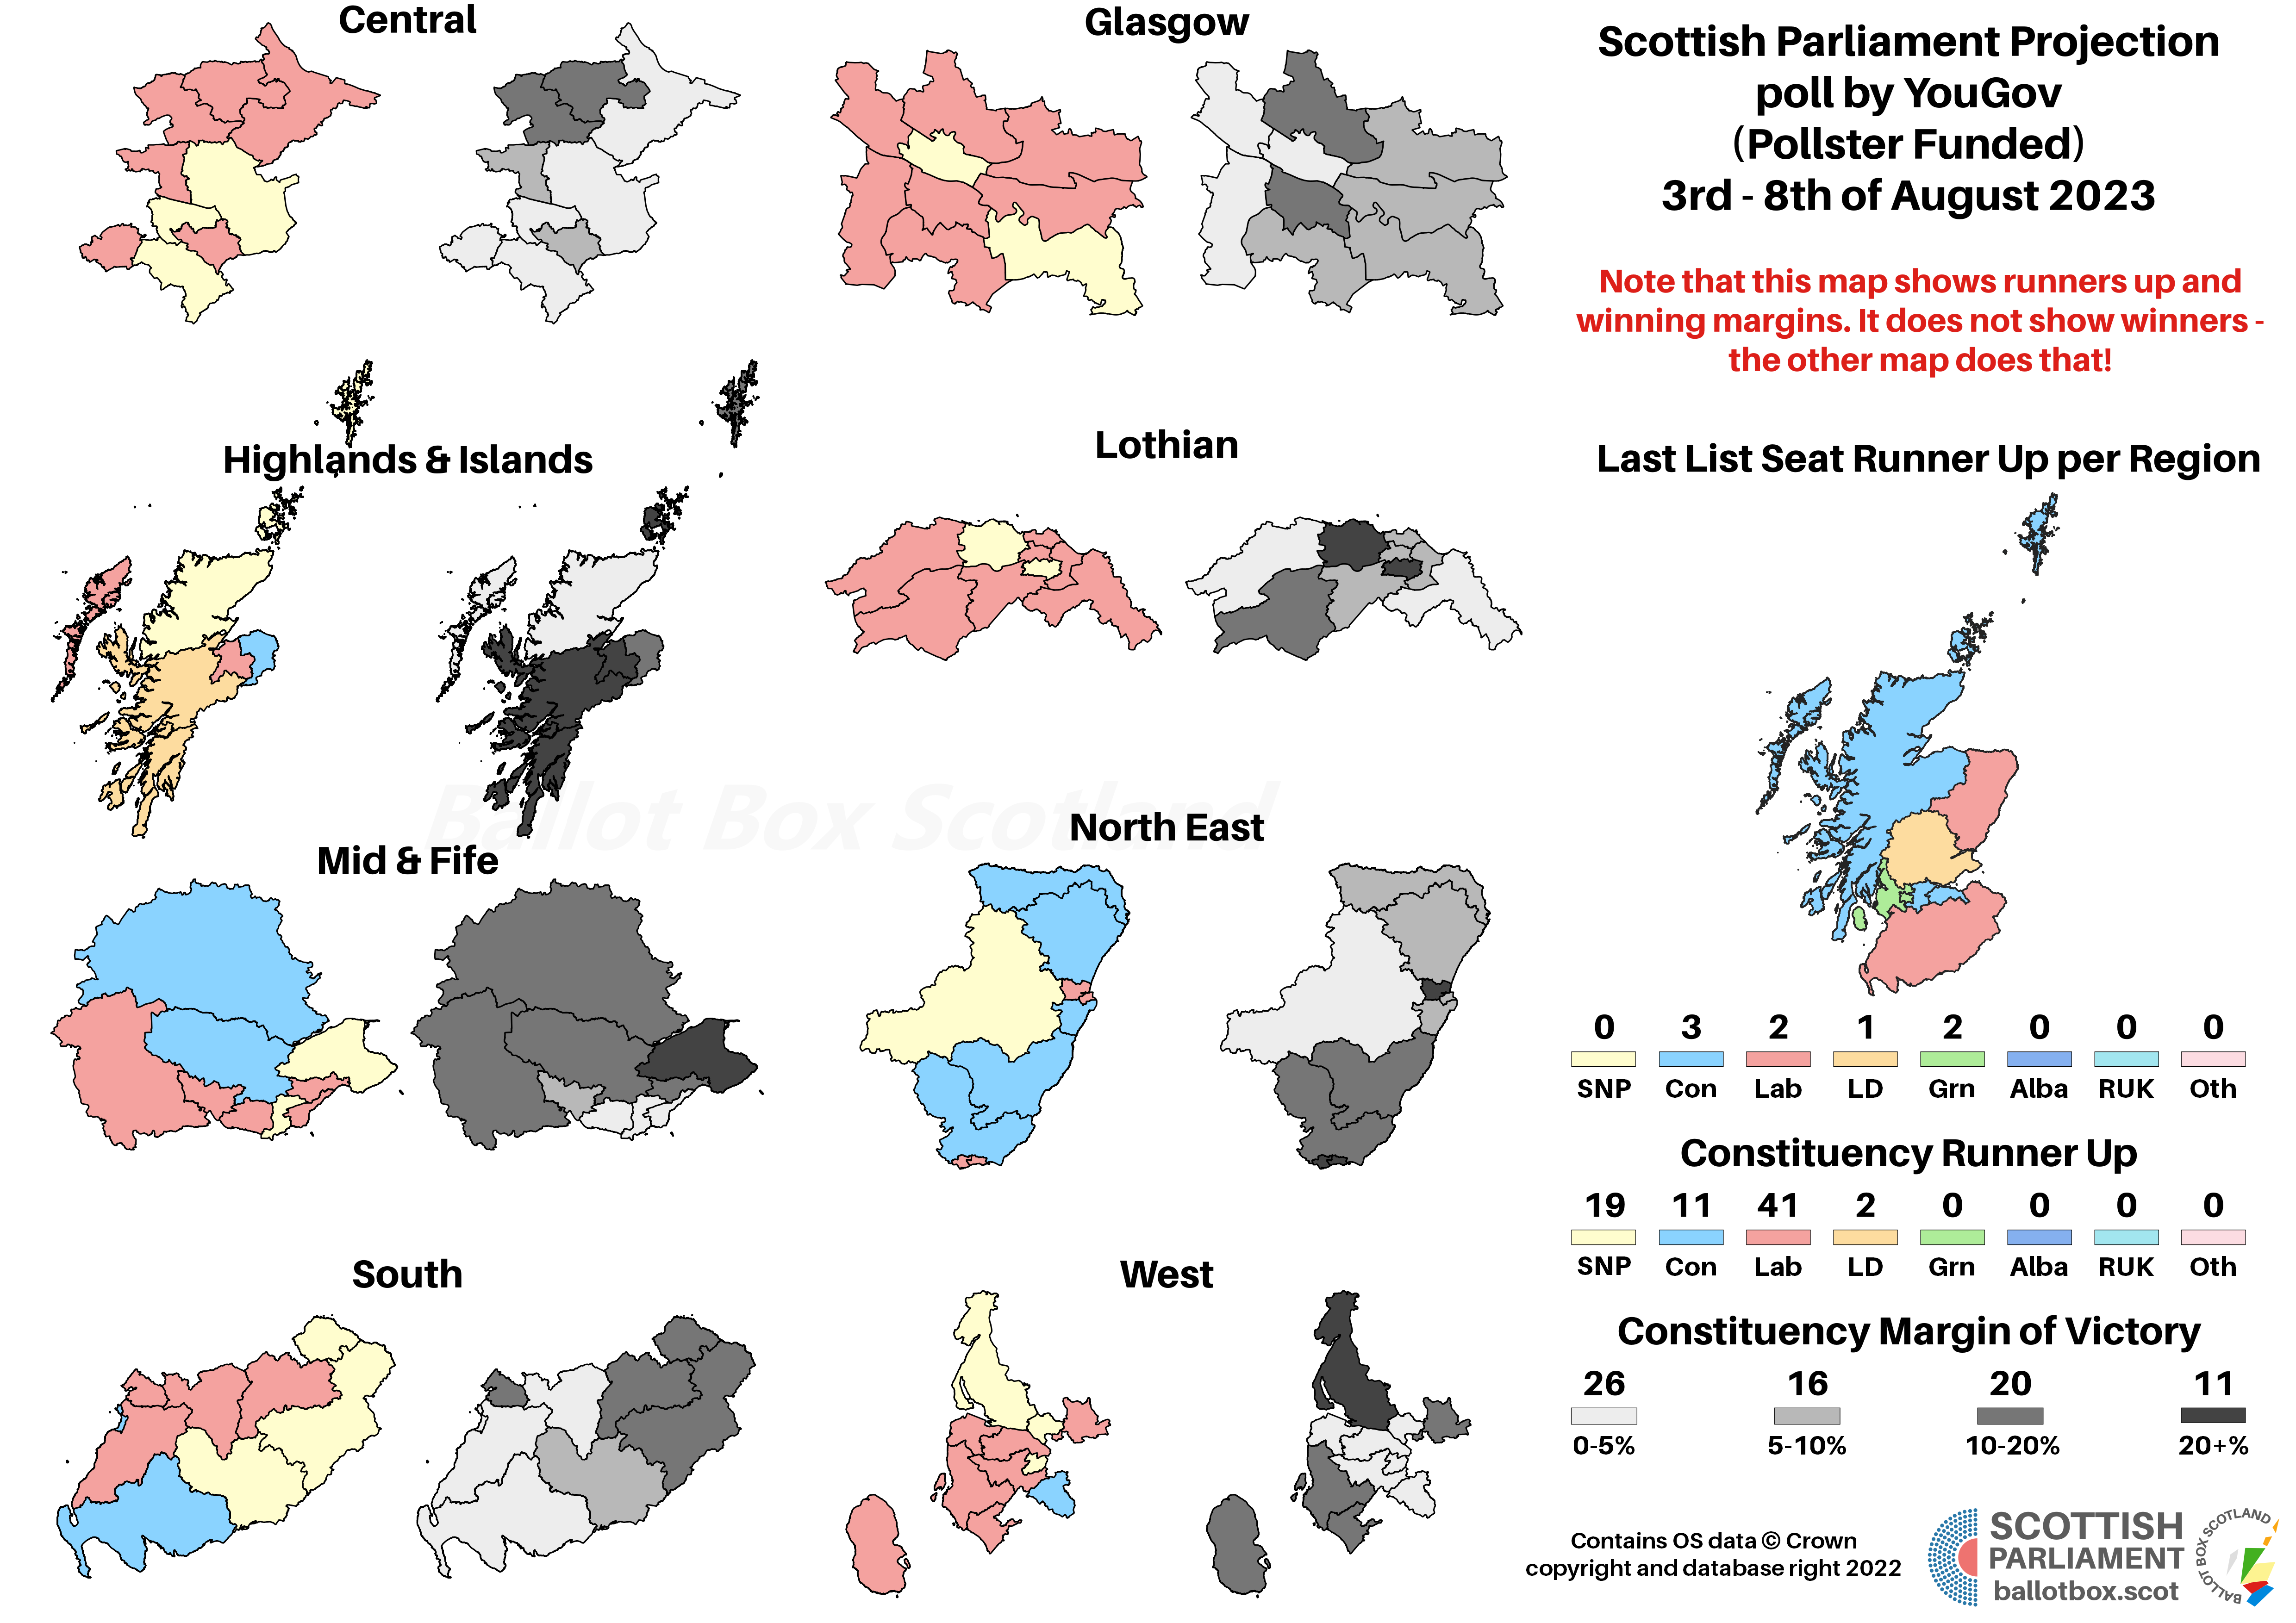
Whereas the last poll projected to the barest majority for the current SNP-Green government, this one gives them a couple seats breathing room. That’s despite the loss of a handful of Green seats versus that projection, as the SNP more than make up for that with constituency wins. SNP support has been on the slide in the period since the last YouGov, so this is a rare poll that projects to giving the current government a majority.
Emphasising how well Labour continue to do though, this is the joint-second highest seat figure any poll I’ve covered has projected for them. In an equal-but-opposite reaction, the Conservatives are on the joint-second worst seat tally I’ve ever projected, and one that would match their low at the 2011 election.
This poll has been quite a good example of the limitations of modelling however. Although the second of the projection images shows the estimated winning margin in each constituency, intended to remind you that more narrow margins are therefore more dicey predictions, I don’t believe I’ve ever had a straight tie in a seat before. Glasgow Kelvin however had both the SNP and Labour with the same vote total; normally I’d check the tables for numerical rather than percentage figures, but YouGov only give the latter, so I just settled the tie in Labour’s favour given they’re the party making gains in this scenario.
Similarly, note that there’s not a single Conservative MSP elected in Glasgow. That’s not just down to overhang, as the model thinks their share would be 4.8% in that region if they are on 14% nationally. Yet, we know that in 2011 when they were on 12.4% nationally, they won 6% in Glasgow, so it’s probably unlikely they would actually be wiped out there. Some things to bear in mind with projections in general – it’ll often throw up odd stuff!
The story for the Westminster poll is rather different, in that the SNP have slipped a little bit, whilst Labour have experienced further significant growth. With only 4% between the two parties, they’re likely at the point where due to differences in how their vote is distributed, Labour might be able to win more seats than the SNP. Like the Holyrood figures this is a poor poll for the Conservatives, and the Lib Dems too lose out, leaving them tied with the Greens on a joint-record Westminster share.
(As ever, note that YouGov inexplicably retain Refused and Wouldn’t Vote figures in their tables, and thus the figures reported here may look slightly different to what you see reported initially, as they are after removing those non-voting options.)
The previous YouGov had given one of the better shares for the Union, but support for Independence has seemingly bounced back a little here, though it remains behind. On both measures, the gap between the camps has narrowed by 4% (and to 4%), coming out at everyone’s favourite ratio. It’s a point I’ve made a few times now, but the constitutional question remains pretty closely fought, and it doesn’t yet seem that the SNP’s woes are inherently translating to similar difficulties for the wider Independence cause.
Hypotheticals
As ever, the last little bit of analysis concerns those hypothetical and more proportional voting systems that BBS likes to play about with. The use of pure FPTP at Westminster is an affront to democracy, and though Holyrood fares far better, AMS is still deeply imperfect. The examples here simply transpose the poll findings onto more proportional voting systems – the reality is that different systems would of course result in different voter behaviour.
Scandinavian Style Westminster
Note that for the first time, the figures here sum up to 57 rather than 59, reflecting Scotland’s new total seat number under the all-but-approved new Westminster constituency boundaries. I’ve therefore recalculated both the previous poll and the 2019 result to match 57 seats.
If you find this or other Ballot Box Scotland output useful and/or interesting, and you can afford to do so, please consider donating to support my work. I love doing this, but it’s a one-man project and takes a lot of time and effort. All donations, no matter how small, are greatly appreciated and extremely helpful.
(About Donations)