I’ll start this piece with a bit of an apology – this poll completely passed me by. Data from it was published back on the 25th of May, which was one whole week before I took my little birthday long weekend break! I don’t know if I was just laser-focused on ongoing LE22 data compilation or if there was very little coverage of it to draw my attention, but either way, I was oblivious to it until today.
In any case, it’s the second YouGov of this Holyrood term, which they conducted on behalf of the Times. That’s quite helpful actually as, although they cover a two-month period, the current “five poll average” that BBS arbitrarily uses given inconsistency of polling is drawing from five different pollsters. You may have spotted an Ipsos MORI for STV News last week but for some reason they only asked Independence and Westminster questions, no Holyrood, so it doesn’t get a full analysis piece.
The previous YouGov covered the 18th – 22nd of November 2021. Changes are shown as (vs that poll / vs last election).
Regional Vote
Relatively minor changes here relative to the last poll, with single-digit gains for the SNP, Lib Dems and Alba. Similarly small losses too for the Conservatives and Greens, with only Labour showing a swing of more than a single point, going two in their favour.
Compared with the 2021 election however, the shifts are generally more sizeable. Middling poll figures for the Greens and Lib Dems would nonetheless be solid improvements, whilst Labour would move into a comfortable second place as Conservative support continues to slump.
Constituency Vote
Things are a bit quieter over on this vote, the main thing being Labour very clearly leapfrogging the Conservatives. That’d only put them marginally ahead of where they were last year, and it’s still the case it’d be better for them to be higher on the list than constituency vote, but a positive poll all in for Labour. This is the a joint worst poll of the term thus far for the Conservatives, but the SNP are doing a bit better here than they have with polls from other firms.
Seat Projection
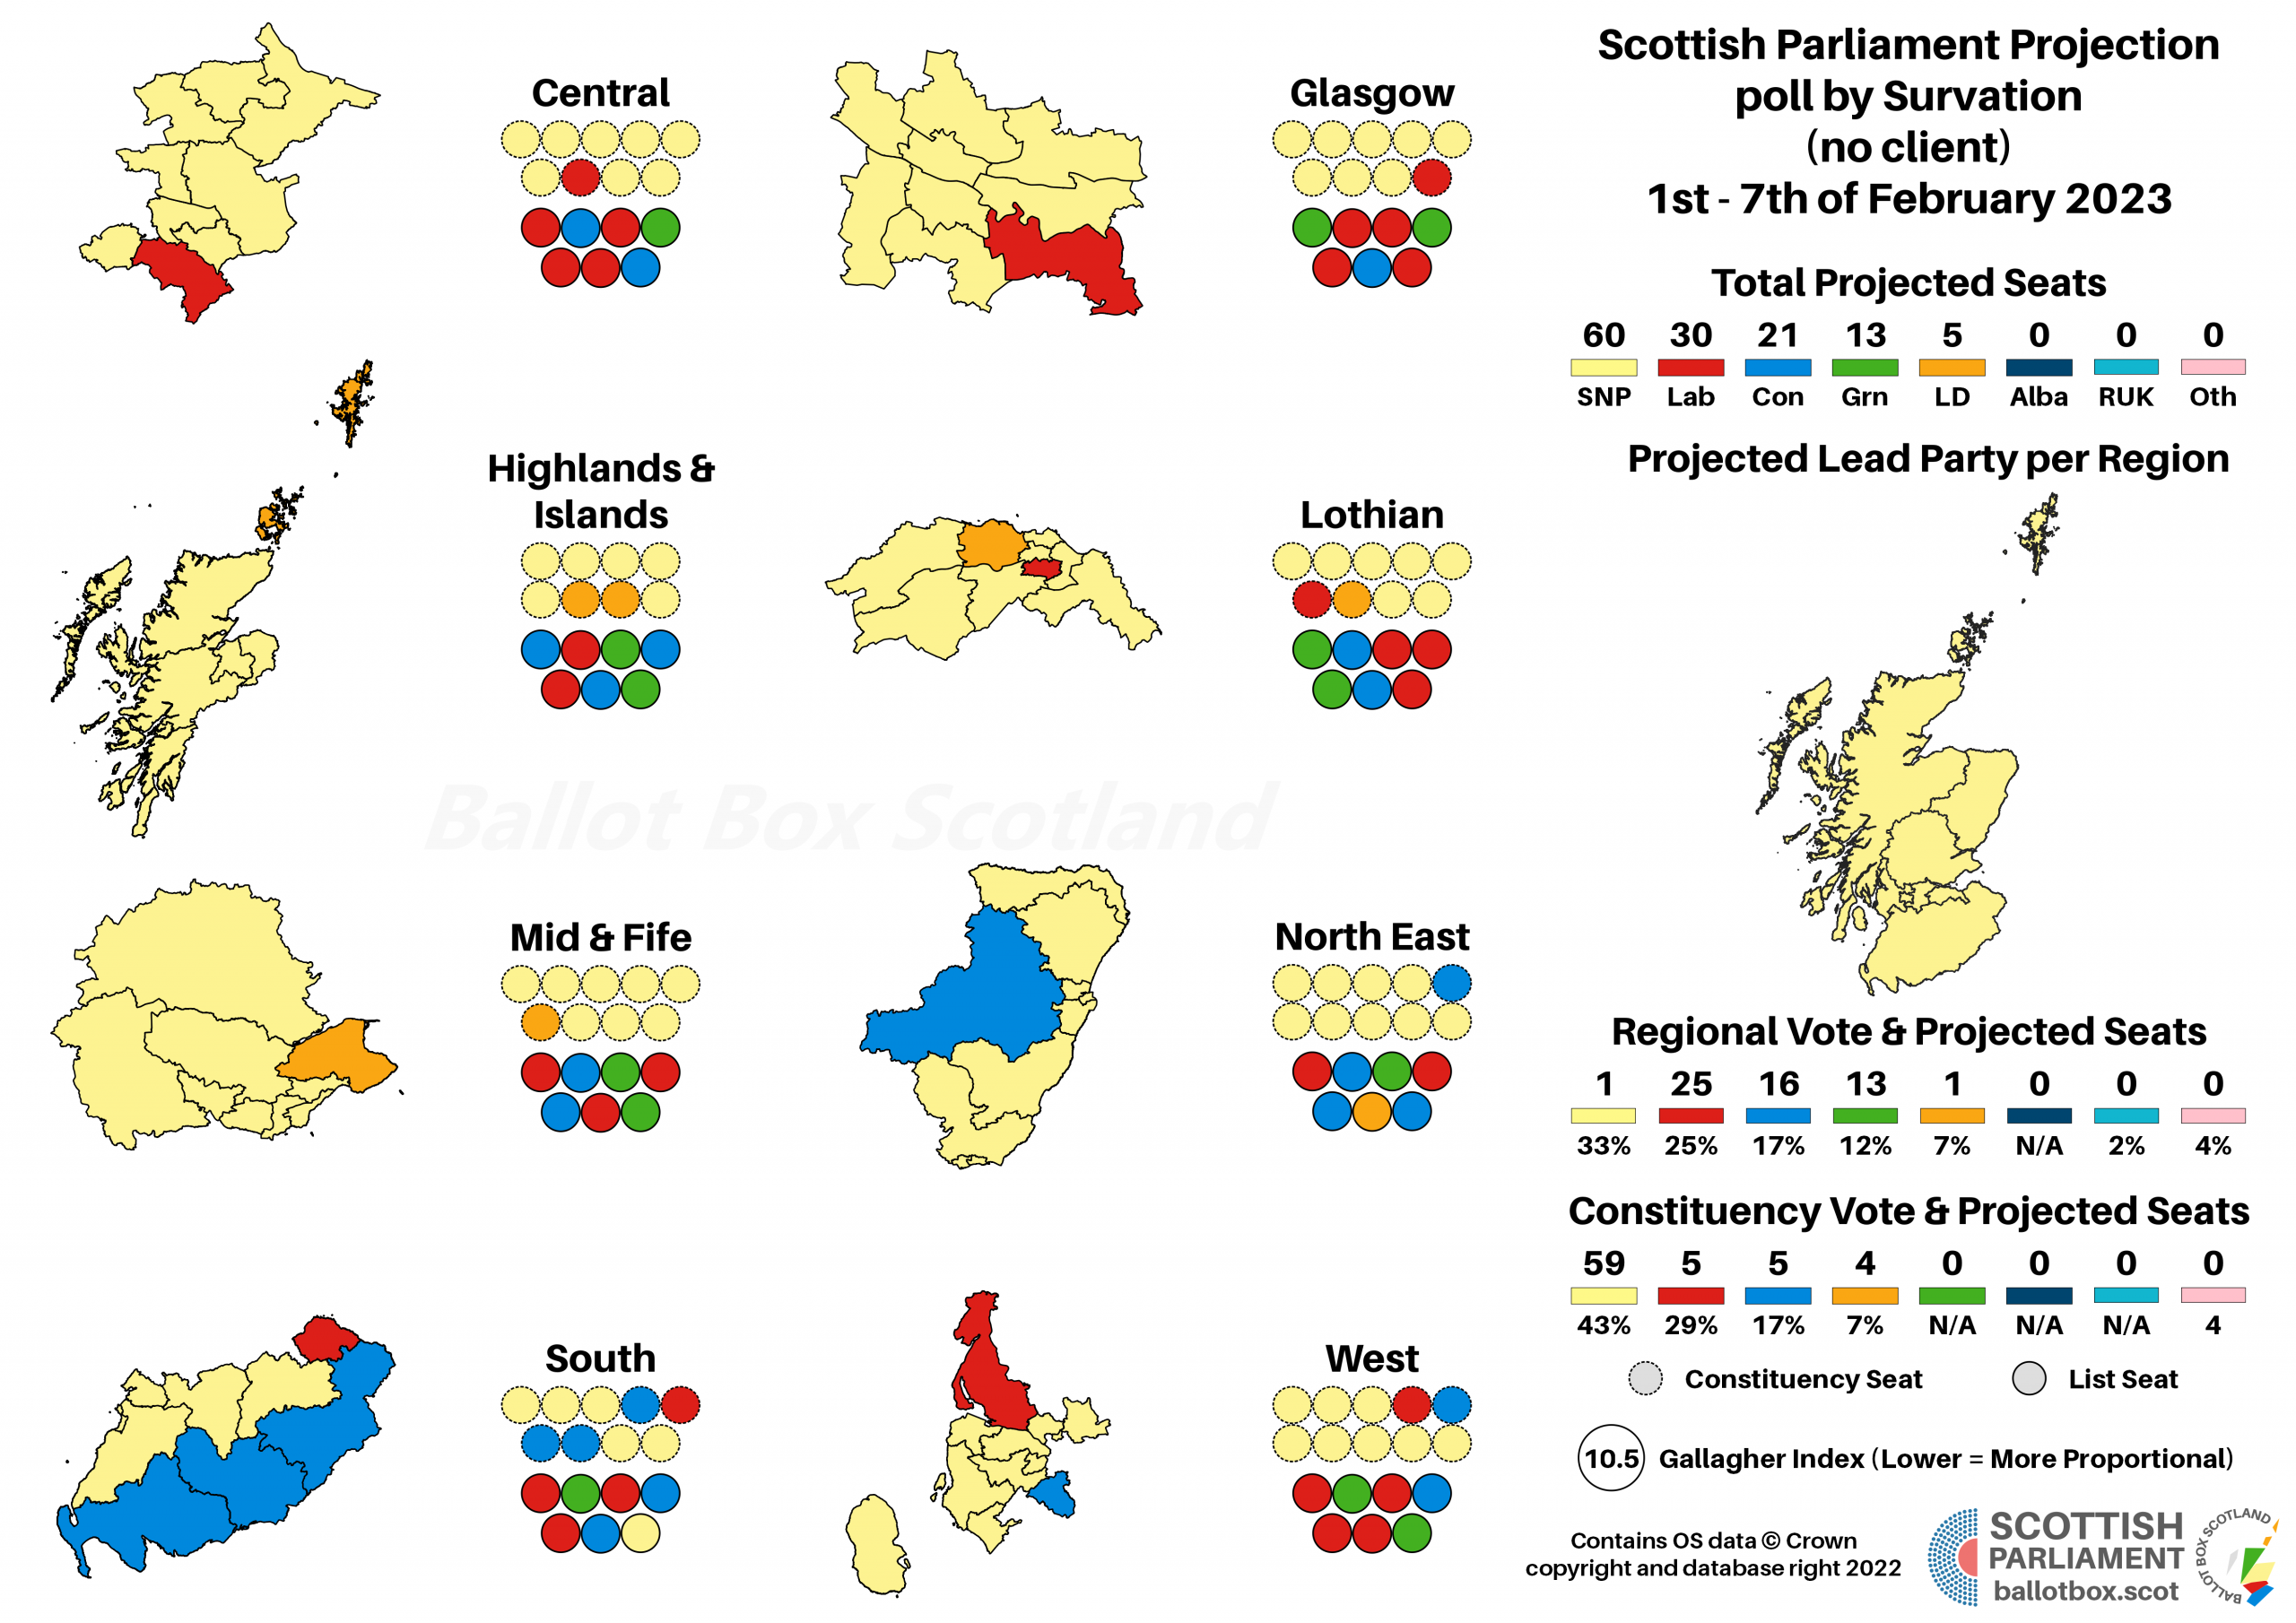
Projecting that into seats might give us something like this:
Please see this page for how projections work and important caveats.
A particularly weak result for the Conservatives starts to see them shed constituency seats in this projection, though always bear the caveats about seat-by-seat projections in mind. Labour have a decent lead for second place, but it’s still miles behind the SNP, who would be comfortably re-elected to their co-operative government with the Greens on these figures.
YouGov are one of the nice pollsters that are routinely asked to poll for both parliaments. Slight drops here for both the SNP and Conservatives compared to the last poll, but for the SNP this is still marginally above their 2019 figure, whereas it’d be a disaster for the Conservatives. Labour end up as the beneficiaries, showing significant gains on both measures, as the Lib Dems remain completely static.
Note: YouGov continues to only provide tables as percentages rather than number of actual respondents, so the overall figures here are best estimates after removing “refused” (2%) and “wouldn’t vote” (4%). That’s partly why rounding effects are so weird here.
As is the norm for constitutional polling, changes here aren’t massive. Notably however this is the first poll since last year’s election to put the two sides, after excluding Don’t Knows, where they were back in 2014. YouGov are consistently the most Union-friendly pollster, though in the averaging process that balances out the more Independence-friendly findings from Ipsos MORI. Regardless, this is a result less in the recent vein of “all up in the air” and moving into more comfortable territory for the pro-Union side.
Timing of a Referendum
In terms of the timing of any future referendum, clear and overwhelming majorities against having one either this year or on the Scottish Government’s preferred timescale of next year. There is a narrow plurality of support for one within a five year period, though that’s somewhat down from November’s poll. It’s possible that shift reflects the sudden ramping up of economic and international instability over the past few months, putting some folk off the idea of discussing major changes to Scotland’s status.
Hypotheticals
As ever, the last little bit of analysis concerns those hypothetical and more proportional voting systems that I have a bee in my bonnet about here at BBS. The fact Westminster uses pure FPTP is an affront to democracy, and though Holyrood fares far better, AMS is still deeply imperfect. The examples here simply transpose the poll findings onto more proportional voting systems – the reality is that different systems would of course result in different voter behaviour.
For the moment, although the maps are useful for illustrative purposes, I’m opting just to show these hypotheticals as charts. It’s very time consuming making maps, and for these pure hypotheticals, it’s possibly a bit overkill.
Tweaking AMS to be a bit more proportional helps to eat away at some of the SNP’s dominance, but not so much that them and the Greens don’t still have a reasonably comfortable lead. As both parties dipped slightly compared to the last poll, that’s reflected in seats here too.
It gets narrower again with an almost maximally proportional system, but the combined SNP-Green vote was indeed higher than the pro-Union parties, so they’d still have a narrow 66:63 advantage here.
Scandinavian Style Westminster
Scandi WM patter.
If you find this or other Ballot Box Scotland output useful and/or interesting, and you can afford to do so, please consider donating to support my work. I love doing this, but it’s a one-man project and takes a lot of time and effort. All donations, no matter how small, are greatly appreciated and extremely helpful.
(About Donations)