Keep tabs on all the latest polling, articles and information ahead of the 2021 Scottish Parliament election in the Ballot Box Scotland Holyrood Hub!
ComRes are back, back, back again as the first pollster to give us some repeat polling in 2021. These are the very welcome fruits of their partnership with the Scotsman for the Holyrood election period – though I’m dying for a YouGov and an Ipsos MORI as well by this point!
Display format for this post:
- Party/Option – Vote% (Change vs last poll by agency 8th – 13th of January / vs last election or referendum)
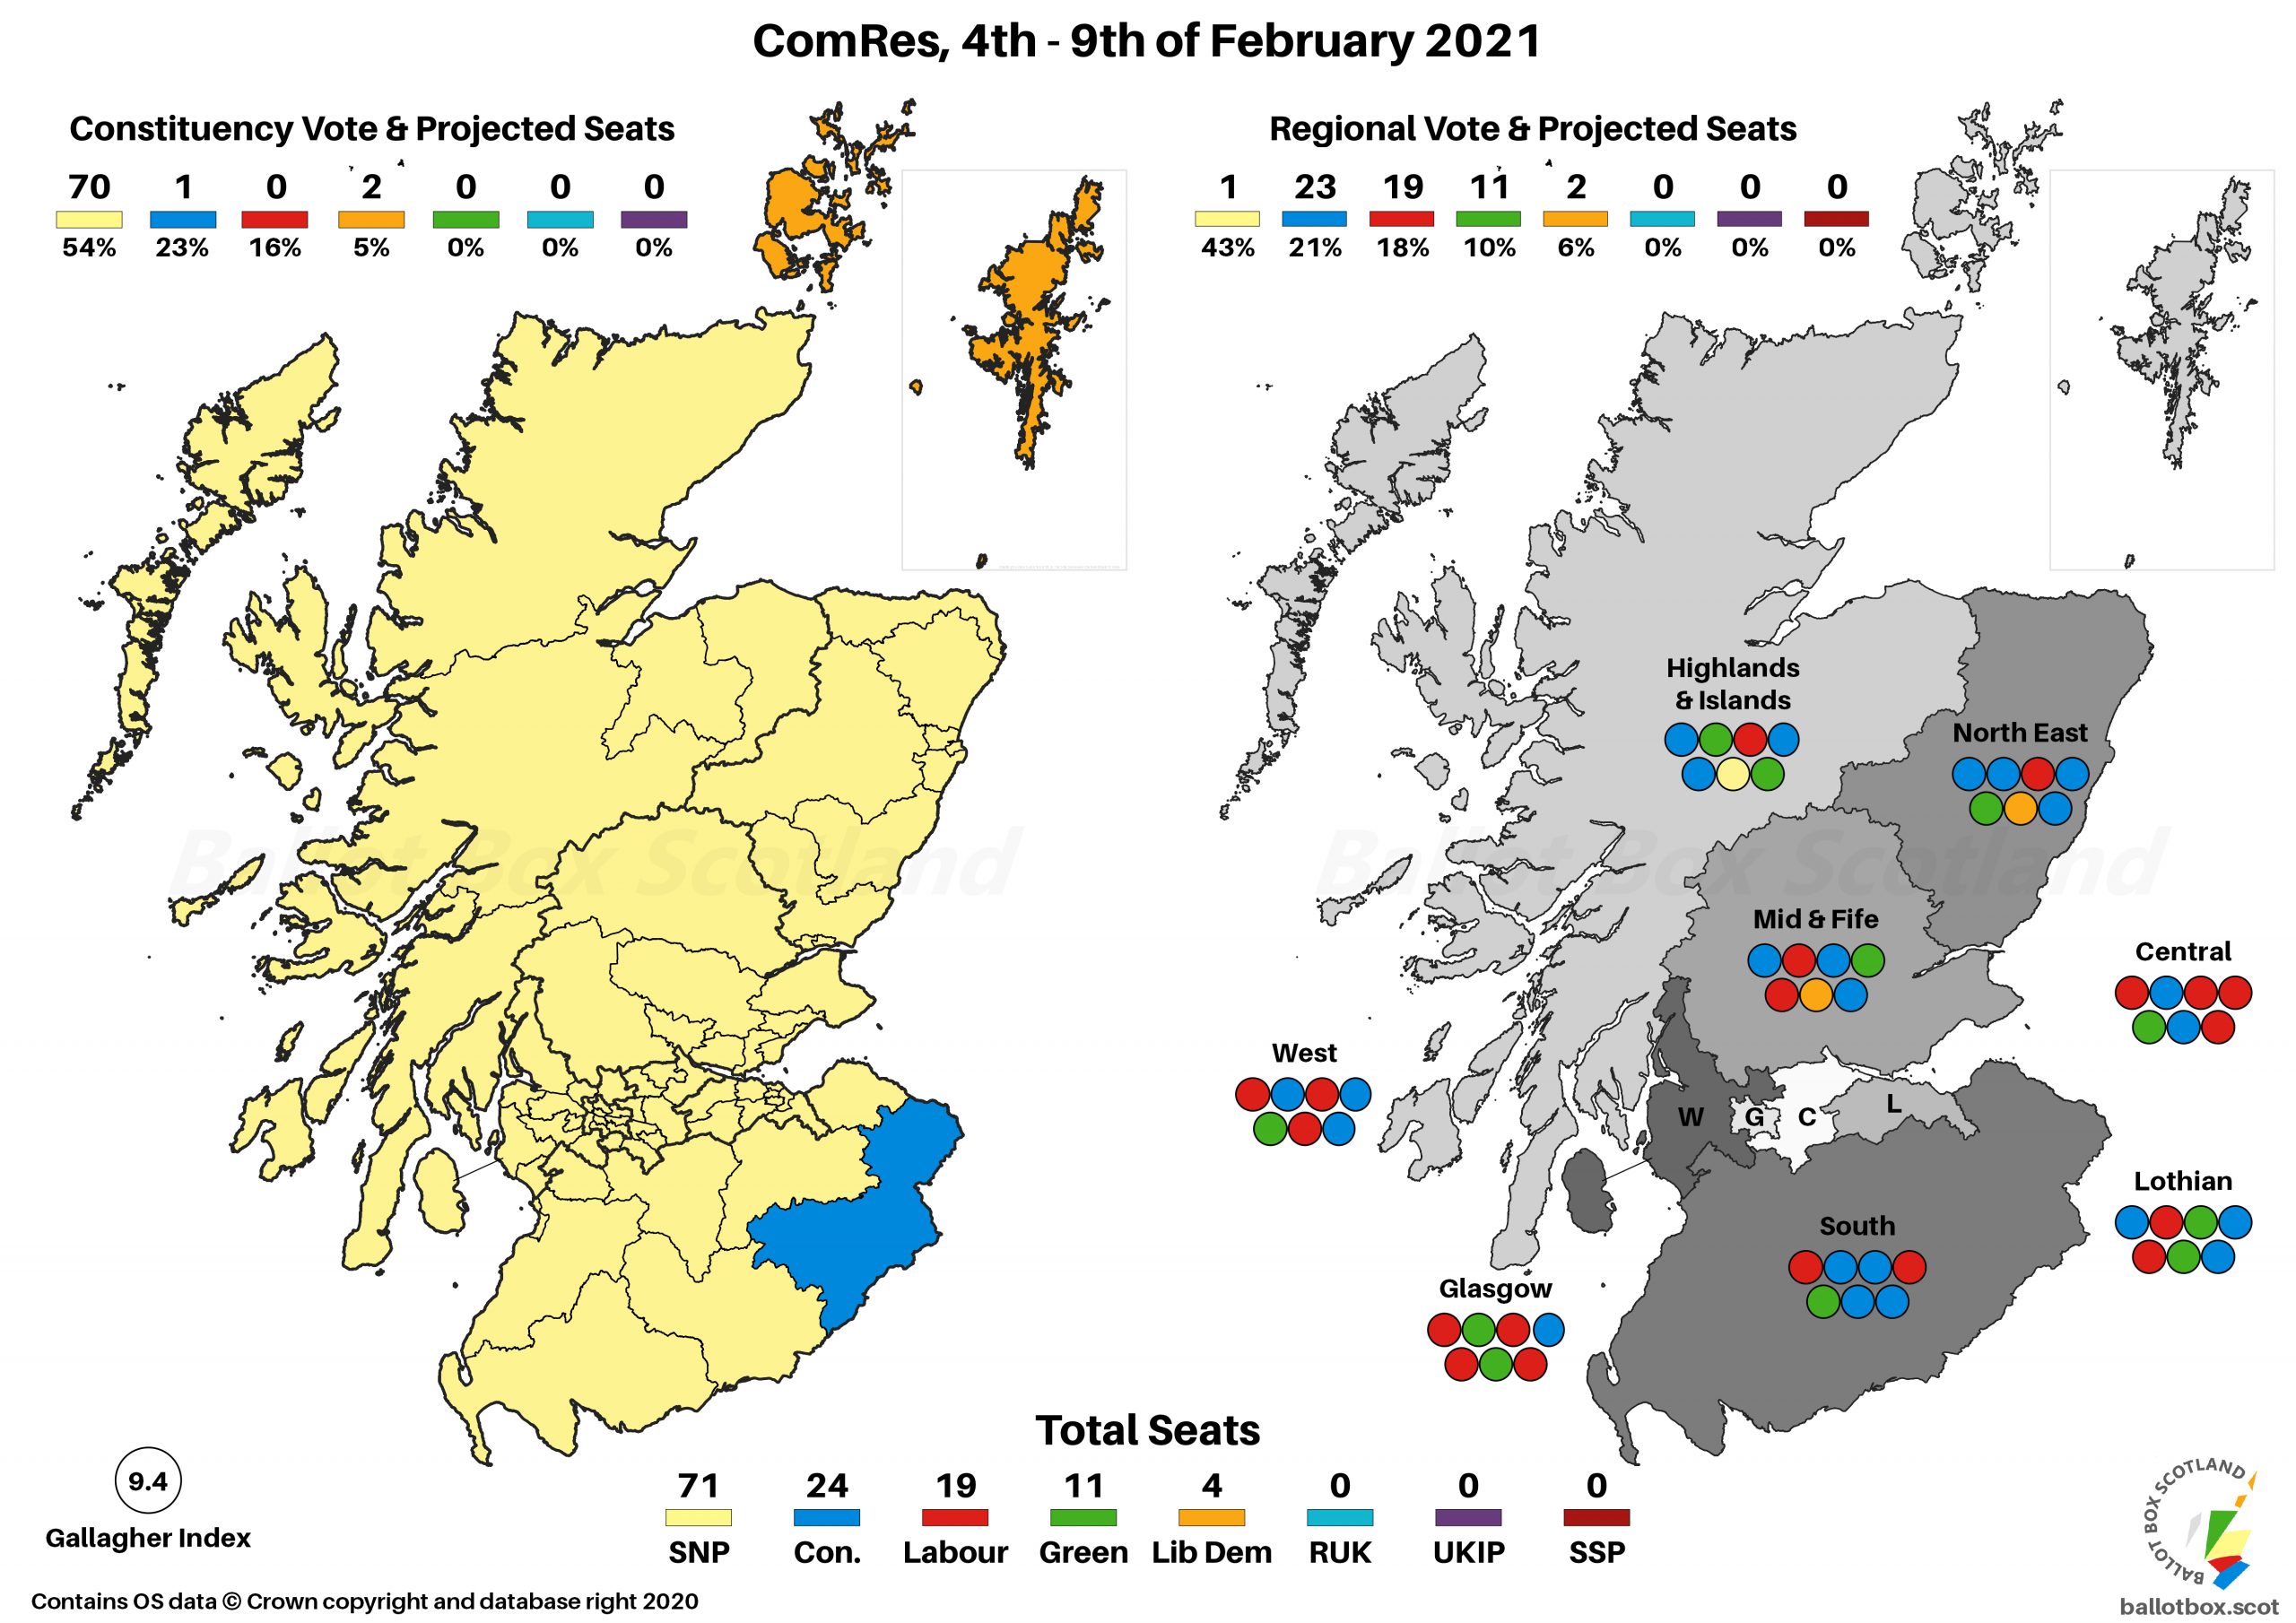
Regional Vote
SNP ~ 43% (-1 / +1)
Conservative ~ 21% (+5 / -2)
Labour ~ 18% (nc / -1)
Green - 10% (-1 / +3)
Liberal Democrat ~ 6% (-2 / +1)
After the last poll had them on literally their worst figures since the last election, the Conservatives are notable for a massive bounce back here. That still has them lower than their 2016 result but back in second place ahead of Labour, who remained completely static.
Everyone else has dropped a bit in the face of that blue bump. For the Greens in particular, I do wonder if this is something of a return to more “normal” levels of polling, given ComRes have very much been the most favourable pollster for them lately.
Constituency Vote
SNP ~ 54% (+1 / +7)
Conservative ~ 23% (+4 / +1)
Labour ~ 16% (-2 / -7)
Liberal Democrat ~ 5% (-1 / -3)
It’s not a million miles different on the constituency ballot, with another big Conservative surge. This is enough of a bump it actually takes them above their 2016 result. The SNP are also up very marginally as well. Balancing the scales out we have declines for both Labour and the Lib Dems, with the latter on a joint-worst figure for this ballot. They were on 5% with the most recent Ipsos MORI in November as well.
Seat Projection
Please see this page for how projections work and important caveats.
SNP ~ 71 (nc / +8)
Conservative ~ 24 (+5 / -7)
Labour ~ 19 (-1 / -5)
Green ~ 11 (nc / +5)
Liberal Democrat ~ 4 (-4 / -1)
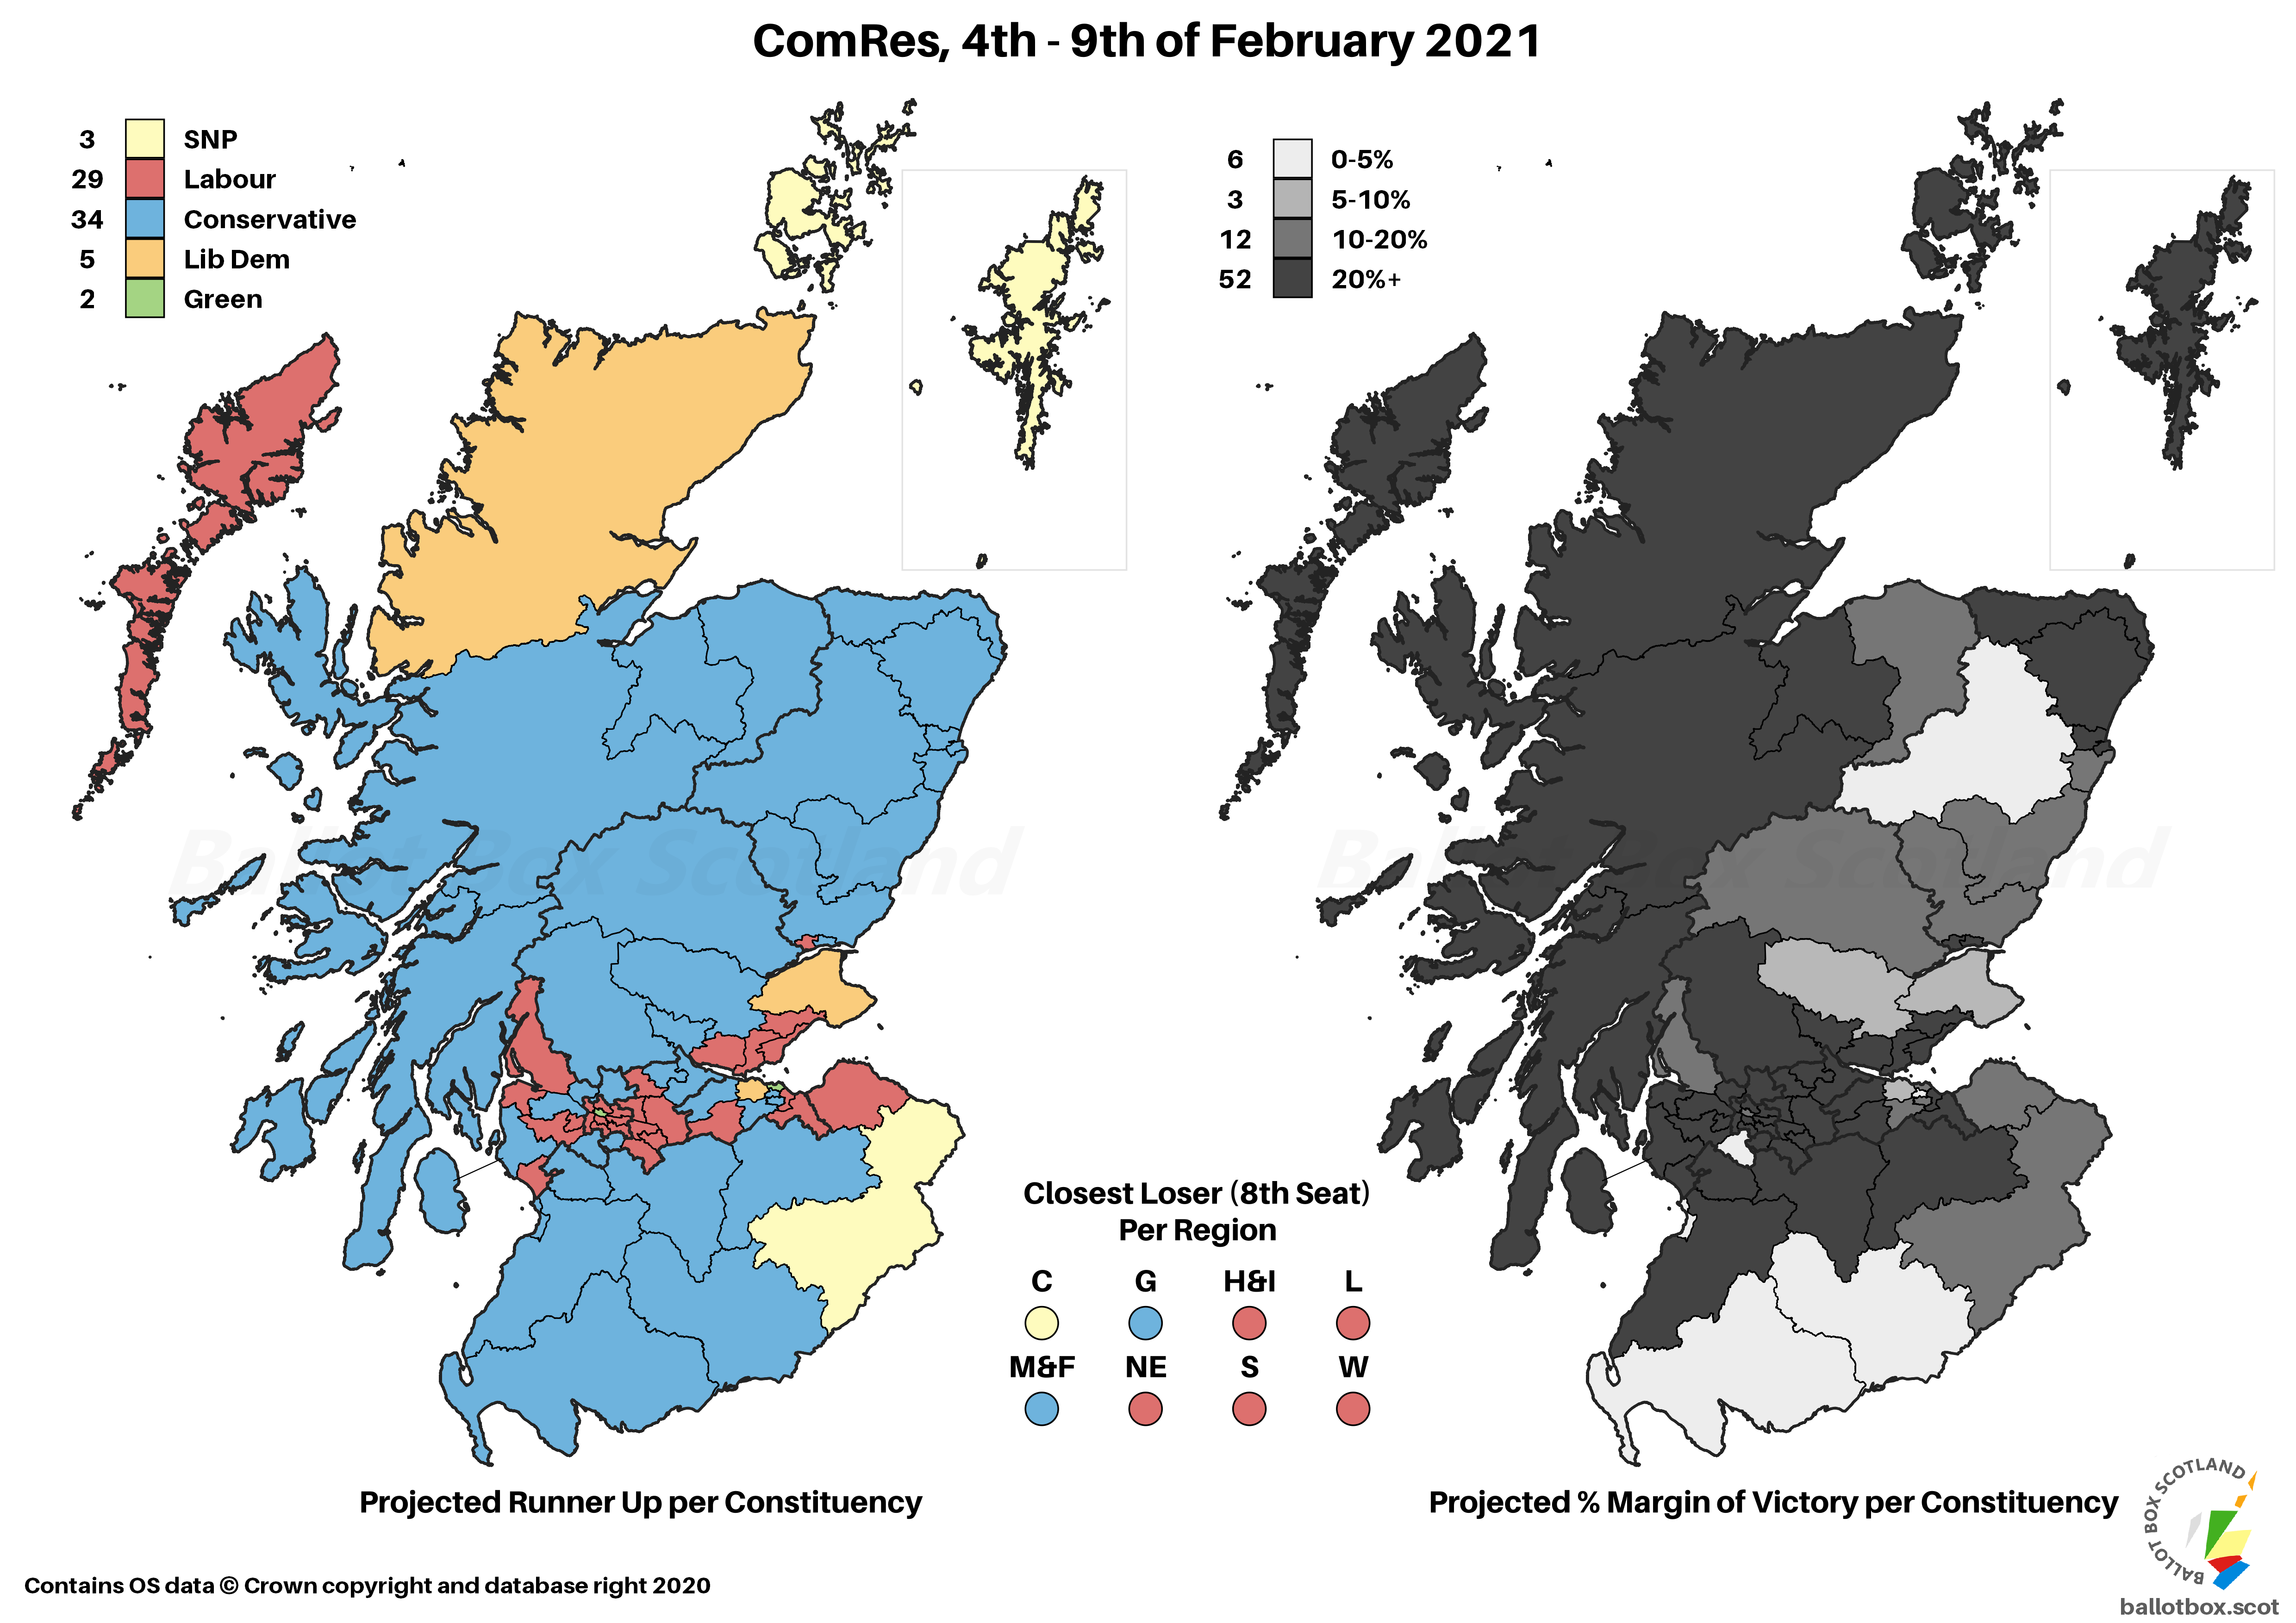
This comes out at the currently normal SNP majority plus weighty Green group, whilst the Conservative’s gains since the last poll come mostly from the Lib Dems. Given the Lib Dems are up on the proportional side of the vote since 2016 it’s somewhat cruel this is their joint worst seat projection this term – they last came out this low back in March 2017. This is the fault of that overhang phenomenon I’m always banging on about. Effectively, the SNP’s sweep of the Lothian region would deprive the Lib Dems of a seat there despite proportionally having the vote share to justify one.
No Westminster VI in ComRes still, I’m afraid.
Standard Question
Yes ~ 47% (-4)
No ~ 42% (+4)
Don't Know ~ 10% (nc)
In common with some of the other recent polls, we’re seeing ComRes suggesting a narrowing of the constitutional divide. I’d say we can safely call this a trend by this point, though whether it’s a trend that will lead back towards a pro-Union advantage or more of a reining in what had been some quite remarkable figures we’ll need to wait a bit longer to see.
Excluding Don't Knows
Yes ~ 53% (-4 / +8)
No ~ 47% (+4 / -8)
Taking out the Don’t Knows still has it as a very marginally more emphatic result than the 2016 EU Referendum, so we’re at least spared the cursèd numbers this time around. We’re getting these ComRes polls on a monthly basis at the moment, so check back in March to see what that one says!
Council Area Projection
Please see this page for how projections work and important caveats.

On a simple Uniform Swing versus 2014, this might put a total of 19 Councils in the Yes column, an increase on the 4 in 2014. No would be on 13, down from 28 at the referendum.
Council Area Projection
They’ve also continued to ask about the timing of a prospective future Independence referendum:
- In the next year – 17% (-1)
- Next two years – 18% (-1)
- Next five years – 13% (-2)
- Next ten years – 7% (nc)
- Longer than ten years – 17% (+1)
- Never – 18% (+2)
- Don’t Know – 9% (-1)
This is the first time in this series of polling that respondents favouring a referendum in the coming parliamentary term weren’t in the majority, dipping to 48% here. That’s still larger than the number who think it should be either never or in a longer timescale, which is 42%. It’s probably not a coincidence these figures are pretty closely tracking the Yes-No findings.
Hypotheticals
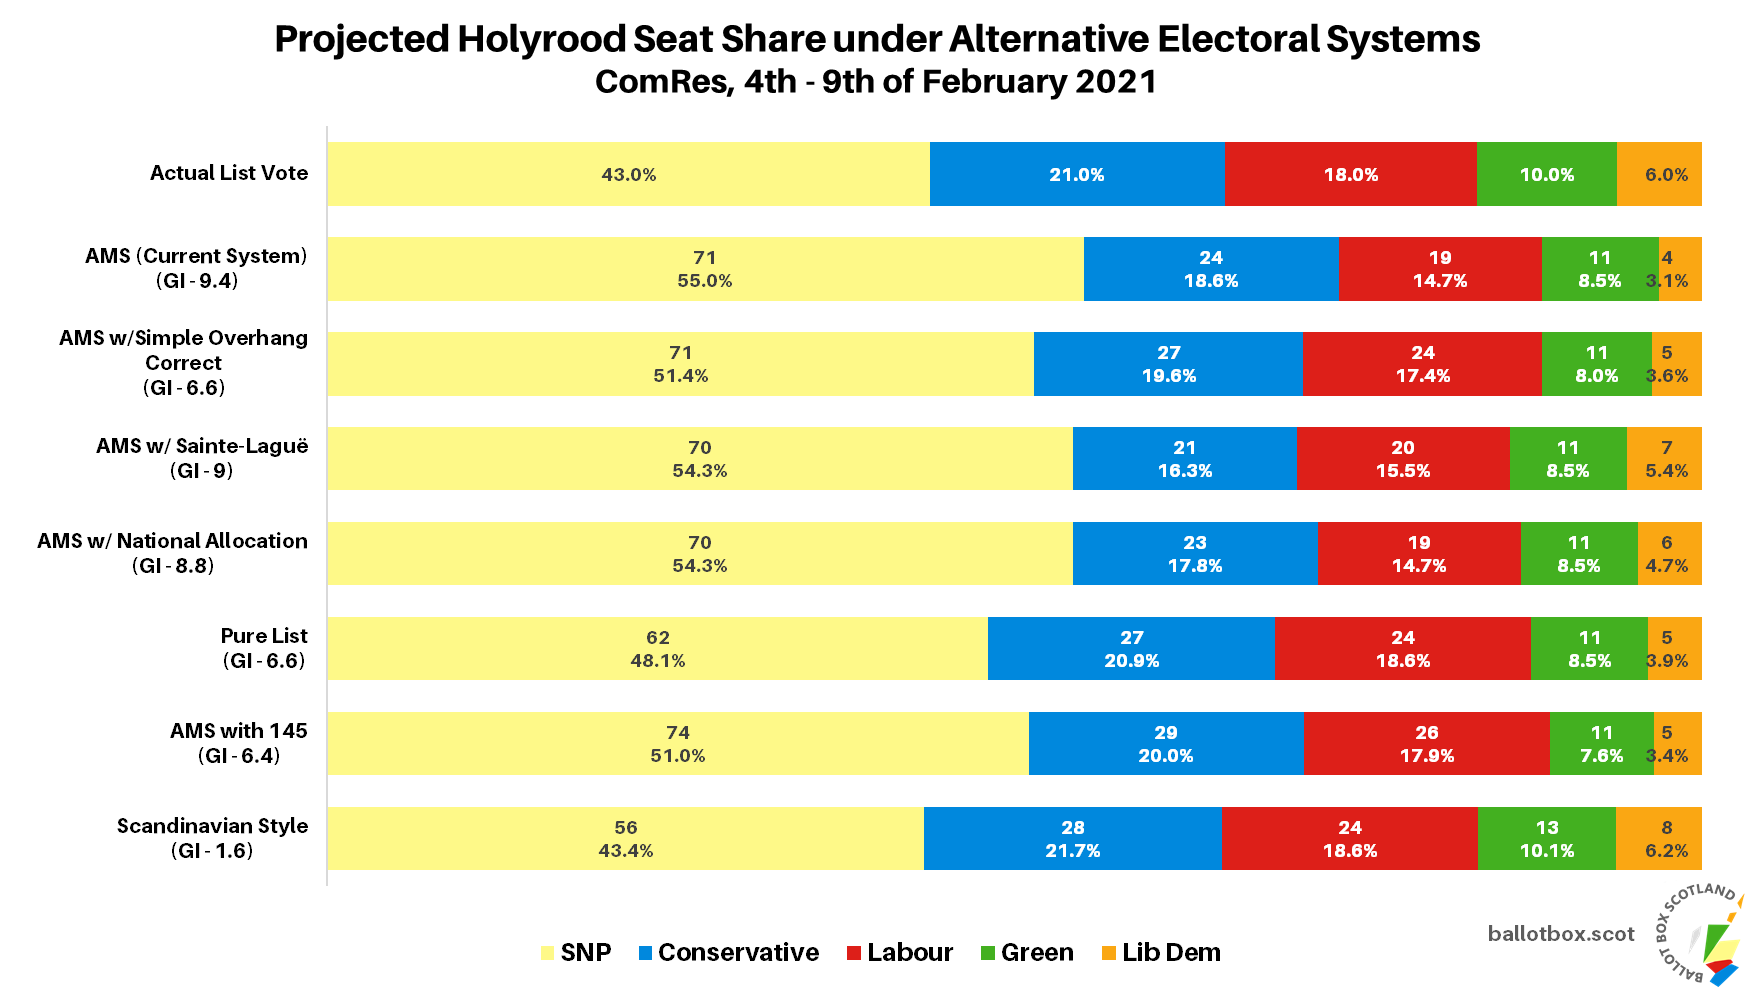
As ever, the last little bit of analysis concerns those hypothetical and more proportional voting systems that I have a bee in my bonnet about here at BBS. The fact Westminster uses pure FPTP is an affront to democracy, and though Holyrood fares far better, AMS is still deeply imperfect. The examples here simply transpose the poll findings onto more proportional voting systems – the reality is that different systems would of course result in different voter behaviour.
Changes here are vs AMS / vs same projection for the last poll.
SNP ~ 56 (-15 / -2)
Conservative ~ 28 (+4 / +7)
Labour ~ 24 (+5 / nc)
Green ~ 13 (+2 / -2)
Liberal Democrat ~ 8 (+4 / -3)

This hypothetical always shows a greatly deflated SNP seat share, with a recent low on the list vote naturally translating to a low in terms of seats. Everyone else benefits when the SNP aren’t able to get the boost from First Past the Post seats, though the caveat folk would vote a bit differently with a purely proportional system of course applies. A relatively strong Green vote however keeps the balance in favour of the Pro-Independence parties, at 69 seats versus 60 for their Pro-Union counterparts.
If you find this or other Ballot Box Scotland output useful and/or interesting, and you can afford to do so, please consider donating to support my work. I love doing this, but it’s a one-man project and takes a lot of time and effort. All donations, no matter how small, are greatly appreciated and extremely helpful.
(About Donations)