It’s no secret that here at Ballot Box Scotland, I’m a massive nerd for electoral systems. In addition to BBS taking a strong line in favour of Proportional Representation, I also regularly chat about possible alternatives to the only partly-proportional systems we currently use in Scotland. The most prominent of these is of course the full Scandinavian Style System, which I finally got around to giving a very thorough explanation of in my second Ballot Box Briefing.
Over the years I’ve bolted on a range of other tweaks to my Scottish Parliament calculator, sometimes out of my own curiosity, sometimes because someone specifically asked about a particular form of voting. These have mostly been for my own enjoyment, but as early pandemic boredom was already striking in March, eagle eyed readers may have noticed the appearance of a new chart in my polling and projection posts. This one takes the output from all those alternative systems and shows the % share of seats per party. A second poll slipped out before I could write this post explaining them, as I’d wanted to get that Briefing out the way first. The version for the 2016 Election is below;
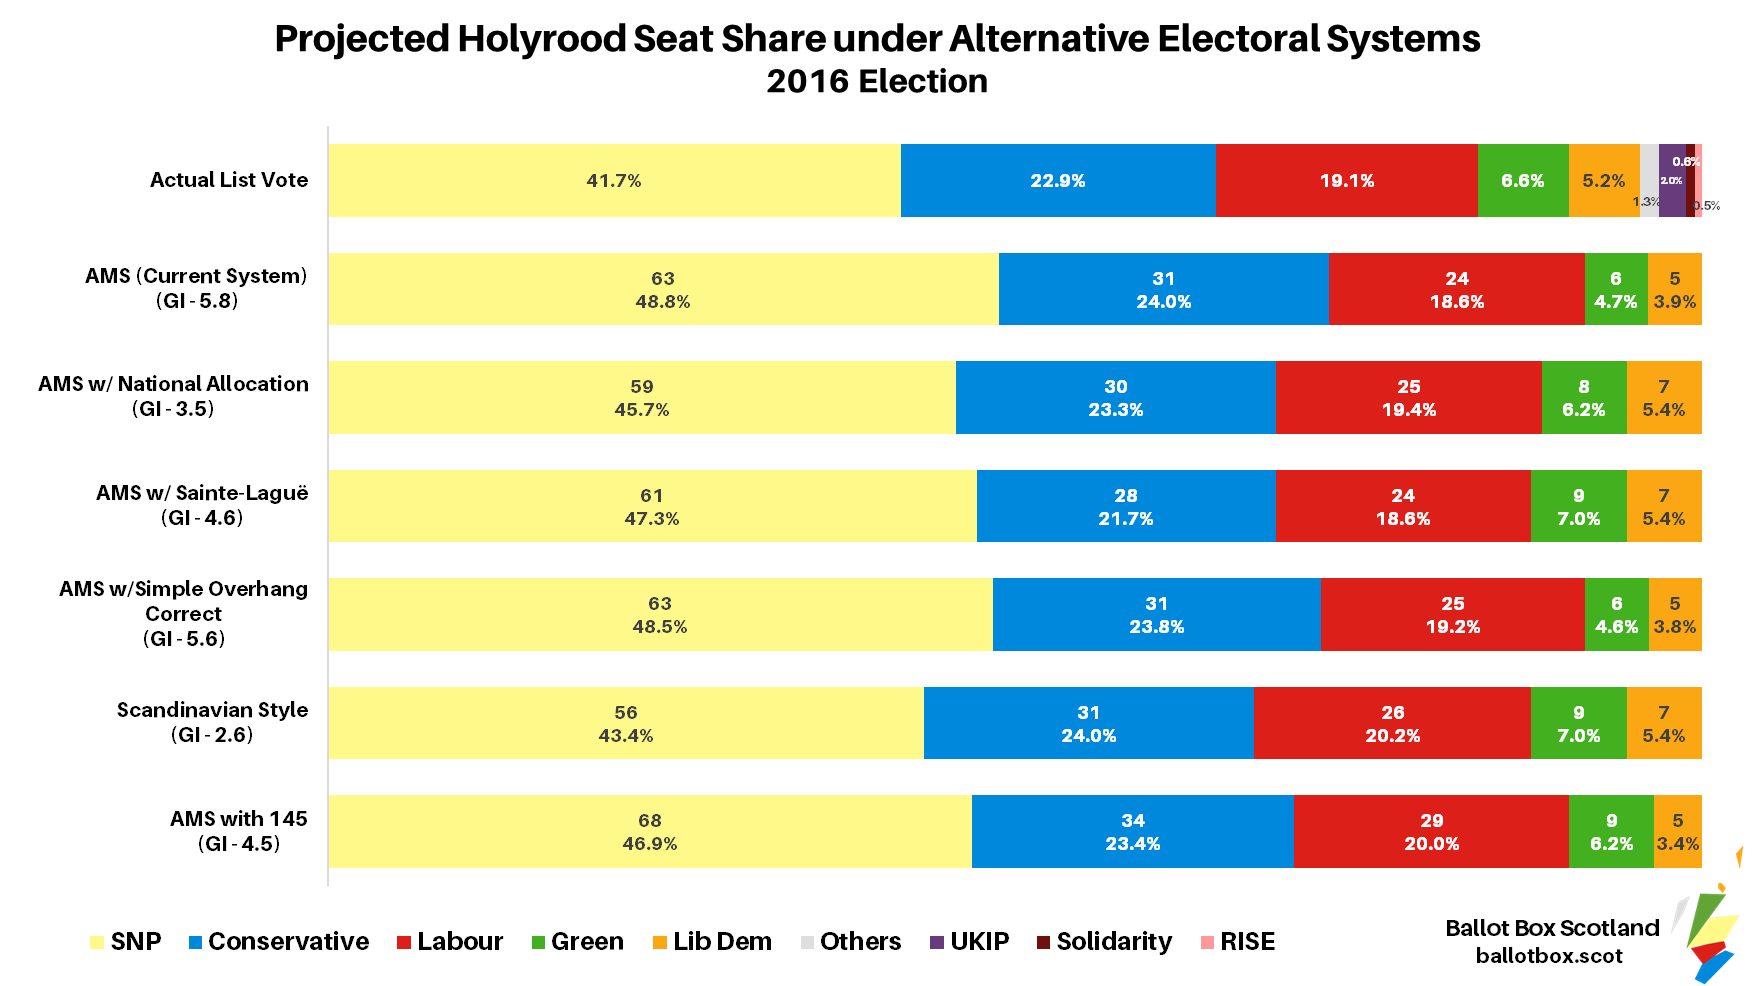
The point this makes is that the current system isn’t necessarily brilliantly proportional. Most of these keep the fabric of the current AMS system intact, they just change some of the mechanics for seat allocation. Only the Scandinavian Style rips up the entire system and starts over. This post gives a brief description of how each of these works, as well as what they’d have looked like using 2016 list vote figures, both in terms of seats and the “Gallagher Index” which measures proportionality – remember, the closer to 0 the GI is, the more proportional the result.
2016 List Vote Results
- SNP – 41.7%
- Conservative – 22.9%
- Labour – 19.1%
- Green – 6.6%
- Liberal Democrat – 5.2%
- UKIP – 2.0%
AMS (Current System)
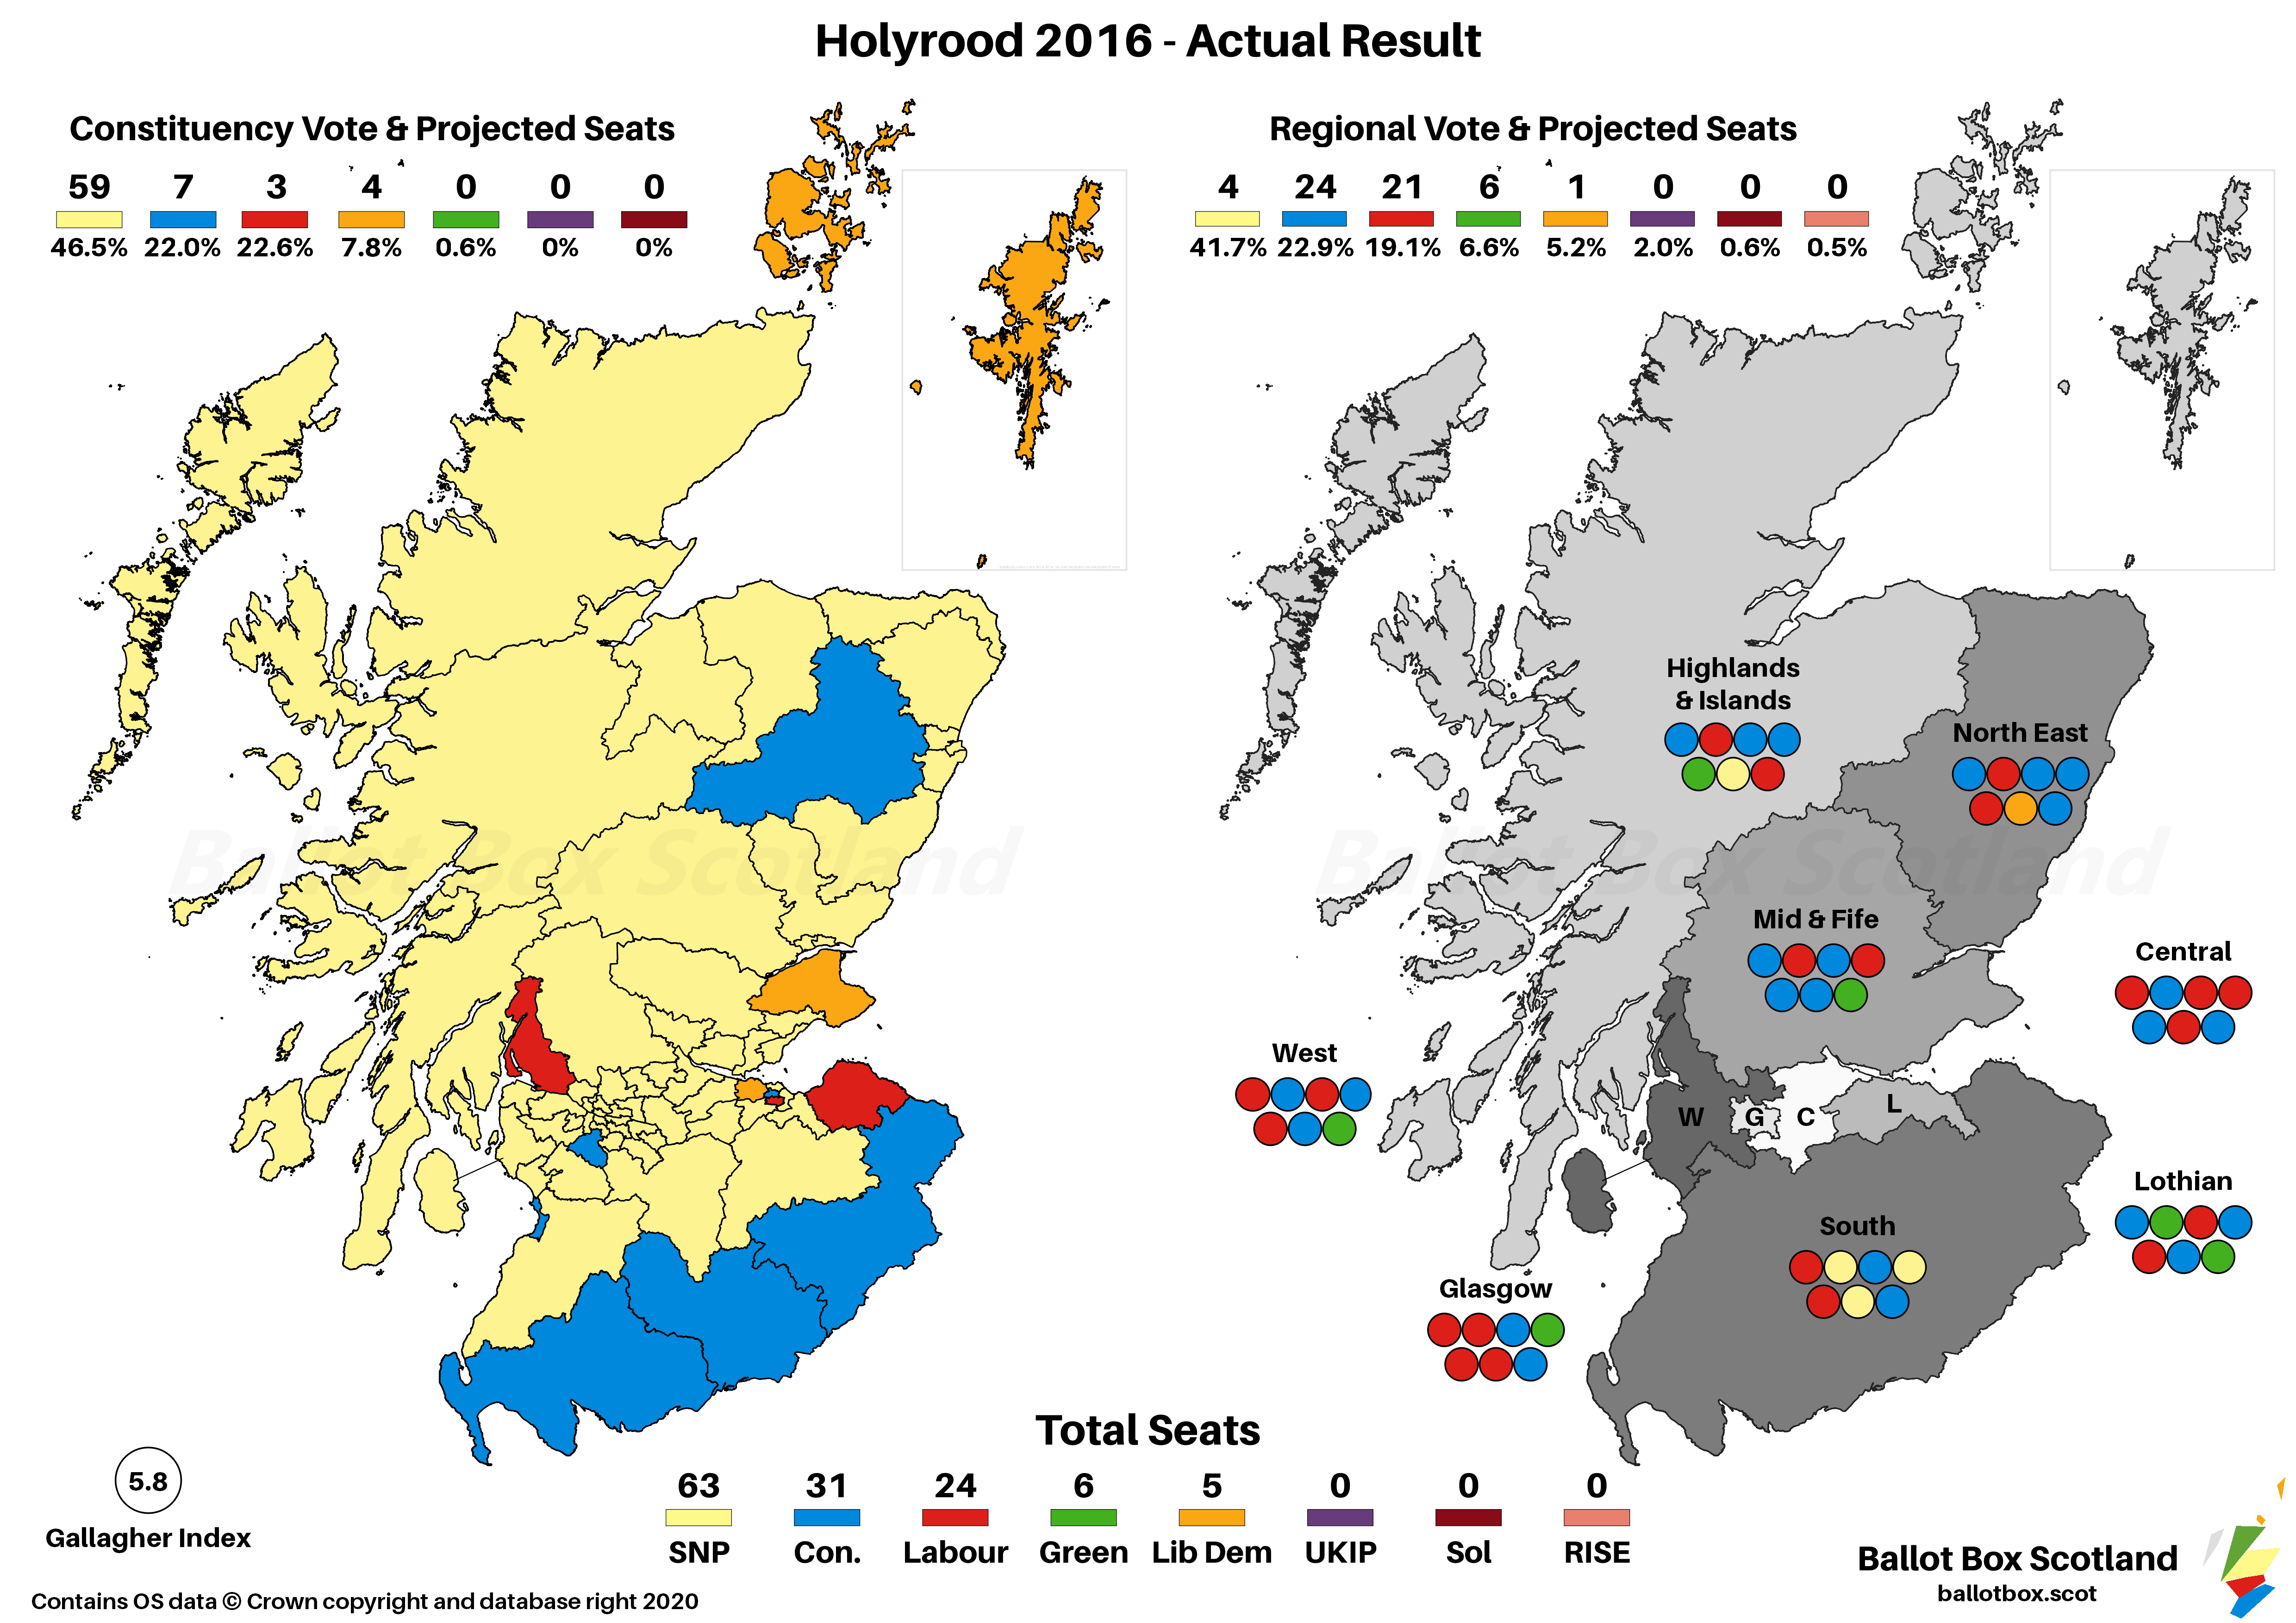
The actual result of the 2016 election is obviously essential for purposes of comparison. The total number and percentage share of seats per party was;
- SNP – 63 (48.8%)
- Conservative – 31 (24.0%)
- Labour – 24 (18.6%)
- Green – 6 (4.7%)
- Liberal Democrat – 5 (3.9%)
The SNP ended up a fair bit over-represented thanks to their dominance of the constituency vote, which is a known issue with AMS. In the middle, the Conservatives come out roughly spot on in that they won about 24% of the total vote for the 5 parties who ended up in parliament. Meanwhile, Labour, the Greens and Lib Dems all came below their fair share. Overall, this resulted in a Gallagher Index of 5.8.
AMS with National Allocation
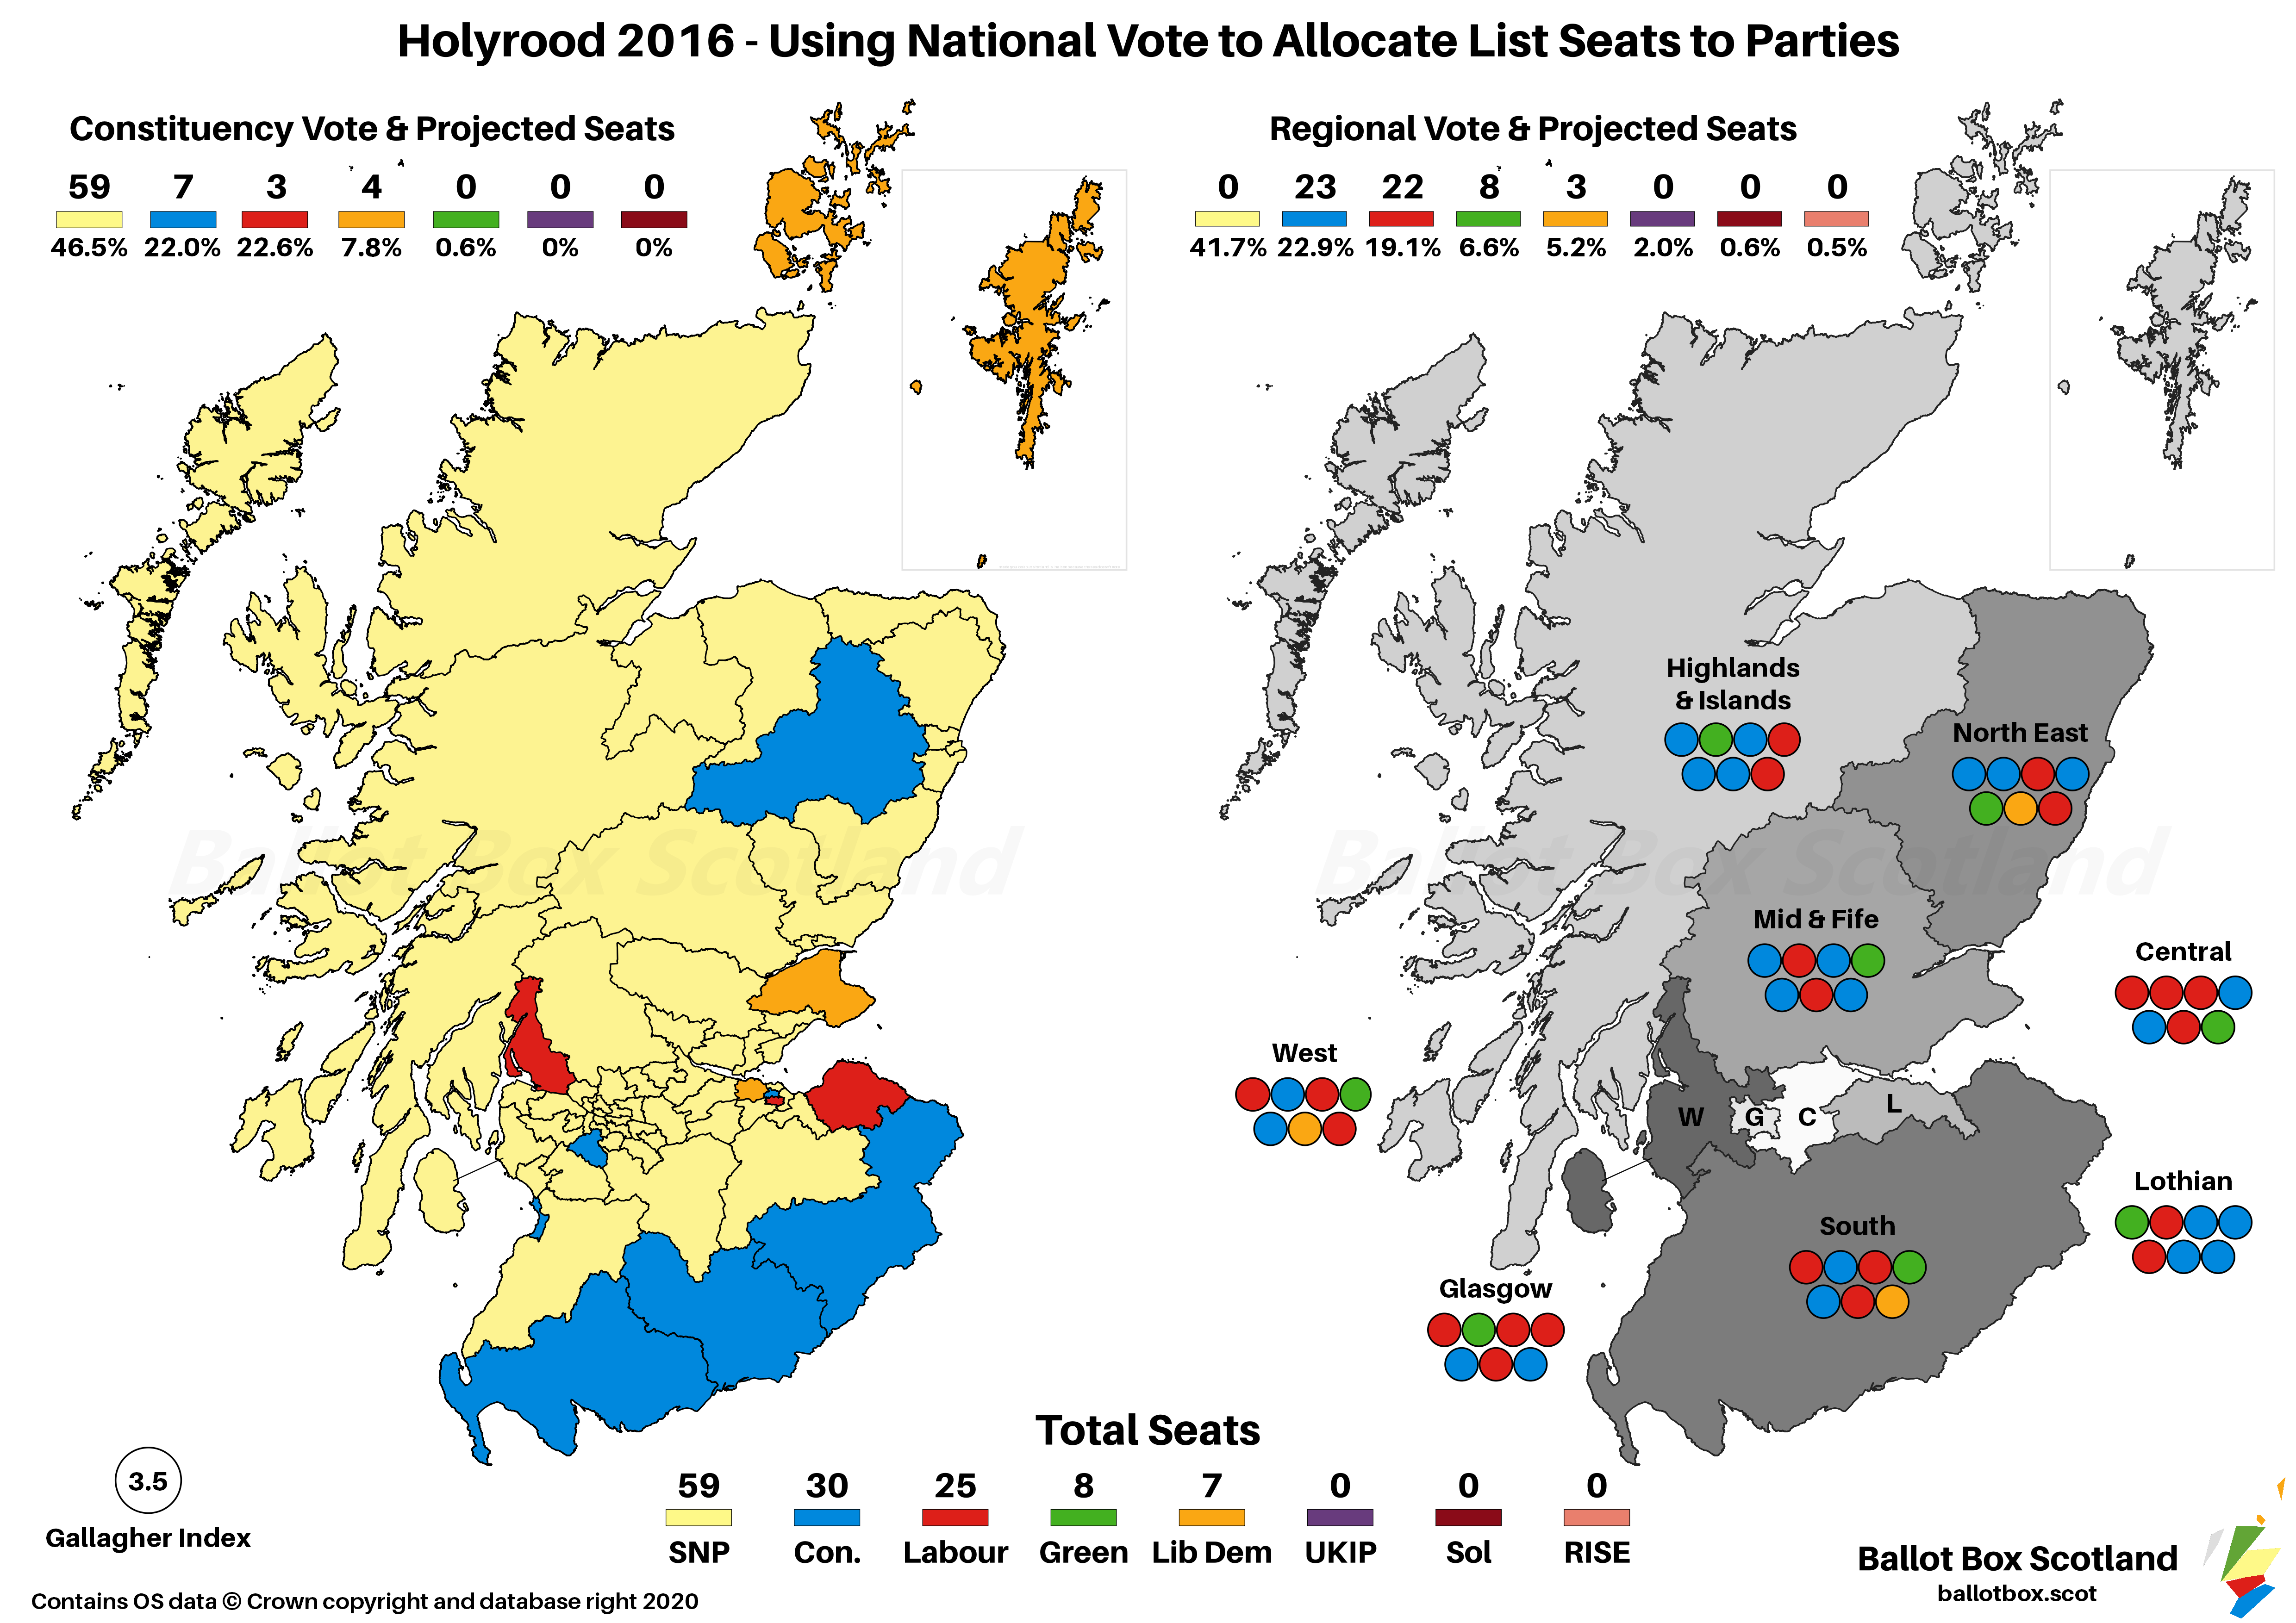
The difference between this one and AMS as it currently stands is that the national share of the vote is used to allocate list seats to parties. The regional vote then determines where those seats go, in the same way as the levelling seats in the Scandinavian System. The total number and percentage share of seats per party would have been;
- SNP – 59 (45.7%)
- Conservative – 30 (23.3%)
- Labour – 25 (19.4%)
- Green – 8 (6.2%)
- Lib Dem – 7 (5.4%)
This means the SNP don’t win any of the list seats which somewhat reduces their over-representation, but it doesn’t go all the way. There are some other interesting little things with this one, such as the Green seats being perfectly spread one per region, whereas of the six they won in reality, two were in Lothian. The proportionality here gives a pretty low GI of 3.5.
AMS with Sainte-Laguë
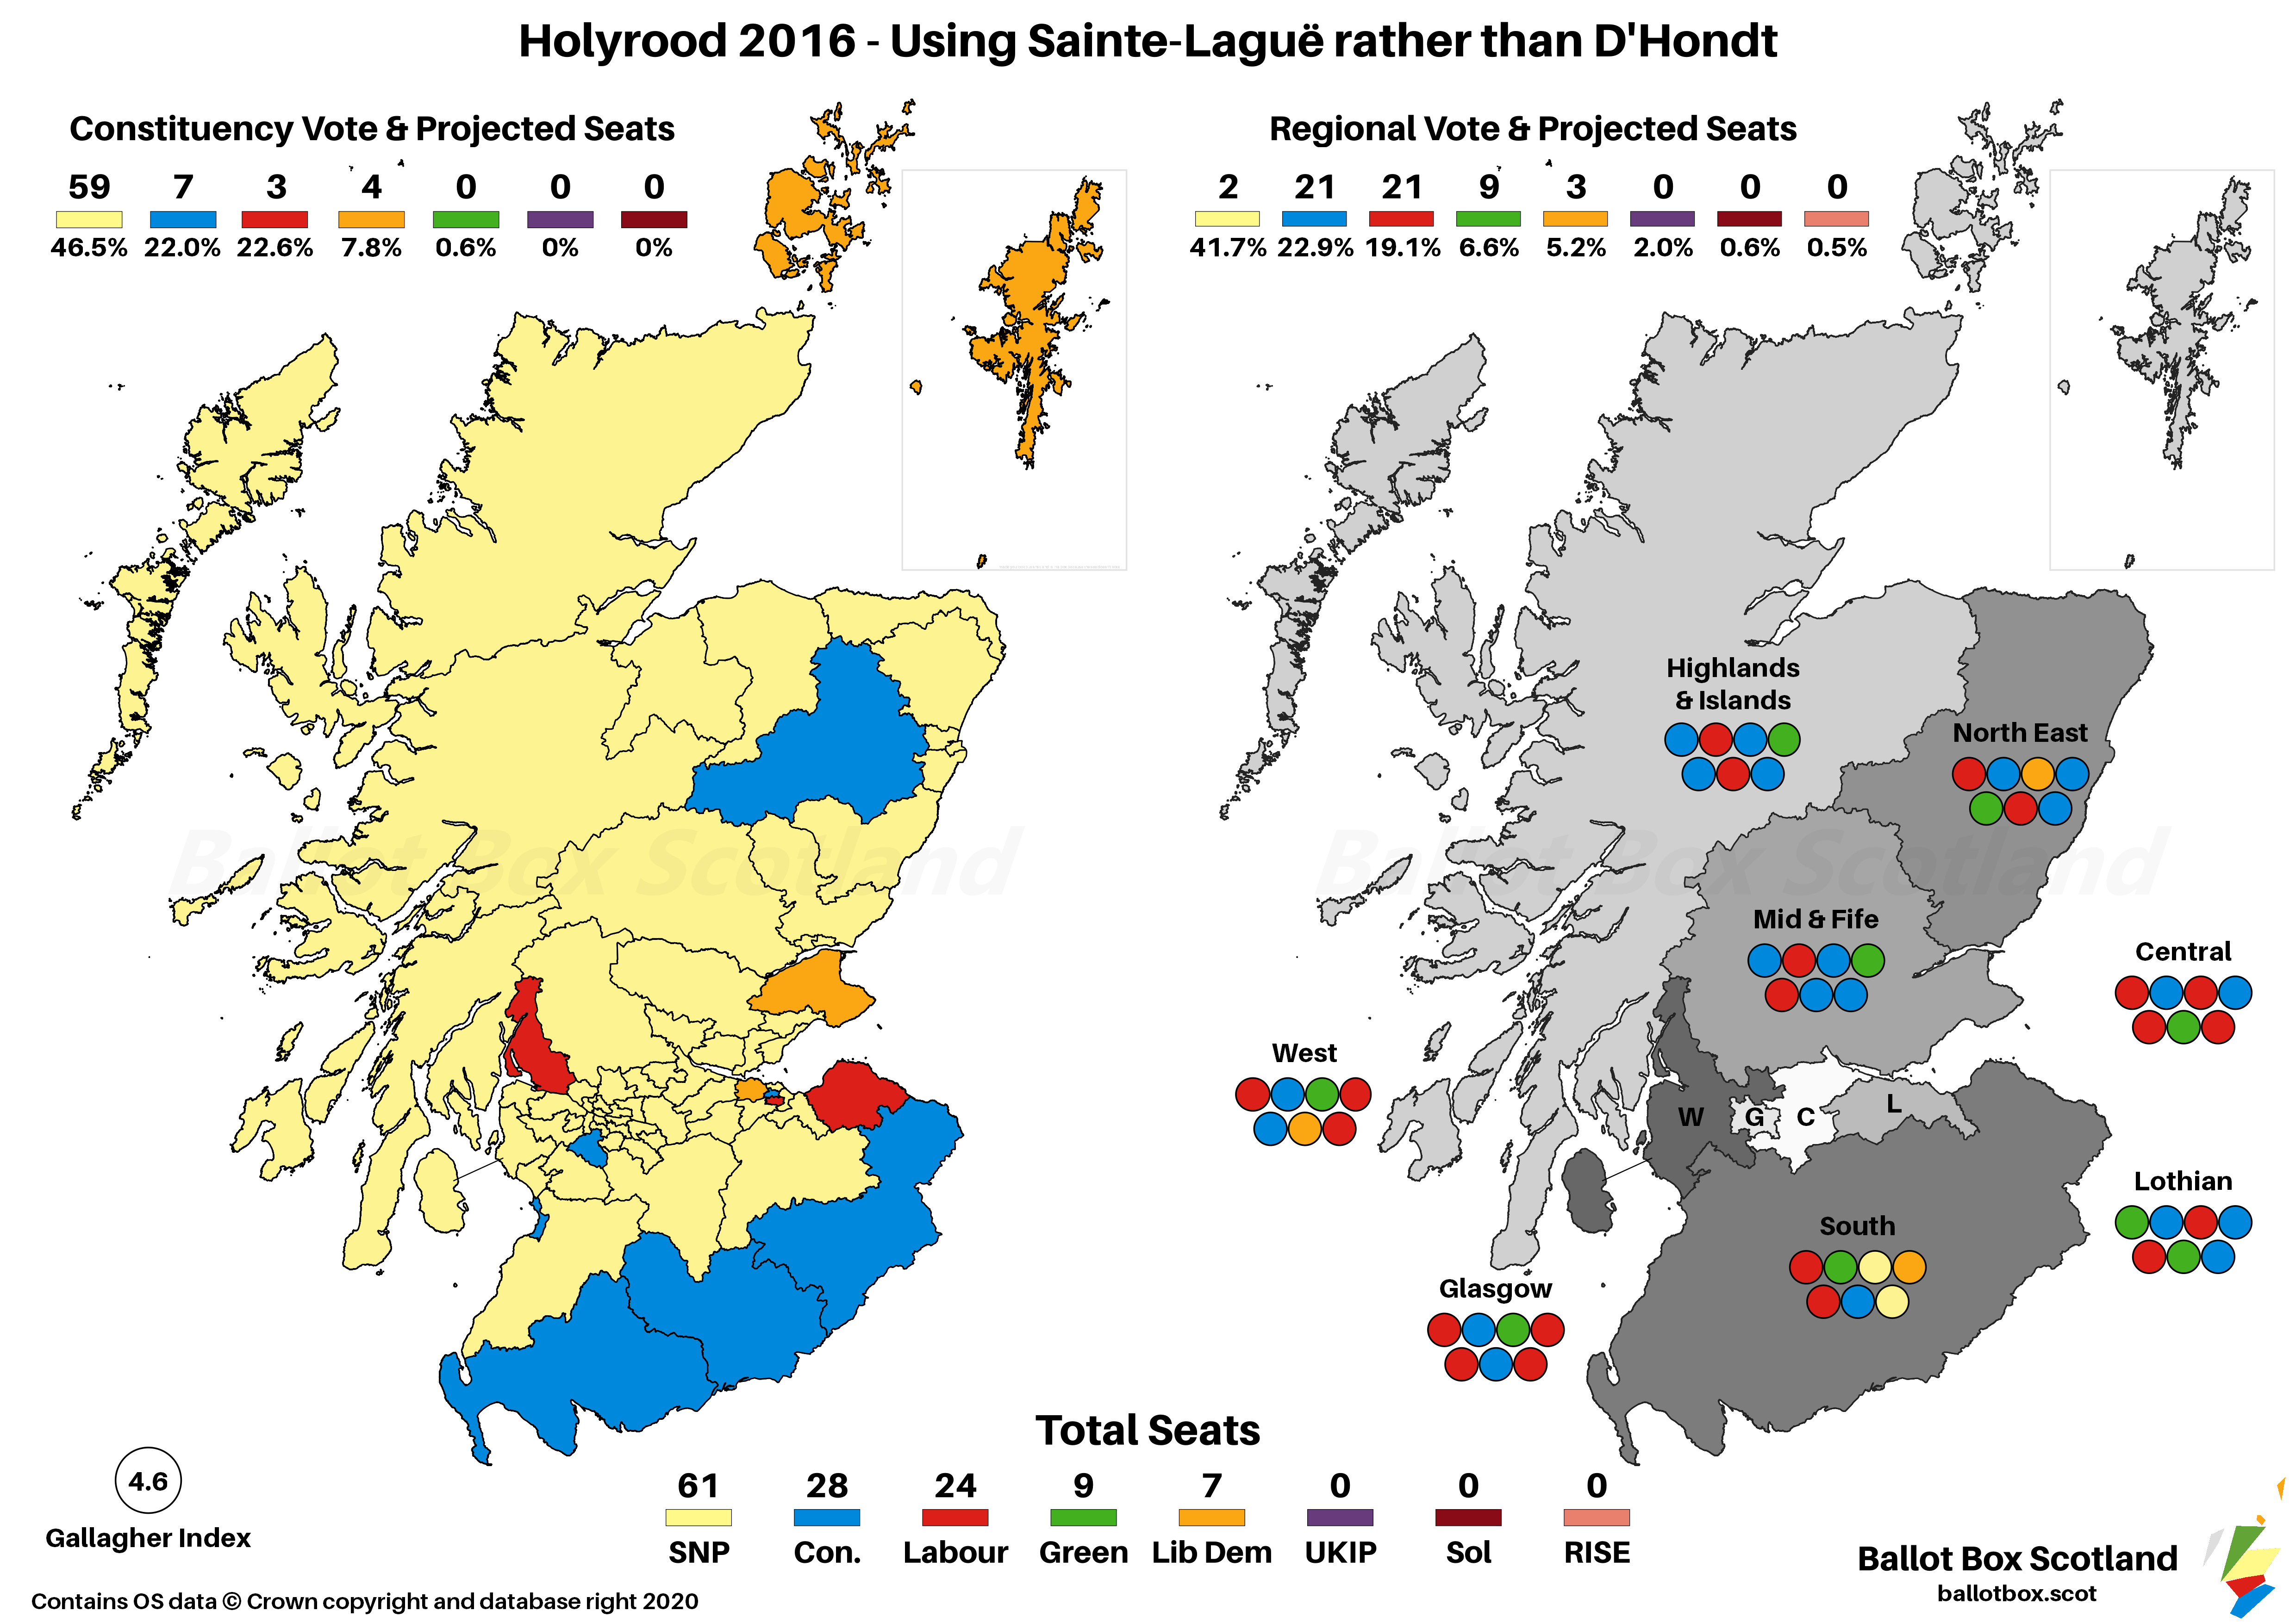
All this does is change the formula for allocating list seats from D’Hondt (divide votes by one more than seats won so far) to Sainte-Laguë (divide votes by one more than twice the seats won so far). This is moderately more favourable to smaller parties, especially when electing a relatively small number of seats per area. The total number and percentage share of seats per party would have been;
- SNP – 61 (47.3%)
- Conservative – 28 (21.7%)
- Labour – 24 (18.6%)
- Green – 9 (7.0%)
- Lib Dem – 7 (5.4%)
By favouring those smaller parties, it’s both the SNP and the Conservatives who lose out versus D’Hondt, to the benefit of the Greens and Lib Dems. As the SNP still pick up a couple of list seats, this one isn’t vastly more proportional than D’Hondt, with a GI of 4.6.
AMS with Simple Overhang Correction
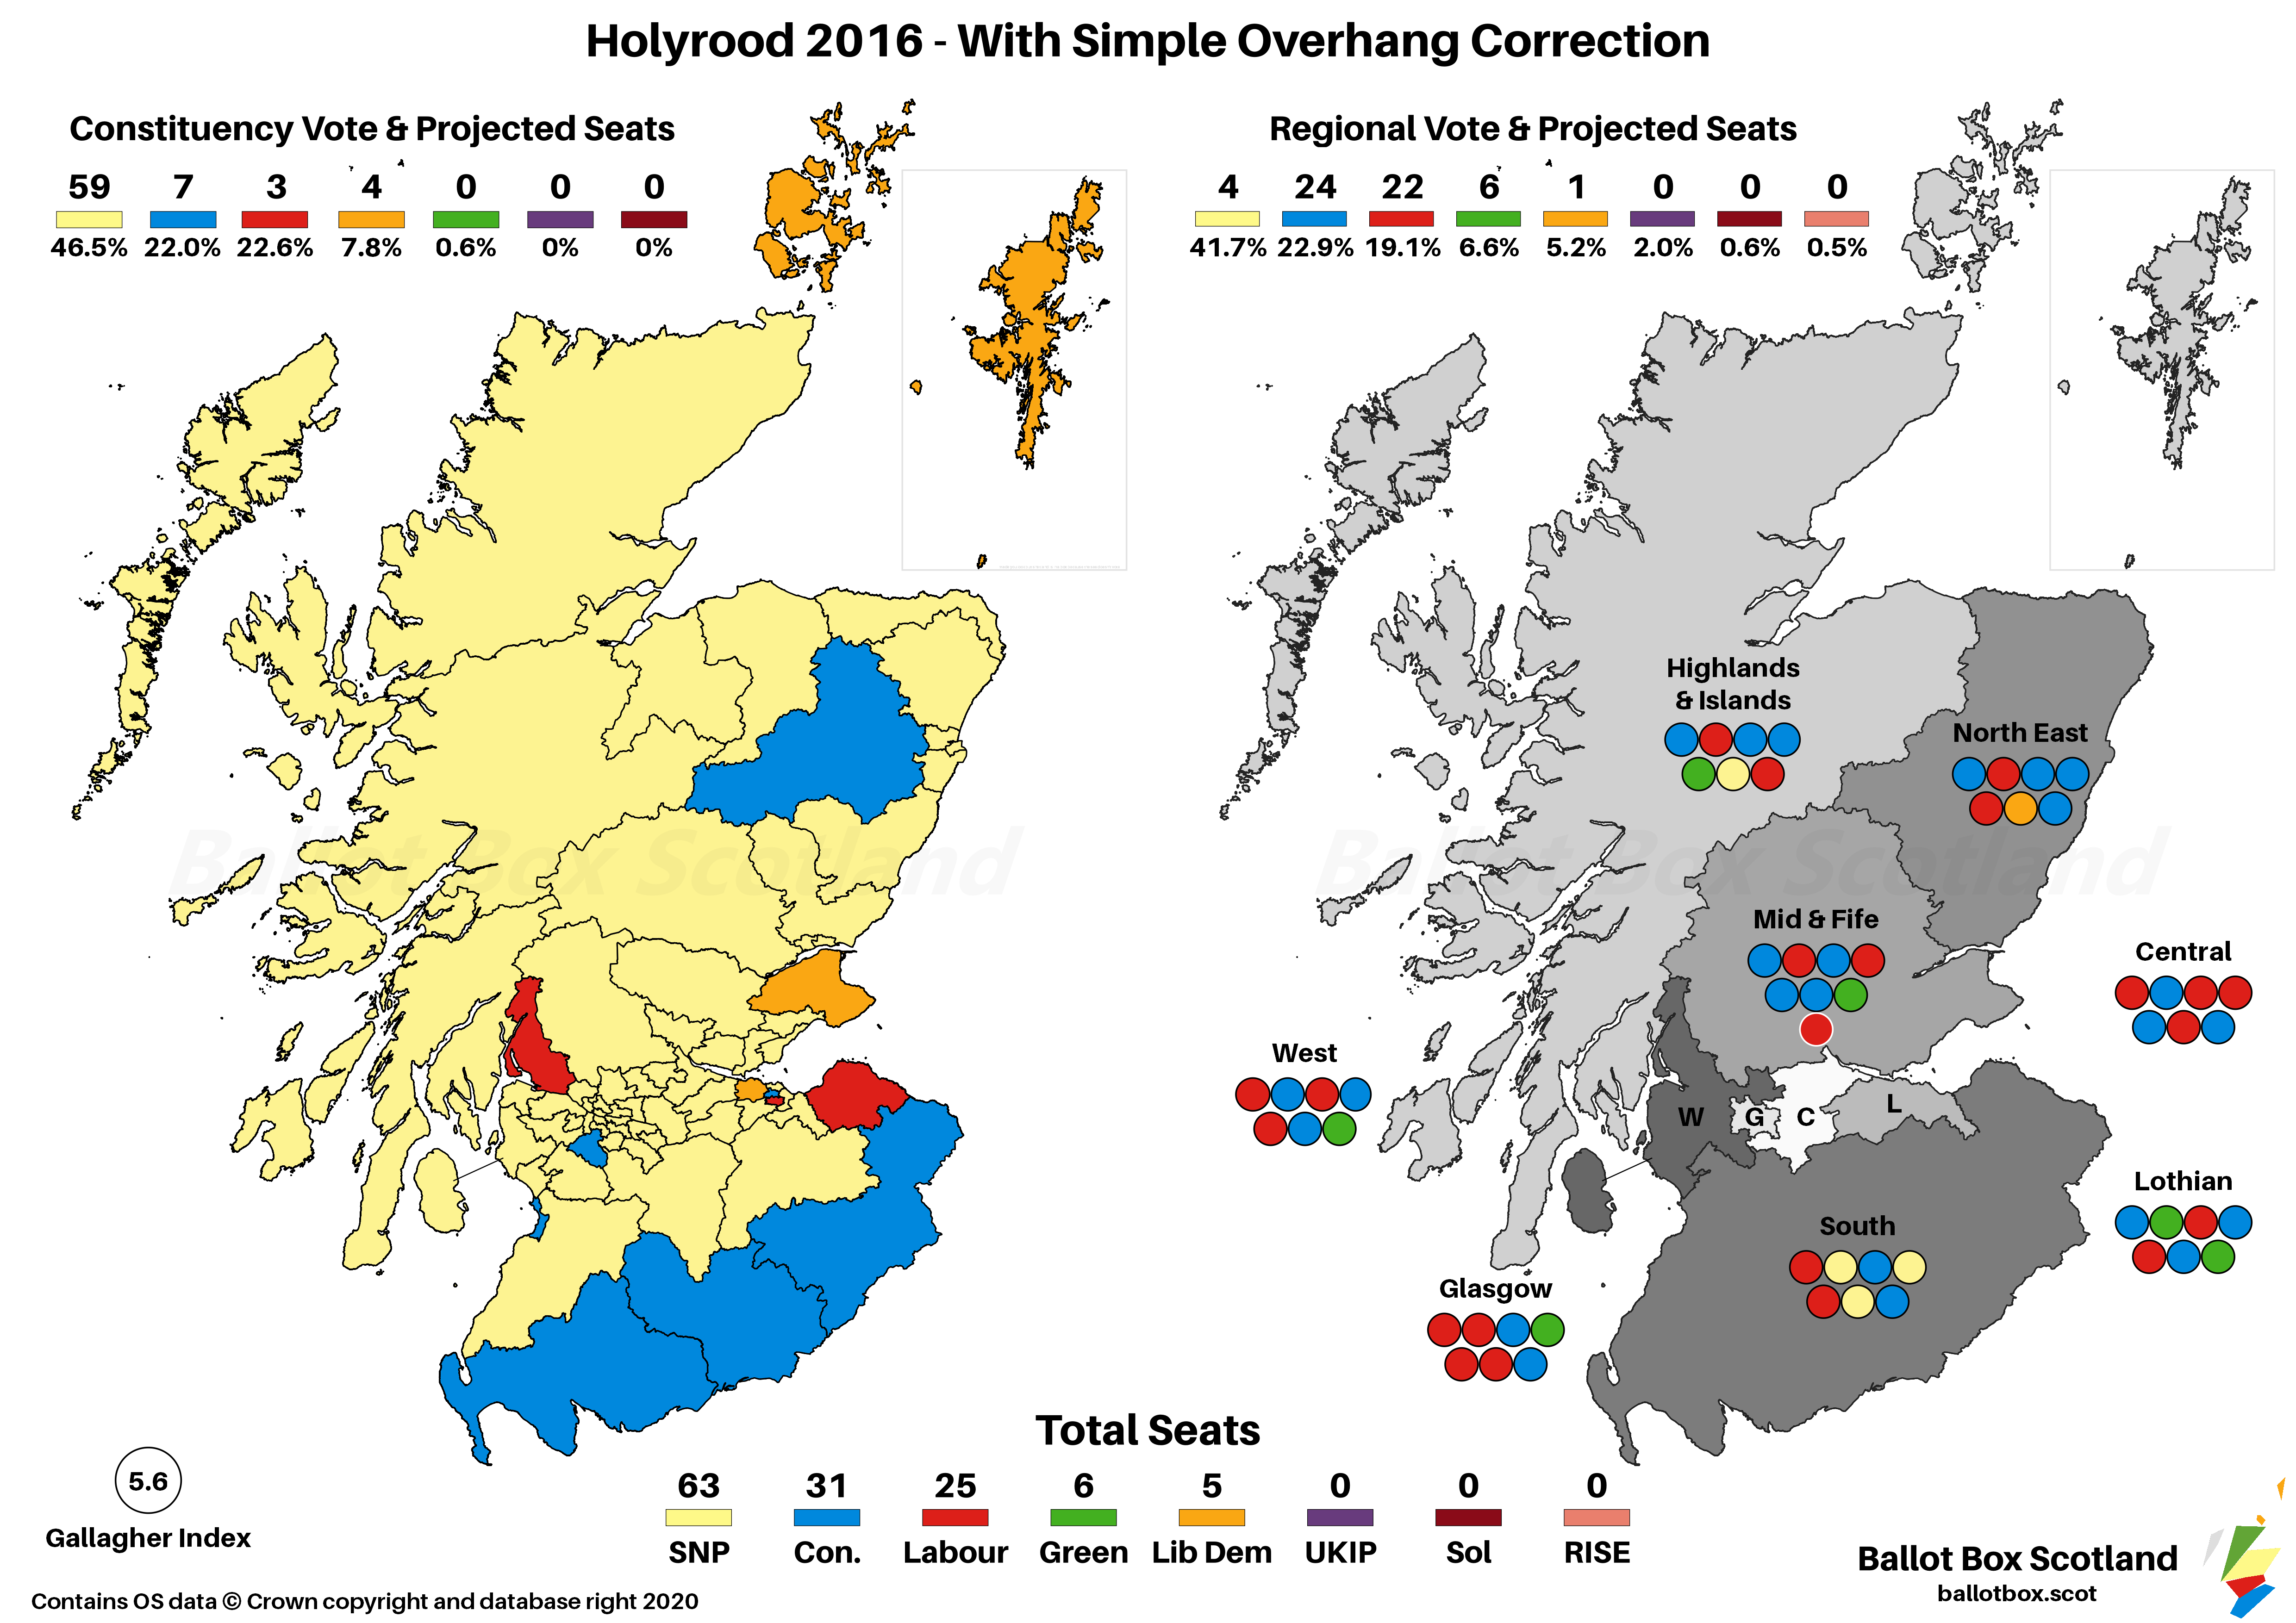
I’ve talked about Overhang on here before, as well as on Twitter the other day. This is when a party wins so many constituency seats it knocks off the proportionality of the lists. This version offers a simple correction to that, by giving extra list seats to the parties that would have lost out. The total number and percentage share of seats per party would have been;
- SNP – 63 (48.5%)
- Conservative – 31 (23.8%)
- Labour – 25 (19.2%)
- Green – 6 (4.6%)
- Lib Dem – 5 (3.8%)
2016 had a really mild overhang, so it’s just one more Labour seat in Mid Scotland and Fife. Although it doesn’t change the proportionality much, only going down to 5.6 on the Gallagher Index, this version has the potential to be the biggest change to the system’s mechanics short of the Scandinavian Style rework, as previous elections would have seen it add as many as 7 more MSPs to Holyrood.
Scandinavian Style
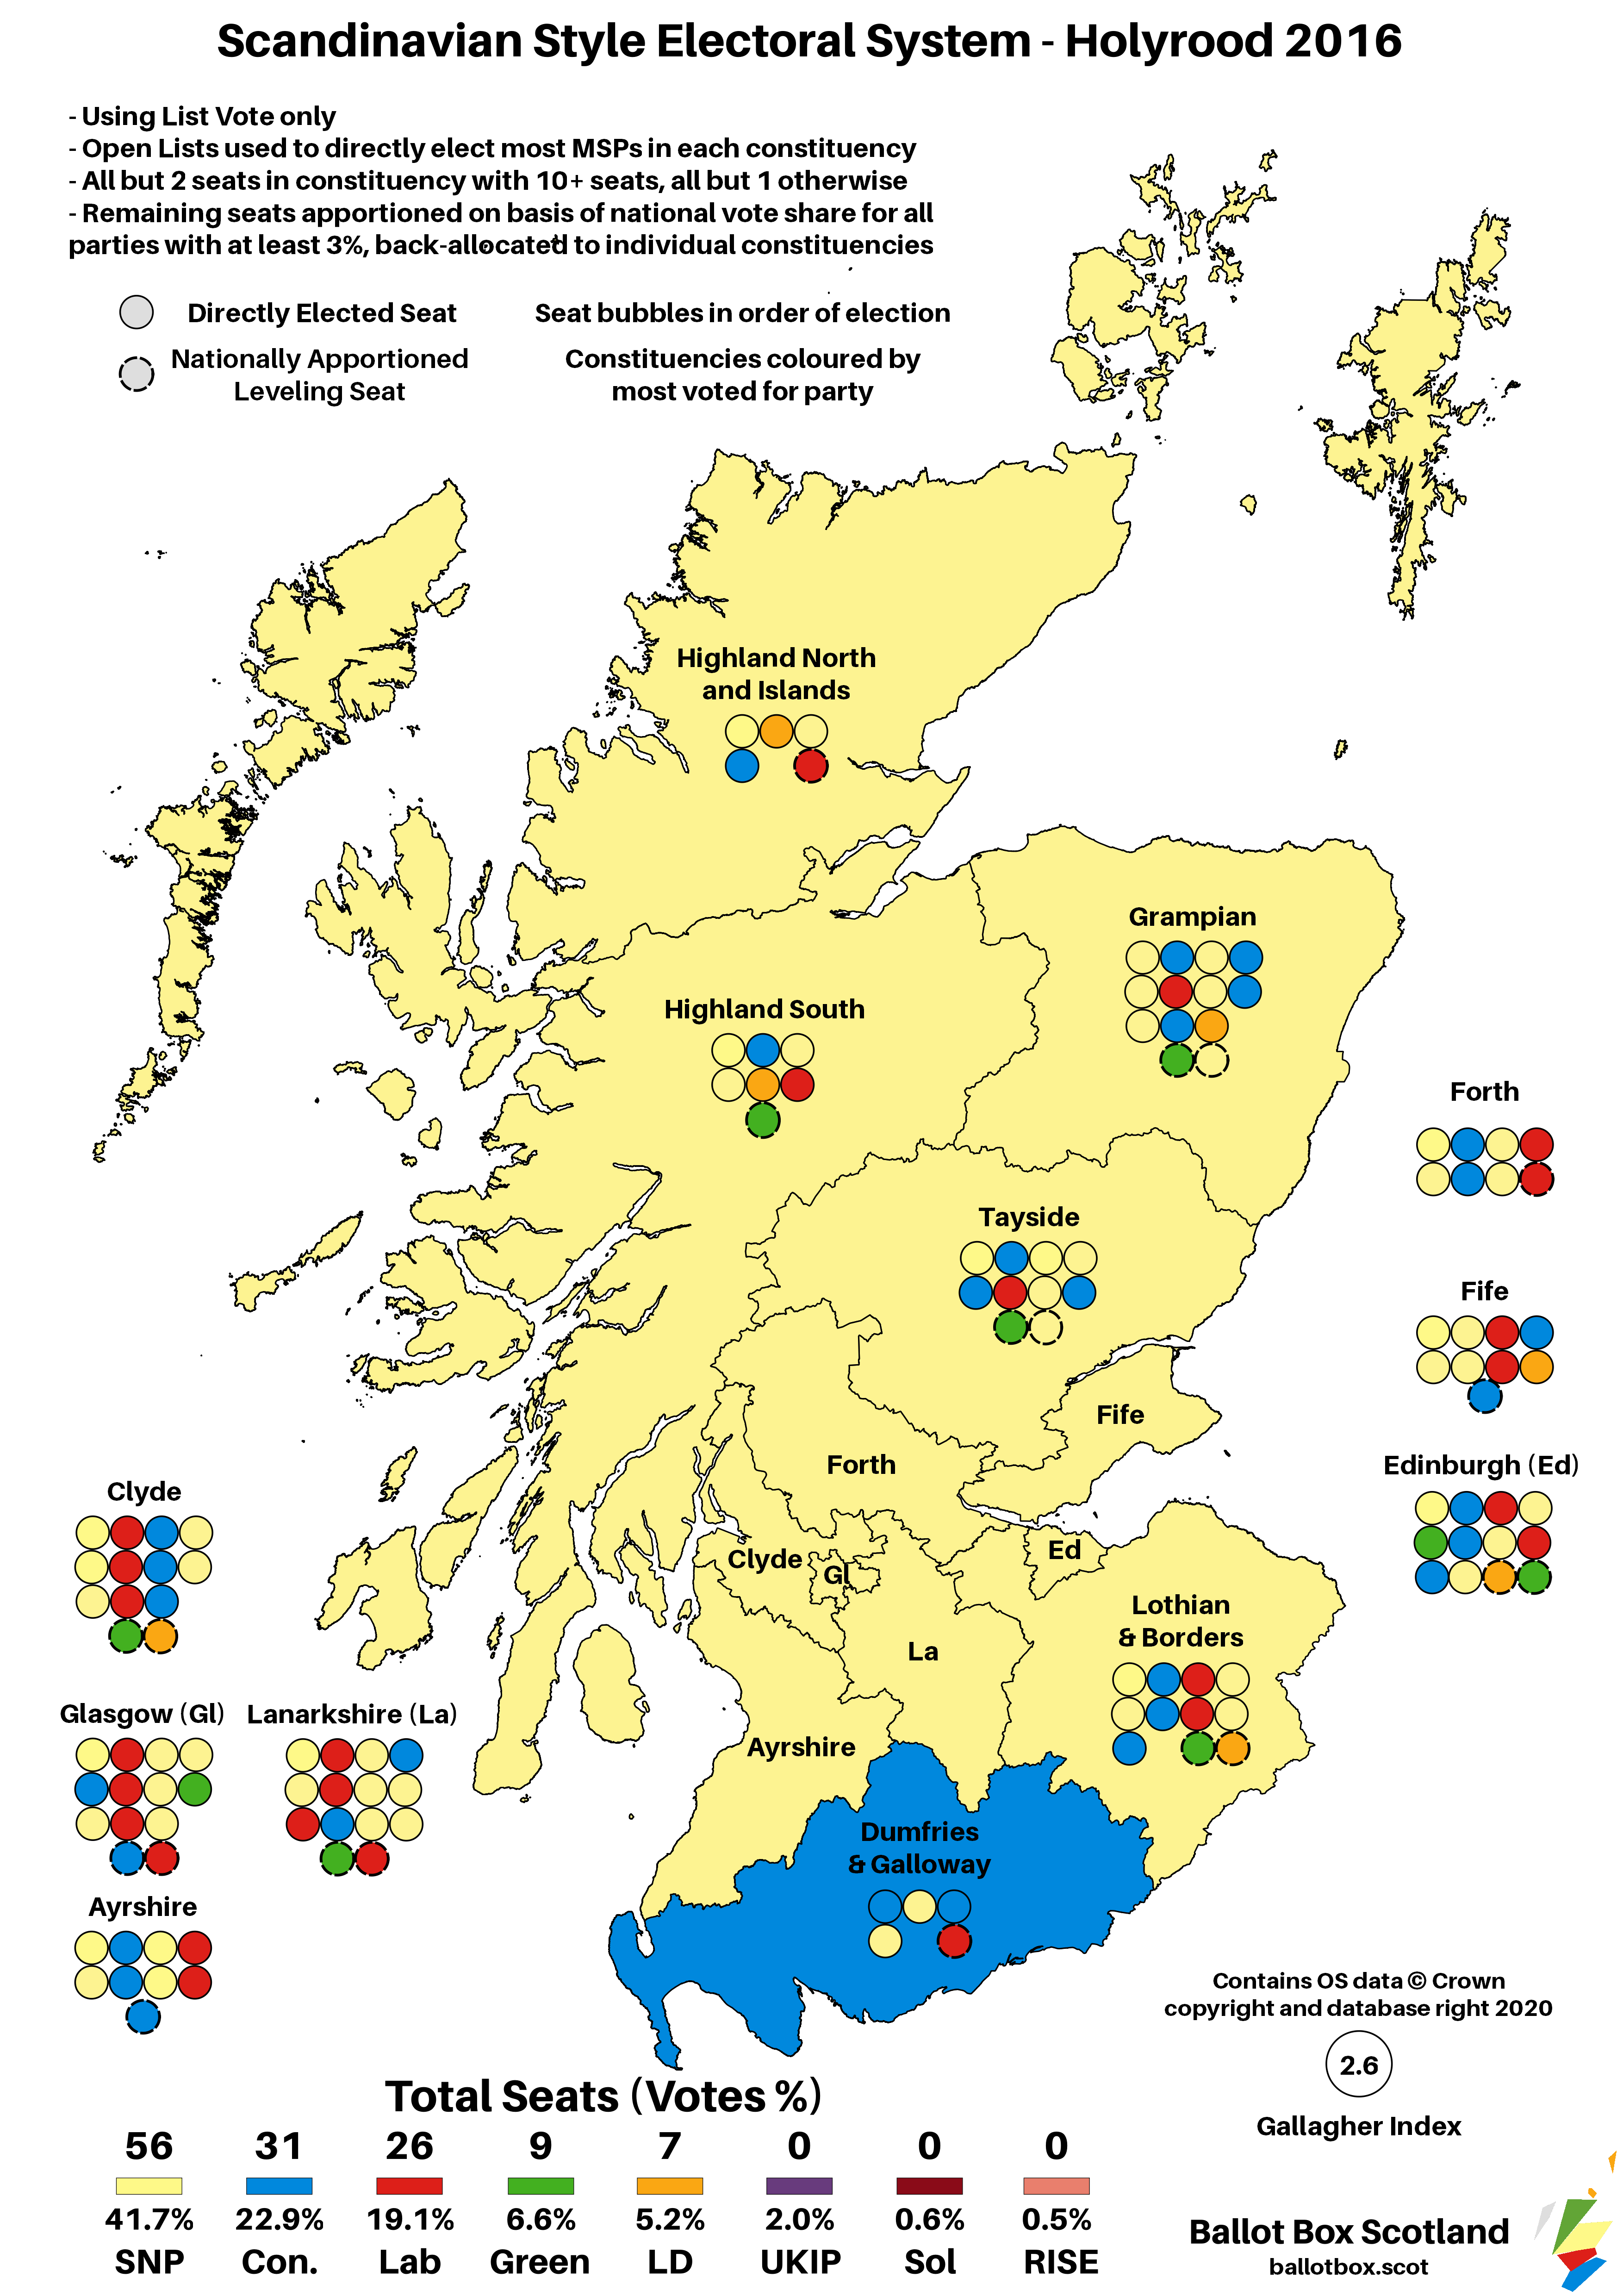
As noted earlier, this is a completely new system that preserves almost none of the machinery of AMS. See the briefing for full details about it! The total number and percentage share of seats per party would have been;
- SNP – 56 (43.4%)
- Conservative – 31 (24.0%)
- Labour – 26 (20.2%)
- Green – 9 (7.0%)
- Lib Dem – 7 (5.4%)
As there are no constituency seats here and this is driven entirely by the list vote, this is effectively maximum proportionality, at least for the parties winning more than 3% of the vote. That drives the GI down to just 2.6, the lowest of any system covered here.
AMS with 145 MSPs
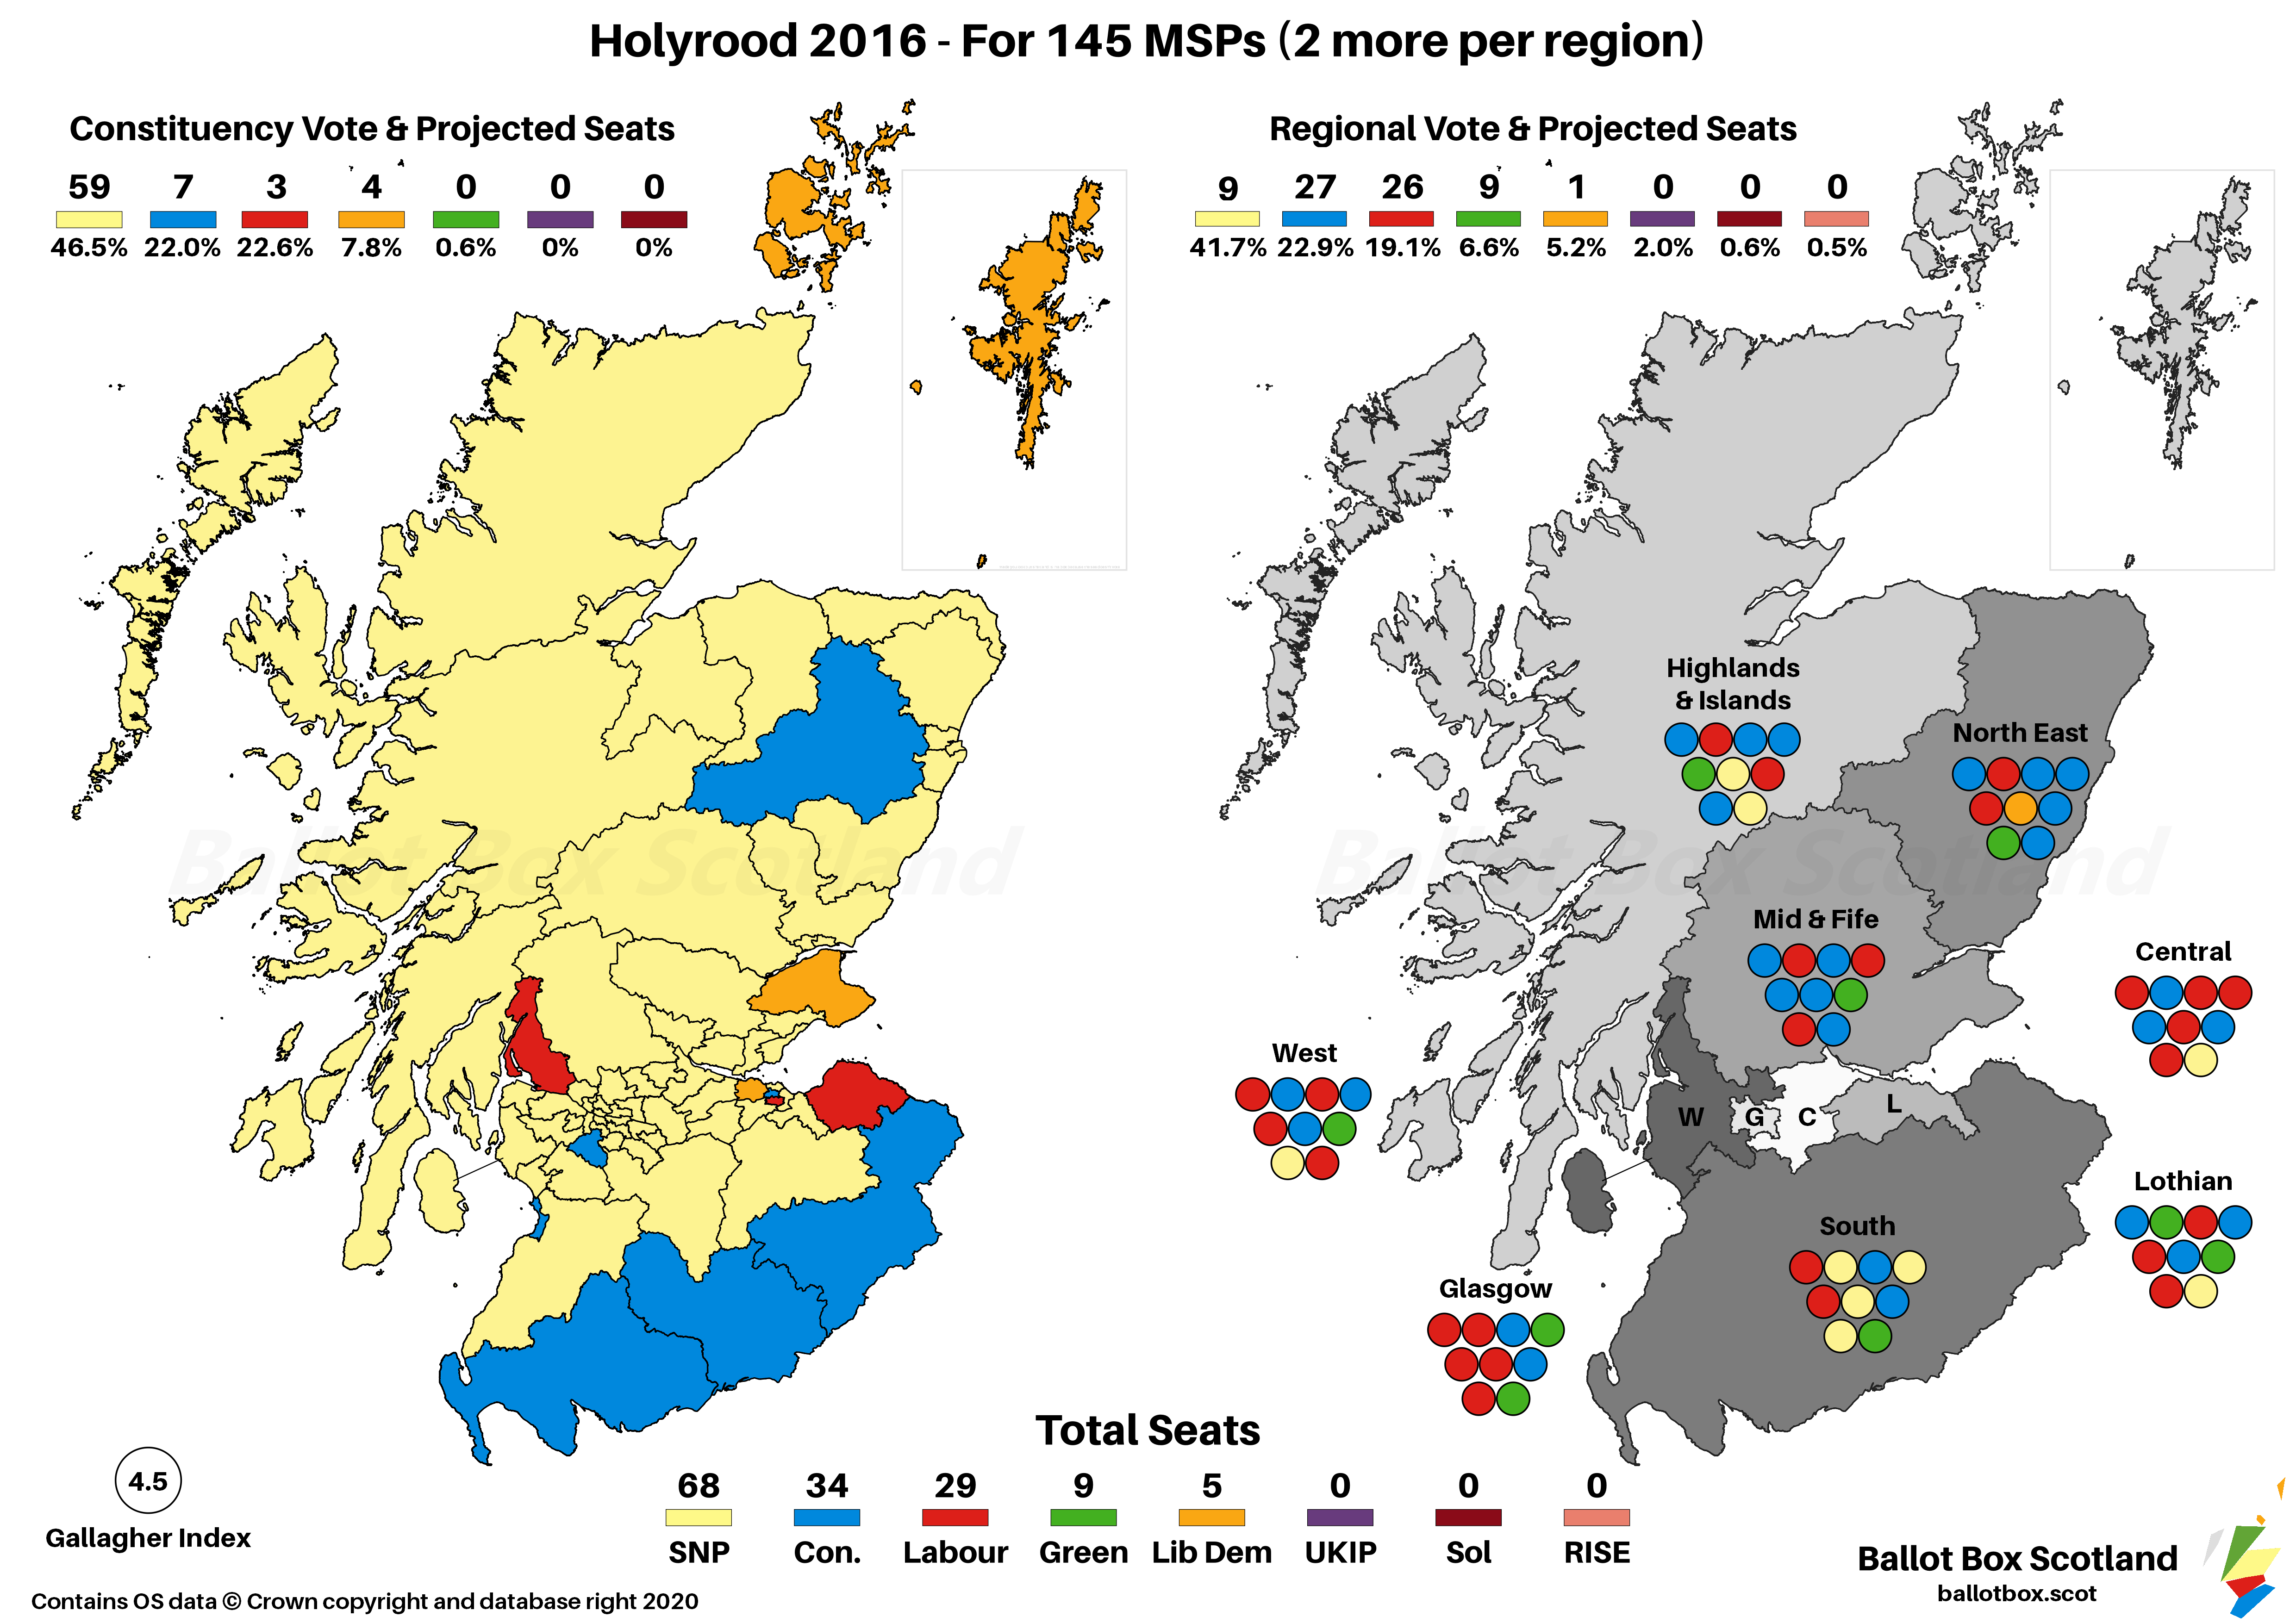
This final version is just AMS as it currently is, but with an extra 2 list seats per region. Since the Scottish Parliament was founded, it has gradually accumulated more powers. Those powers need more government ministers to exercise them, and more committees to scrutinise them. There’s an argument for expanding the number of MSPs to deal with that, as existing committees have ended up with overly broad remits and without enough MSPs to go round.
Adding some more list MSPs is the simplest way to do that, and by adding a total of 16, it almost equalises the number of FPTP constituency (73) and PR list (72) seats. The total number and percentage share of seats per party would have been;
- SNP – 68 (46.9%)
- Conservative – 34 (23.4%)
- Labour – 29 (20.0%)
- Green – 9 (6.2%)
- Lib Dem – 5 (3.4%)
Most notable here is that the Lib Dems are the only party that wouldn’t have won any of those additional seats, being just too distant from seats in any region. By contrast the SNP manage to substantially increase their haul of list seats, going from seats in two regions to five, which speaks to how strong their vote was. As this still has constituency seats and is regional rather than national PR however, it falls in the middle of the Gallagher Index range at 4.5.