Last but not least in this week’s triple-whammy of polls is the latest entry in the partnership of Savanta ComRes (link to tables) and the Scotsman (link to original writeup). I would never play favourites here on Ballot Box Scotland, but this is by far the most consistent polling arrangement currently present in Scotland, coming relatively frequently and – unlike some other pairings – actually publishing full datasets. So, obviously, they are my favourites.
The previous ComRes covered the 23rd – 28th of June 2022. Changes are shown as (vs that poll / vs last election). For comparison, since these three all came out at once, see the Survation and the YouGov analysis pieces.
Regional Vote
If you’ve read the piece about the Survation poll, you’ll be familiar with what I’m about to say here about the SNP (and Green) votes. Basically, ComRes aligns with Survation in finding low SNP list votes, that’s possibly slightly too low, but still something to give the SNP pause given the list vote generally seems more reflective of “natural” voting patterns than the constituency vote.
Labour continue to show decent growth, which has them relatively close to the SNP on this ballot. The standout in this one relative to the other two polls is that the Conservatives aren’t actually that badly impacted. Certainly, they wouldn’t be particularly happy with this result, but it’s relatively mild and wouldn’t even have been their worst share if we hadn’t had those other polls.
As touched on earlier, a high Green figure here is something of a counterweight to the SNP, and similarly may be a slight overestimation. It’s undeniable the party is generally polling the best it ever has though, a “one year into being part of government” record the Lib Dems would be envious of. Speaking of, this is another middling share relative to the spread of their recent polling, but any upwards movement will be welcomed by their current group of four.
Constituency Vote
It’s much more muted over on the Constituency ballot. This time the SNP are up very marginally on last year, and whilst 25% is solid for Labour, it’s much weaker growth than on the list vote, and certainly not enough to flip any constituencies beyond perhaps East Lothian. This is a worse share for the Conservatives, albeit still not as bad as in other polls – scant comfort though that may be to the party.
Seat Projection
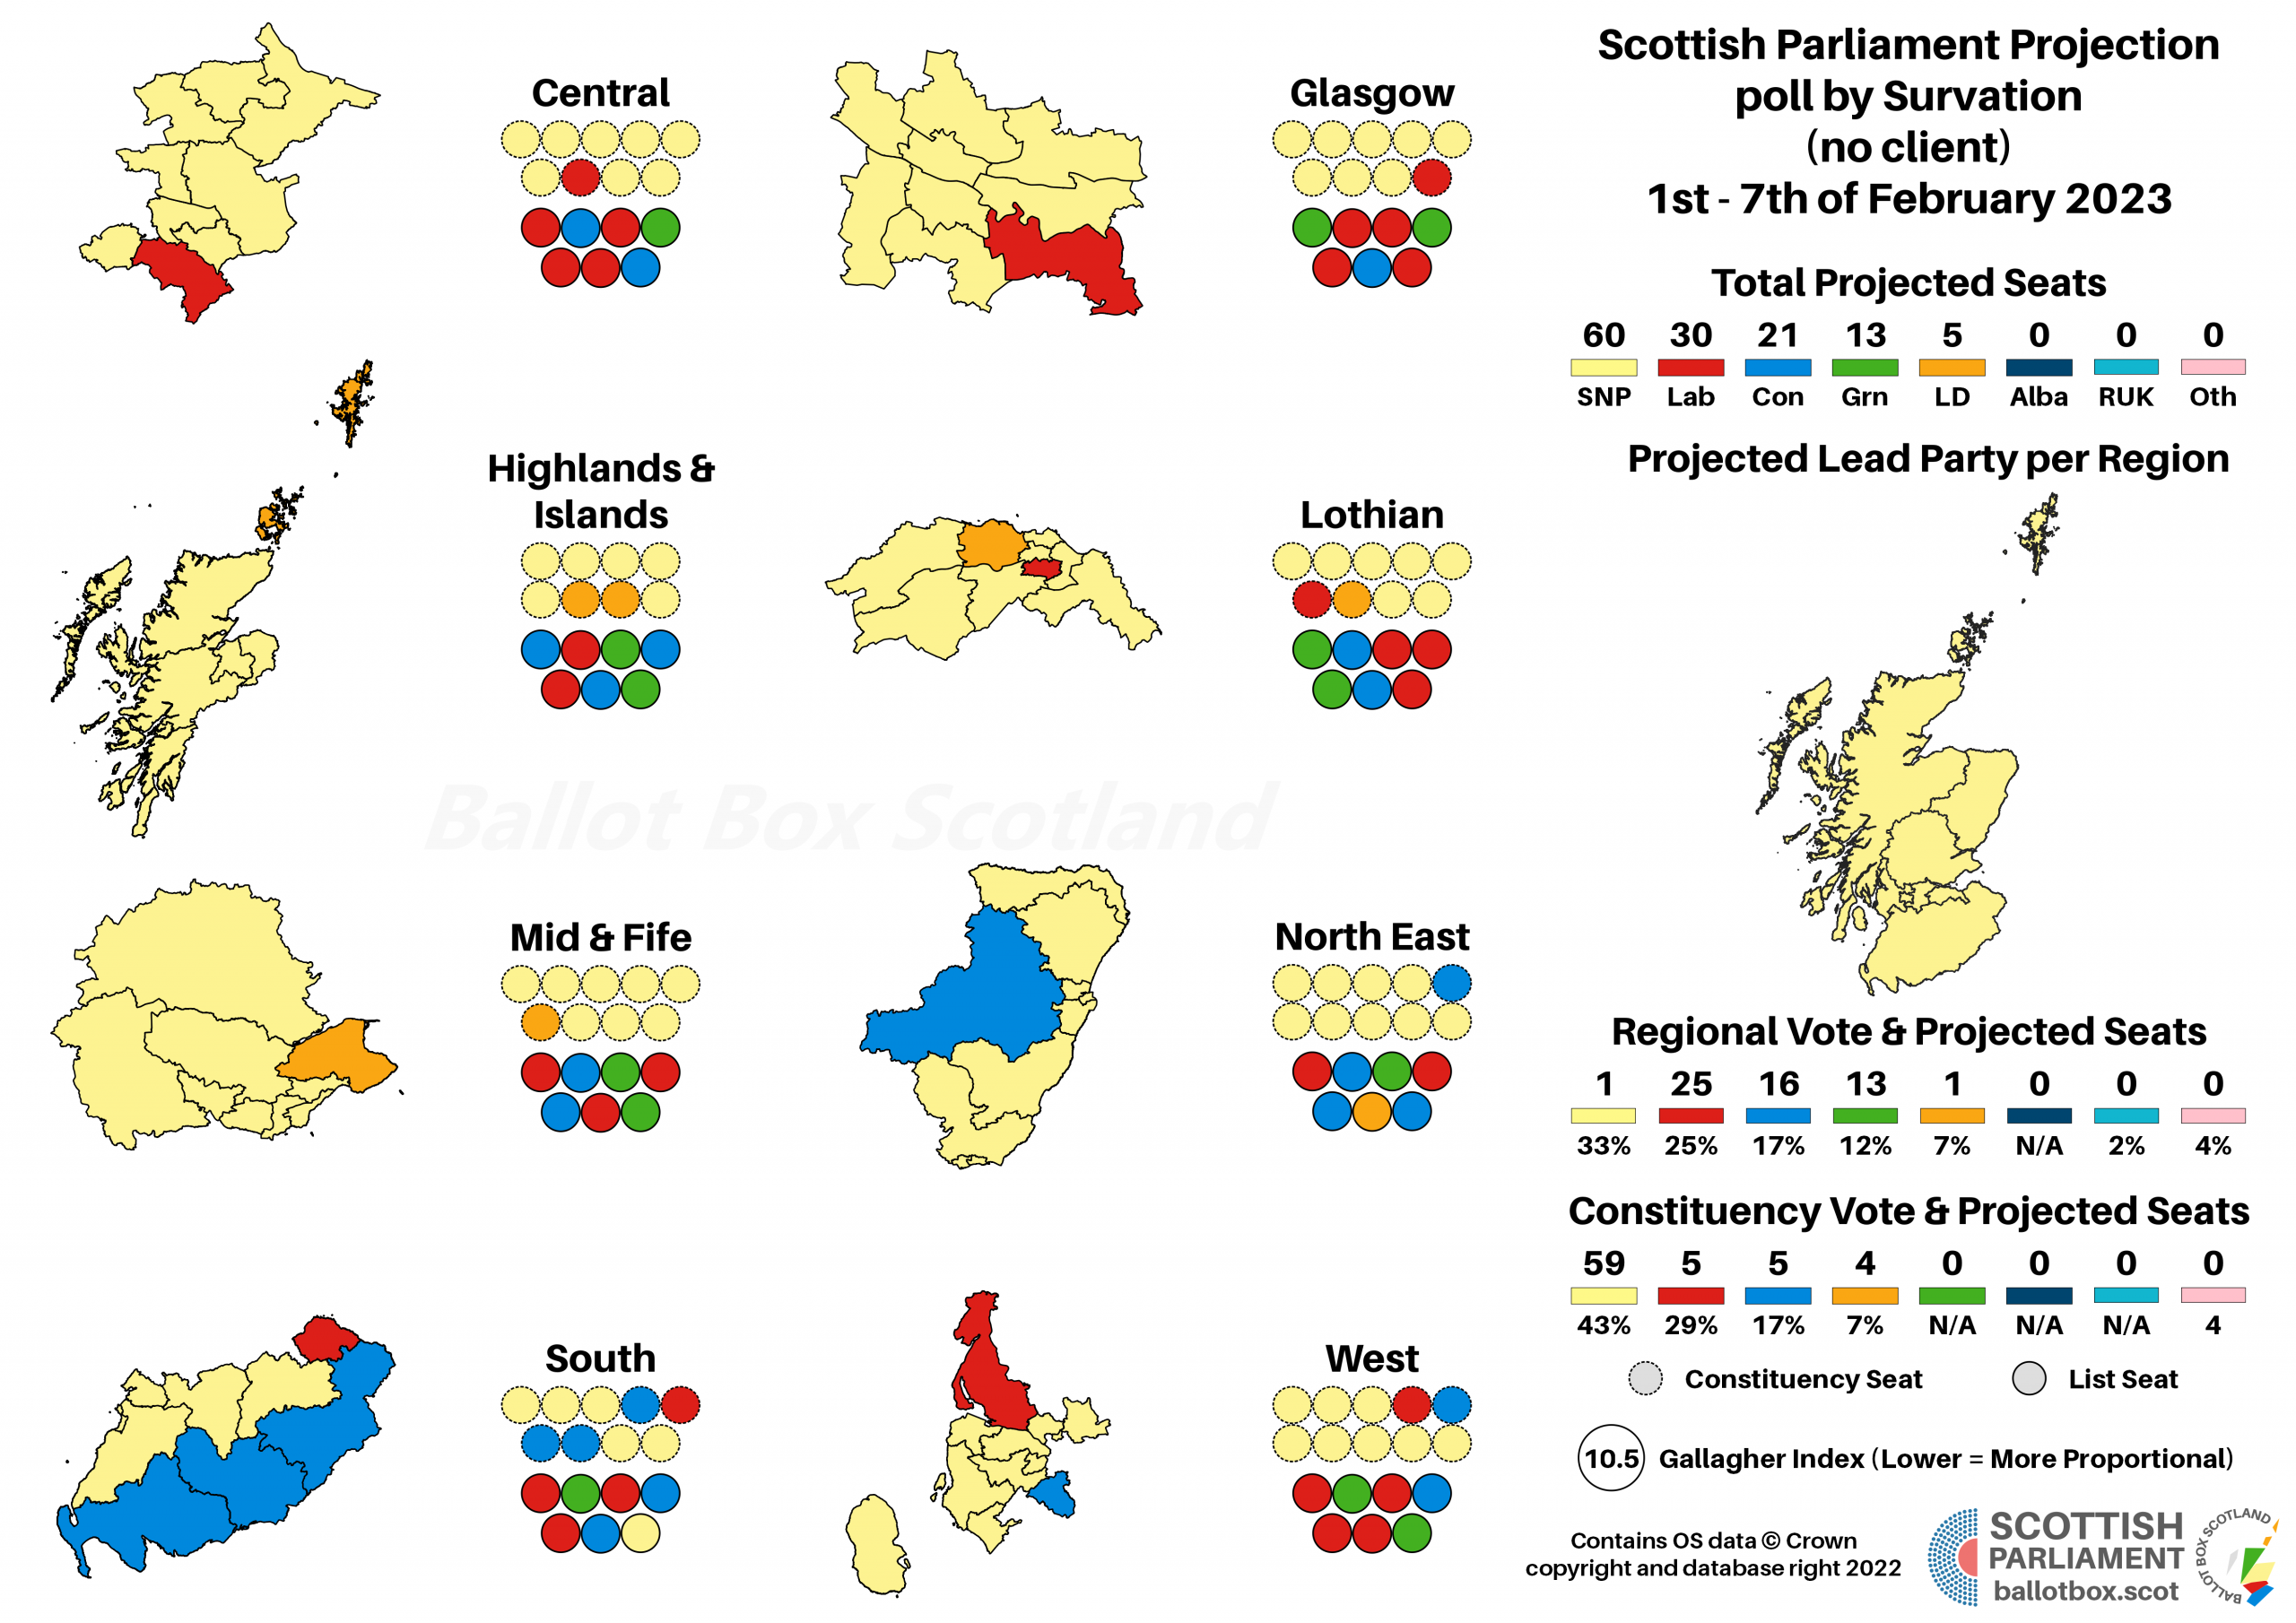
Projecting that into seats might give us something like this:
Please see this page for how projections work and important caveats.
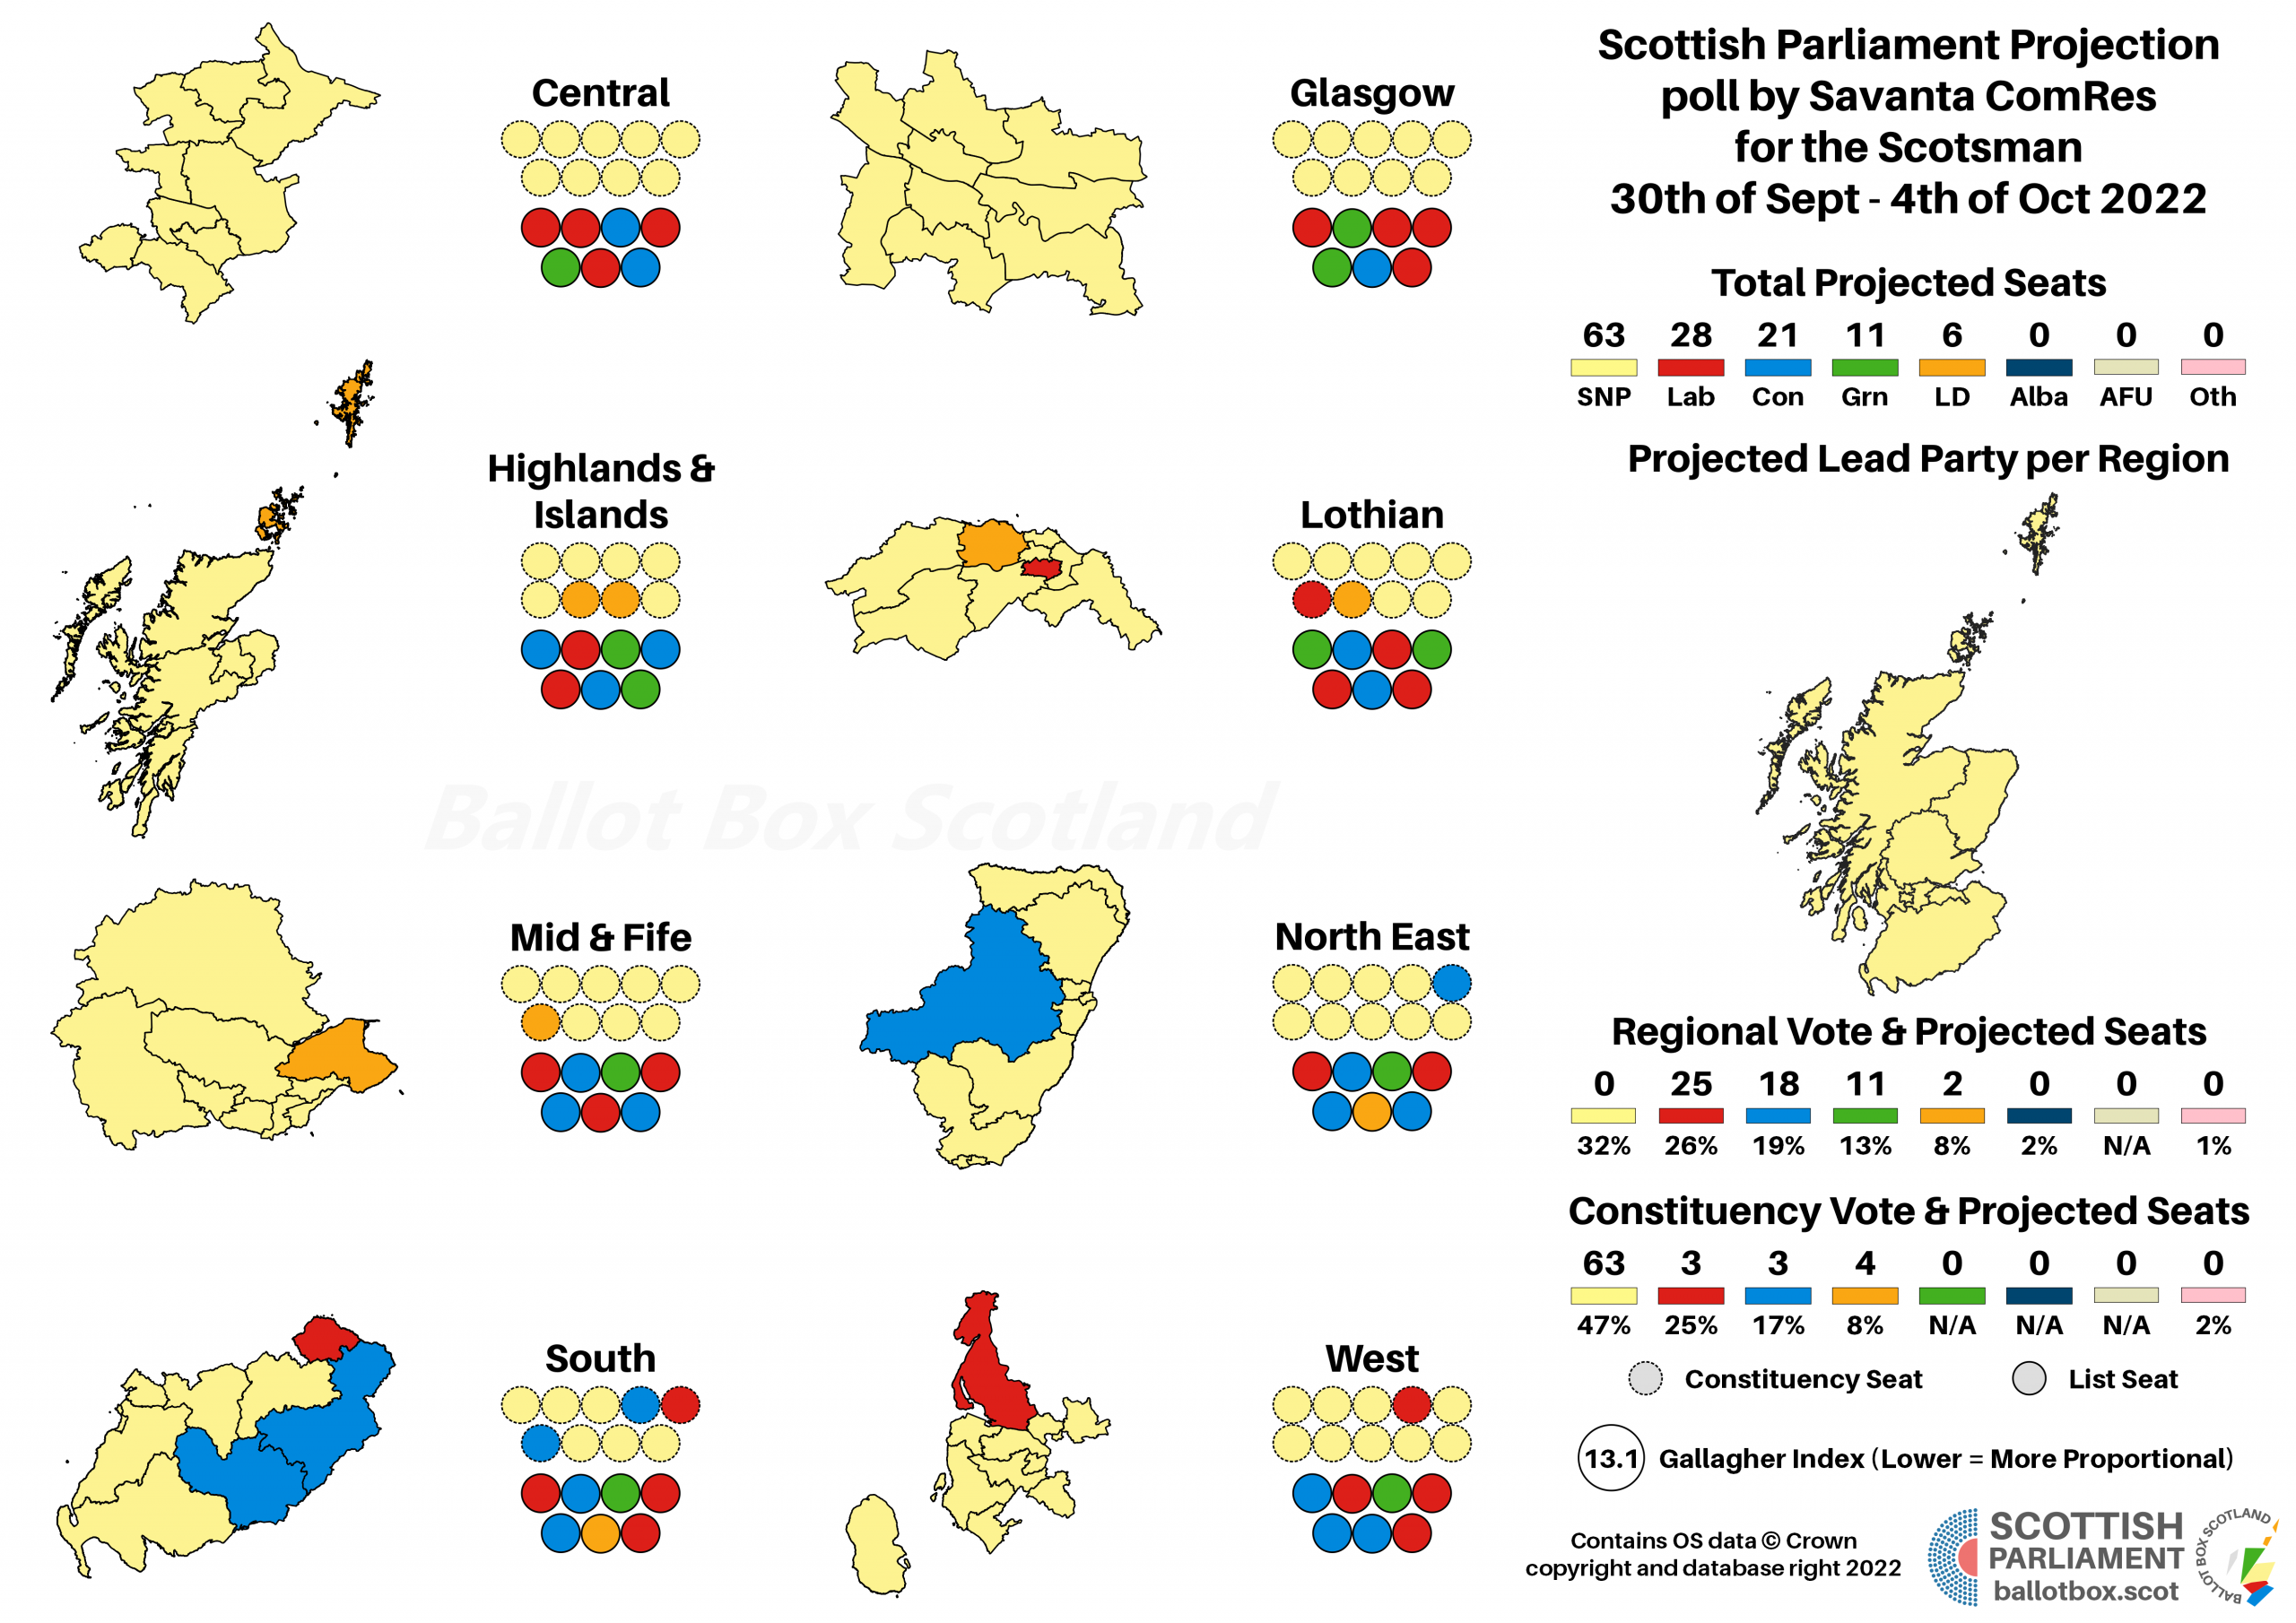

Running this through the BBS calculator, those mild Conservative vote losses spare them a bit of the pain the other polls have found, remaining within the 20’s and comfortably clear of the Greens. That’s also why the Green and Lib Dem seat share is lower than the other two polls, as there are fewer currently Conservative list seats going spare. Changes between the Pro-Union parties currently mean very little, however, with the SNP’s dominance of constituencies assuring the numbers would be there to continue in government with the Greens.
Relative to Holyrood, this is the bit of the poll where the Conservatives are really suffering, to a degree much more in line with the other two polls. If replicated at an election, this would match their 2015 vote share which was a record low.
Although Labour are also strongly up, they are contending with the highest SNP share of this little batch of polls. I wrote about it in greater length in the Survation since it was first out of the gate with an analysis piece, but basically it’ll be a struggle for them to convert into seats with the SNP polling as strongly. That’s especially true with this poll coming out at a 16% lead, rather than Survation’s 13%.
As I wrote in the YouGov piece, some had been expecting recent events (whether monarch bereavement or mini budget) would lead to big shifts on the constitutional question. That either did not happen or it did, but in both directions and cancelled out. The story remains as it has for some time now – the Union is in the lead, but that’s on a knife-edge. How dull, can’t somebody do something that gives a big swing, in one or other direction, just so I can write something different?
Timing of a Referendum (October Specific)
Interestingly enough, there are two different questions on referendum timing in the tables. The first outright asks about the October 2023 date that the Scottish Government are aiming for. That comes out pretty strongly against, with a slightly strengthened majority compared to the previous poll. The First Minister has made the point a couple of times now that countries aren’t run based on opinion polls. There’s both a truth to that and a wider democratic concern about some of the perhaps unwise chat around mandates (if you are a list MSP, for example, you probably don’t want to pretend that vote doesn’t count!), but nonetheless I imagine she’d rather prefer this was the other way around.
Timing of a Referendum (Flexible)
When offered a range of timescales however, only 20% of voters would want a referendum within the next year. The total for next year and the next two of 37% is pretty close to the October 2023 approval, but surely if you were against one “in the next year” on October 1st, you’re not going to quibble “well, late October is more than a year” – right?
It’s an interesting little difference, though it remains the case that a total of 50% of people would be content with a referendum in the next five years, versus 43% who’d prefer longer or never. It’s a reminder, if the nearly tied nature of the voting intention wasn’t enough, that the constitutional question isn’t going anywhere regardless of whether there’s a vote next year or not.
Impact of a Labour UK Government
Repeating from the previous poll, ComRes also asked about the impact of a prospective UK Labour Government on support for Independence. Such a government seemed quite likely in June, and almost inevitable now. Has that changed minds? Well, perhaps a little bit – now rather than a margin of error lead for “more likely to vote Yes”, there’s a margin of error lead for “more likely to vote No”… for the total of the less than a third of voters who think it’ll make any difference whatsoever.
I won’t repeat what I said in June, but it strikes me as a fundamental misdiagnosis of the past decade of upheaval in Scotland to view it as being entirely a reaction to Conservative UK Governments – there was plenty of reacting against Labour too. If a Labour government takes office, it’s entirely possible its actions in the longer term will shift the constitutional debate, but the mere prospect of one seems unlikely to change anything.
Even More Juicy Data
The size and scope of what is included in these Savanta ComRes/Scotsman polls is absolutely incredible – in the past, when they’ve been topical, I’ve also pulled out a question on Devo Max that continues to be asked. They also ask about whether the case for Independence has strengthened or weakened. Including these in every single analysis piece for ComRes might be a bit much, but it’s also interesting data it would be a shame to leave languishing in the tables.
I’m therefore considering adding it to the Independence Polling page as an extra section, charting these findings over time. It’ll be a bit of extra work for me to do, especially to go back and pull the data from older polls, so if you’d like to see it happen, please do consider donating a bit of money if you can afford to do so and would find that valuable!
Hypotheticals
As ever, the last little bit of analysis concerns those hypothetical and more proportional voting systems that I have a bee in my bonnet about here at BBS. The fact Westminster uses pure FPTP is an affront to democracy, and though Holyrood fares far better, AMS is still deeply imperfect. The examples here simply transpose the poll findings onto more proportional voting systems – the reality is that different systems would of course result in different voter behaviour.
For the moment, although the maps are useful for illustrative purposes, I’m opting just to show these hypotheticals as charts. It’s very time consuming making maps, and for these pure hypotheticals, it’s possibly a bit overkill.
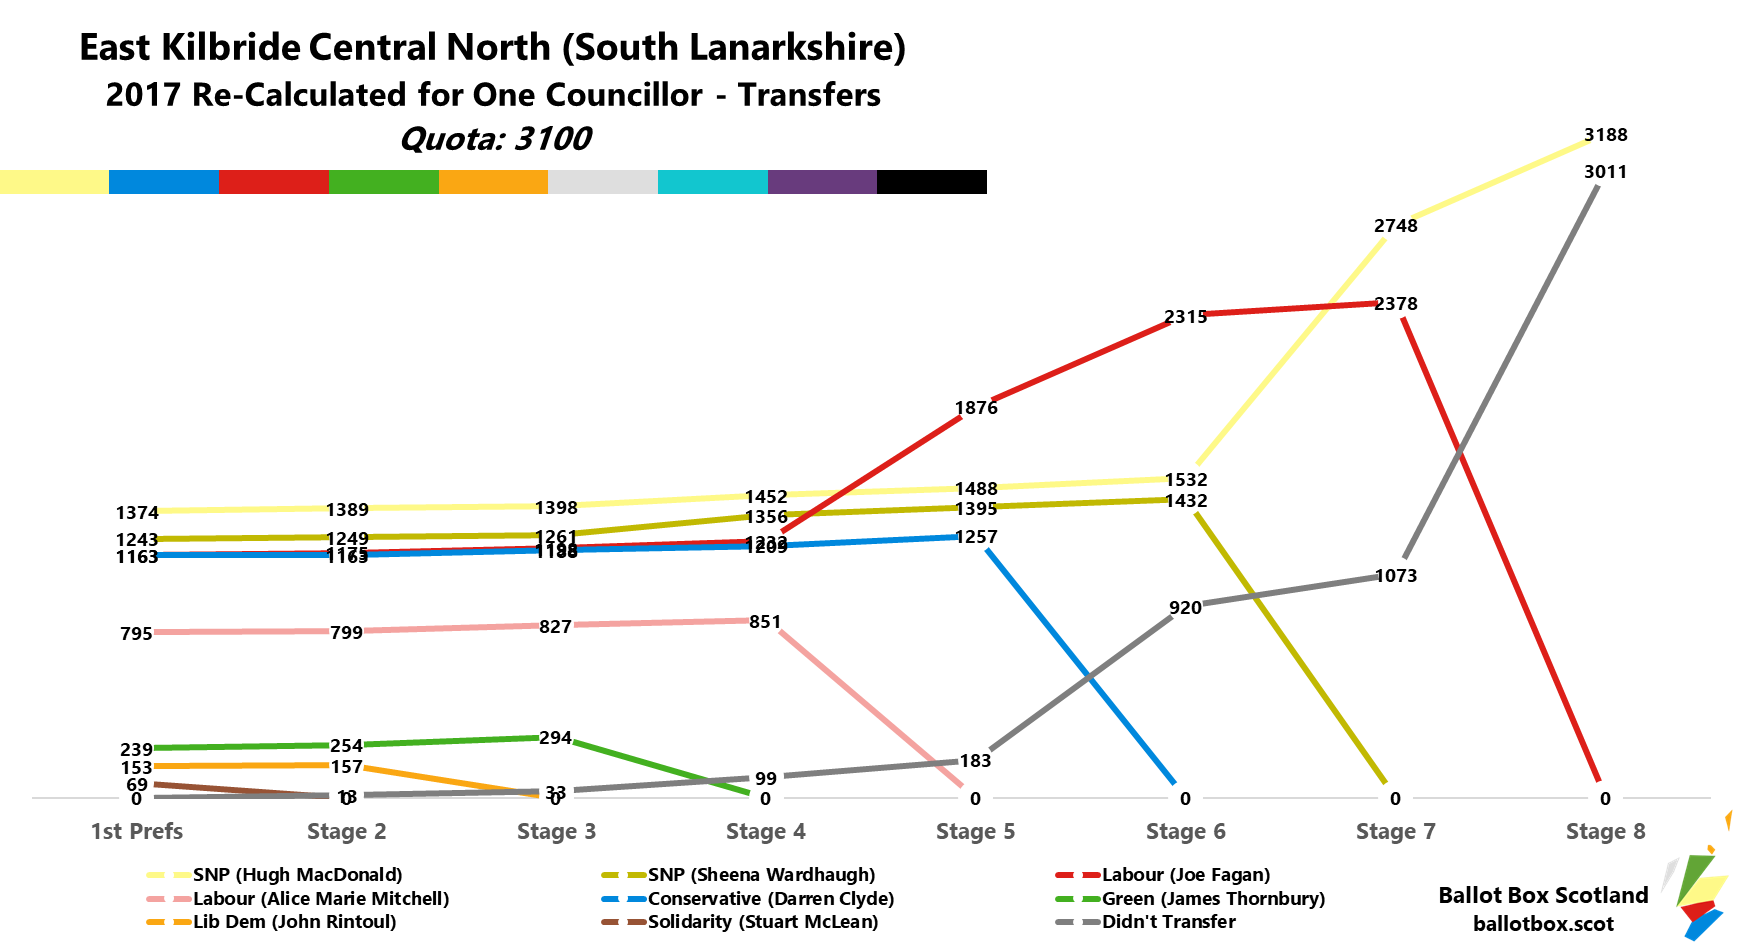
I feel a lot more like I’m repeating myself than usual, just because I’ve done three of these in quick succession, and if you’ve read them all you’ll know what the score is here. This model would be more proportional, but it’s still AMS, so the SNP’s constituency dominance really helps them, and along with the Greens gives a pro-Independence majority.
However, flip to a fully proportional voting system, and there’s a chunk Pro-Union majority of 70 to 59. Given the size of that prospective majority, you’ve got to find it somewhat perplexing that the Conservatives have their MSPs getting up in parliament to talk absolute nonsense about parties not standing in constituencies (because of a system of deposits the Conservatives support) rather than calling for FPTP to be chucked entirely. Go figure, eh?
Scandinavian Style Westminster
As ever, no FPTP projection for Westminster, but if we bring PR to that southerly parliament, it would again be far better for the two major Pro-Union parties. The SNP would still be where they were in 2019, given their vote share is, but with a minority of seats overall.
If you find this or other Ballot Box Scotland output useful and/or interesting, and you can afford to do so, please consider donating to support my work. I love doing this, but it’s a one-man project and takes a lot of time and effort. All donations, no matter how small, are greatly appreciated and extremely helpful.
(About Donations)