Two whole months plus one week into 2019 and we finally have some Scottish polling! Hurray! However, it’s another Panelbase. Not to look a gift horse in the mouth or anything, but it’s been a long time since a Survation, and longer still since a YouGov.
Display format;
- Party – Vote% (Change vs last poll by agency / Change vs last election or referendum)
Holyrood Voting Intention and Projection (Tracker)
Constituency;
- SNP – 41% (nc / -6)
- Conservative – 27% (+2 / +5)
- Labour – 19% (-4 / -4)
- Lib Dem – 8% (+2 / nc)
- Green – 3% (nc / +2)
Regional;
- SNP – 36% (-2 / -6)
- Conservative – 27% (+1 / +4)
- Labour – 19% (-3 / nc)
- Lib Dem – 9% (+2 / +4)
- Green – 6% (nc / -1)
- UKIP – 3% (+2 / +1)
Compared to the last Panelbase, the big story is that substantial Labour dip, taking them below 20% on both ballots for the first time since the snap GE in 2017. Whilst that may be concerning for Leonard’s lot, it’s notable that between Holyrood 2016 and the snap GE they had been slumped even further, consistently registering in the mid to low teens. The SNP are also down a smidge, though this still shows that much higher list vote Panelbase tends to find compared to other pollsters.
There’s also a notable turnaround for the Lib Dems. Panelbase have typically found them to be polling lower than the other agencies, so to be on 9% of the list vote here is impressive, given their recent history. Notably, despite all the excitement, there are no figures for the Independent Group in this poll, they weren’t prompted for here. Given their Westminster figure though they may not have missed out on much there.
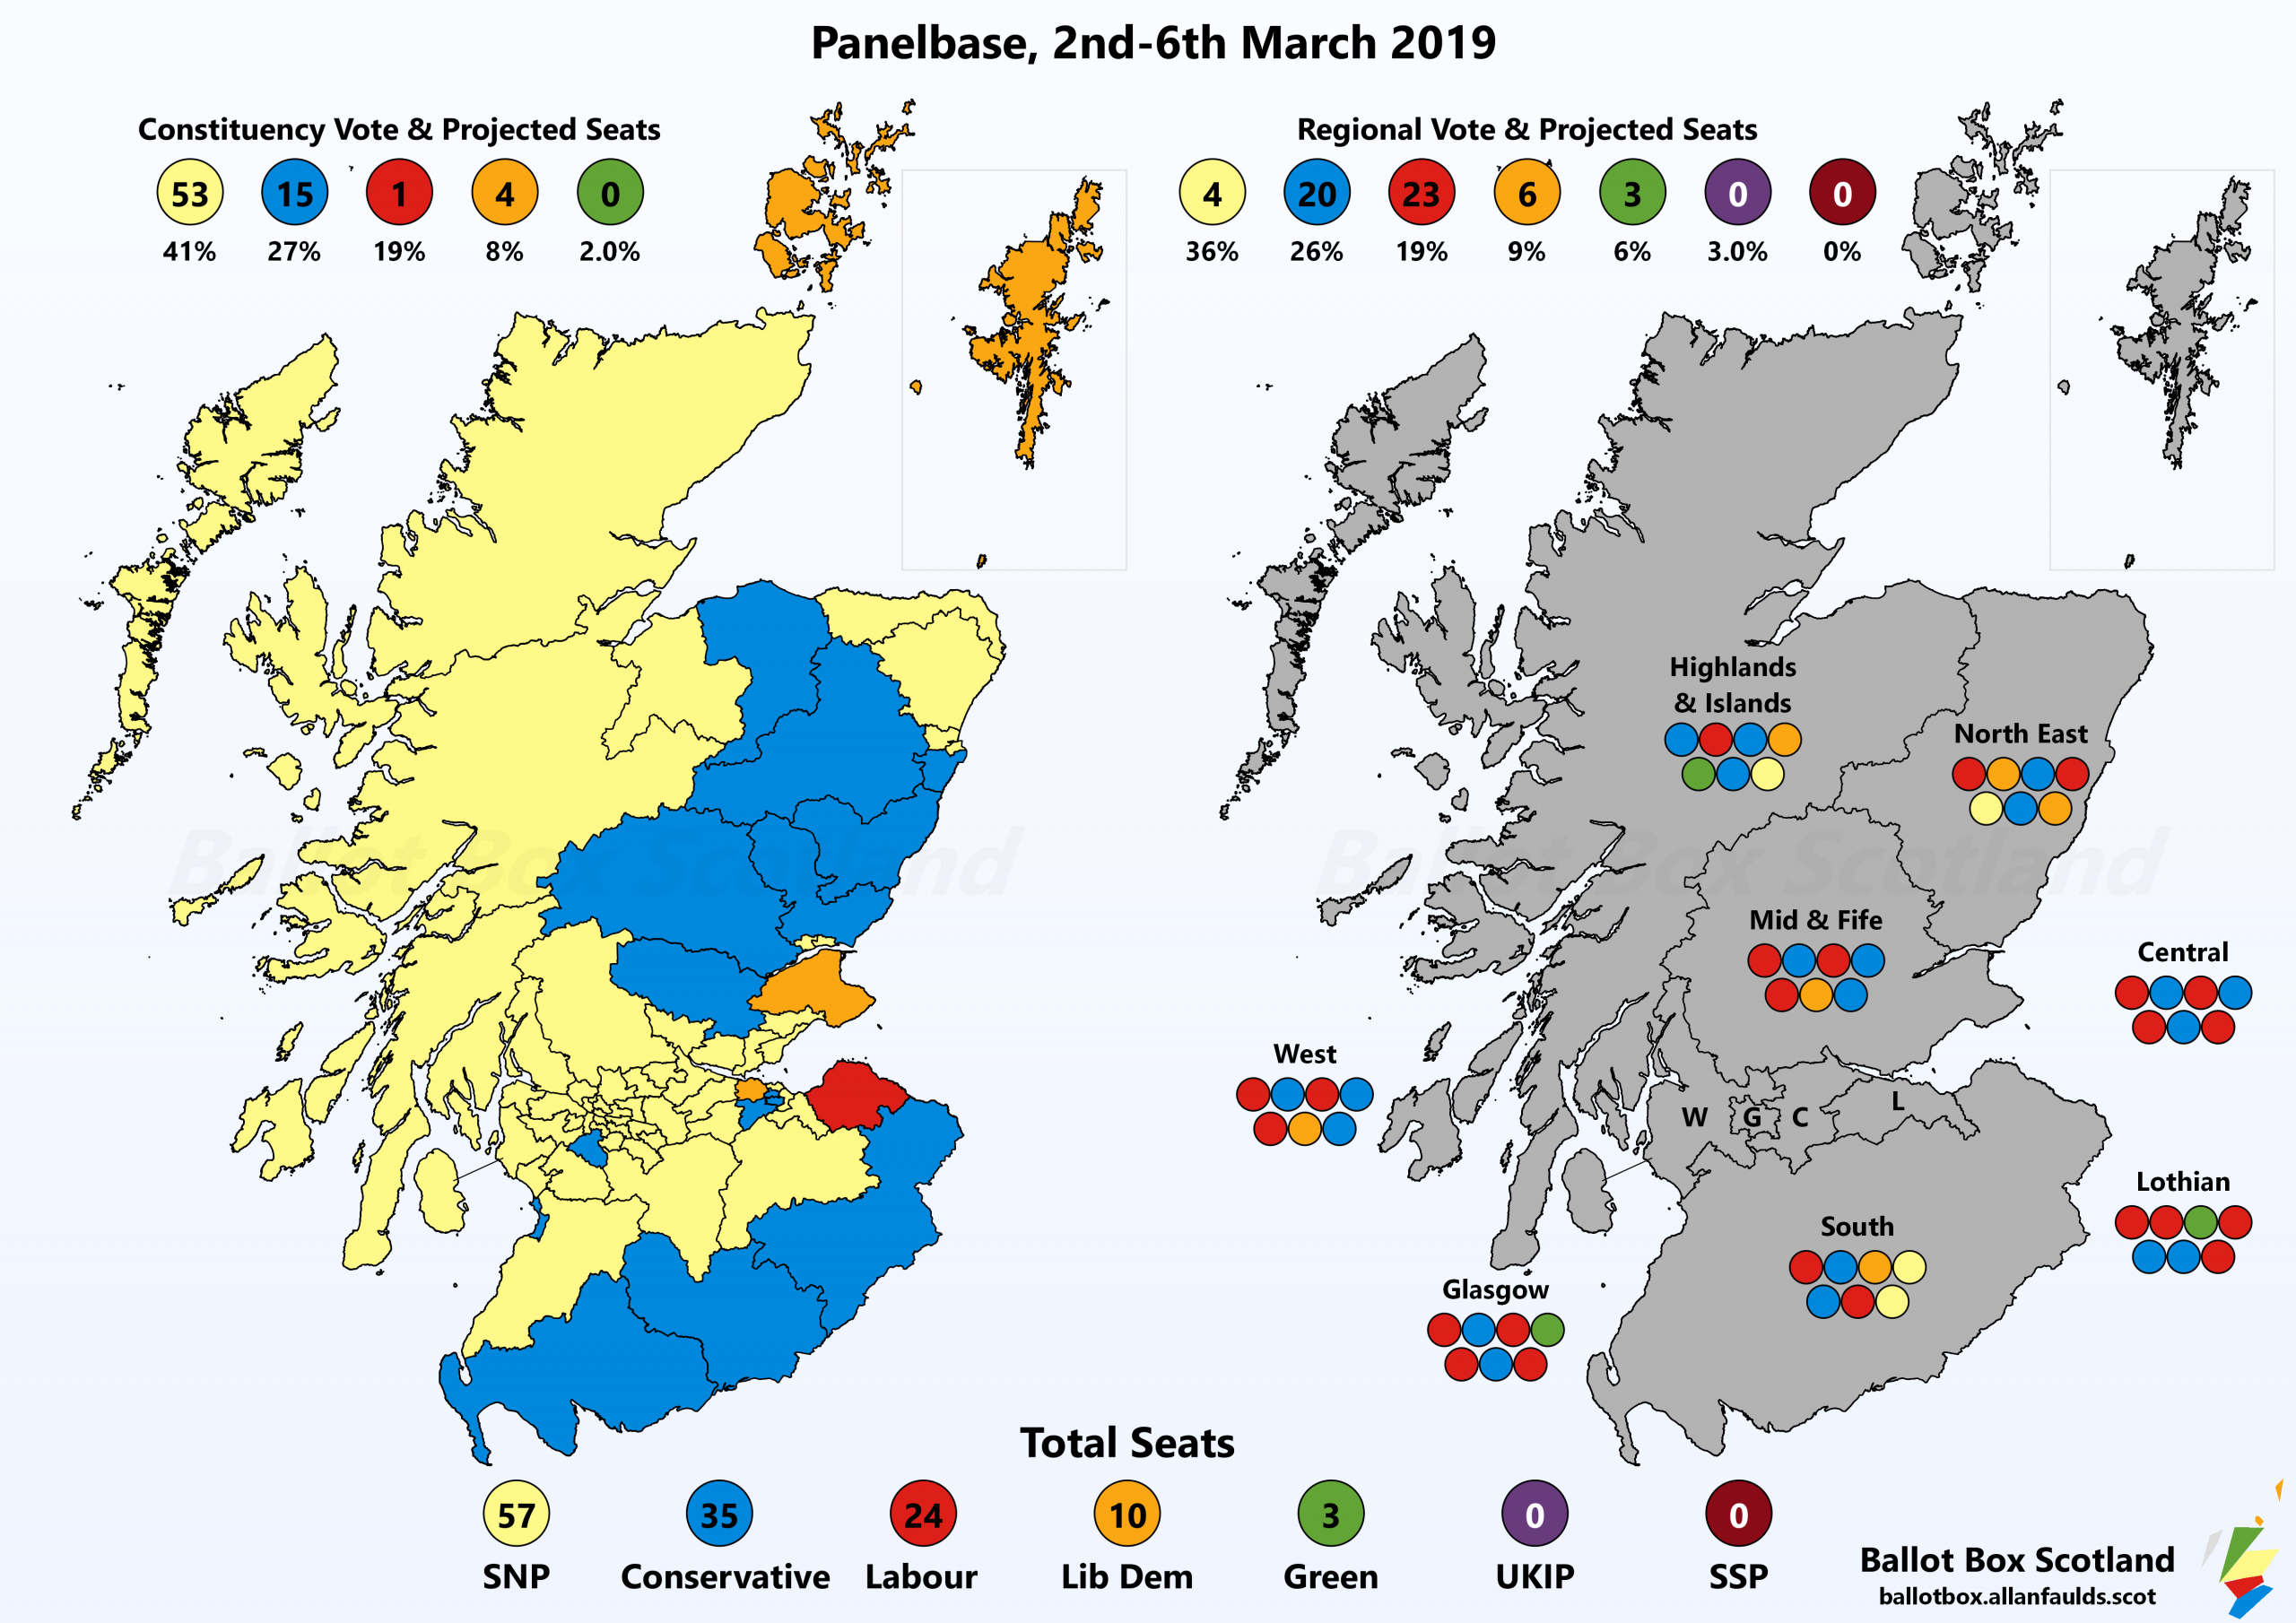
If we project that into seats it might look like;
- SNP – 57 (-1 / -6)
- Conservative – 35 (+1 / +4)
- Labour – 24 (-2 / nc)
- Lib Dem – 10 (+3 / +5)
- Green – 3 (-1 / -3)
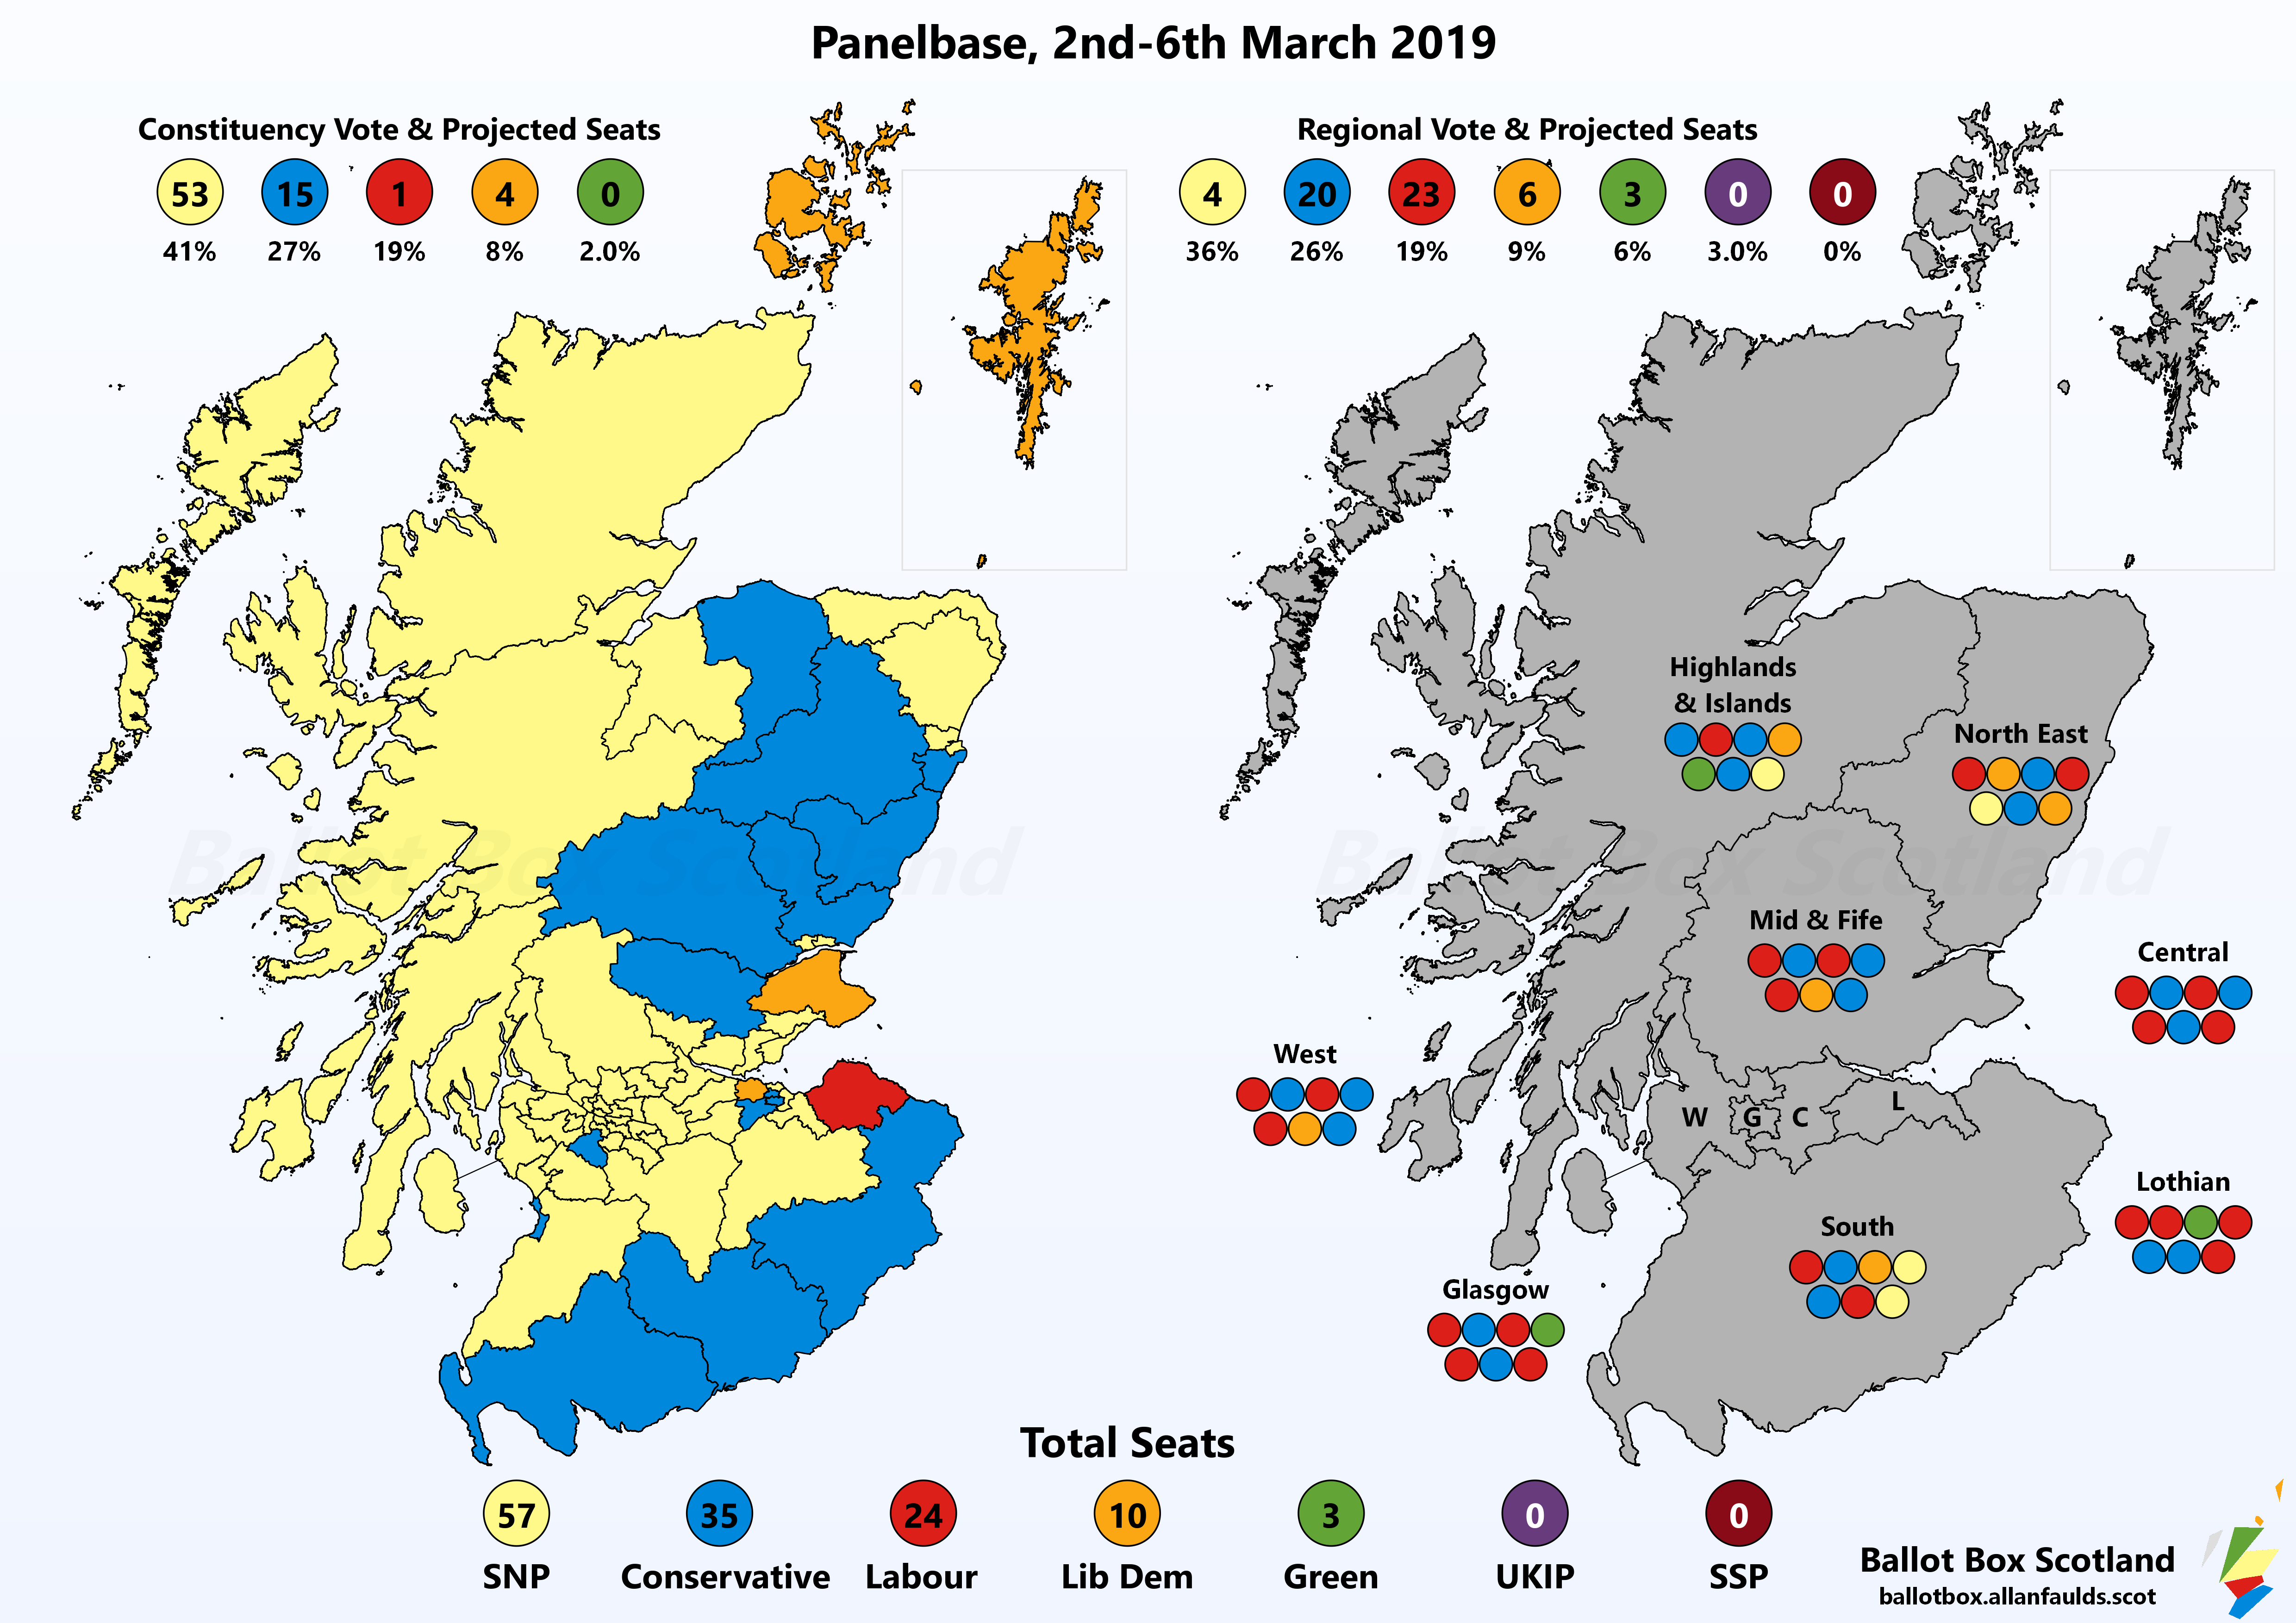
Despite that slump for Labour in the constituency vote, the fact their list vote is unchanged on 2016 could mean they end up with the same number of seats overall. Notably however, this is the first time since launching BBS that Labour have been projected to lose constituency seats, being left only with East Lothian. The usual caveats about projecting national vote shares into single seats apply, but that’s still remarkable.
The Conservatives come out with their largest haul of projected seats since the election, whilst it’s grim for the Greens who would lose half of their seats by losing one-eleventh of their votes. The Lib Dems meanwhile would be riding high – though still locked out of Glasgow and Central regions.
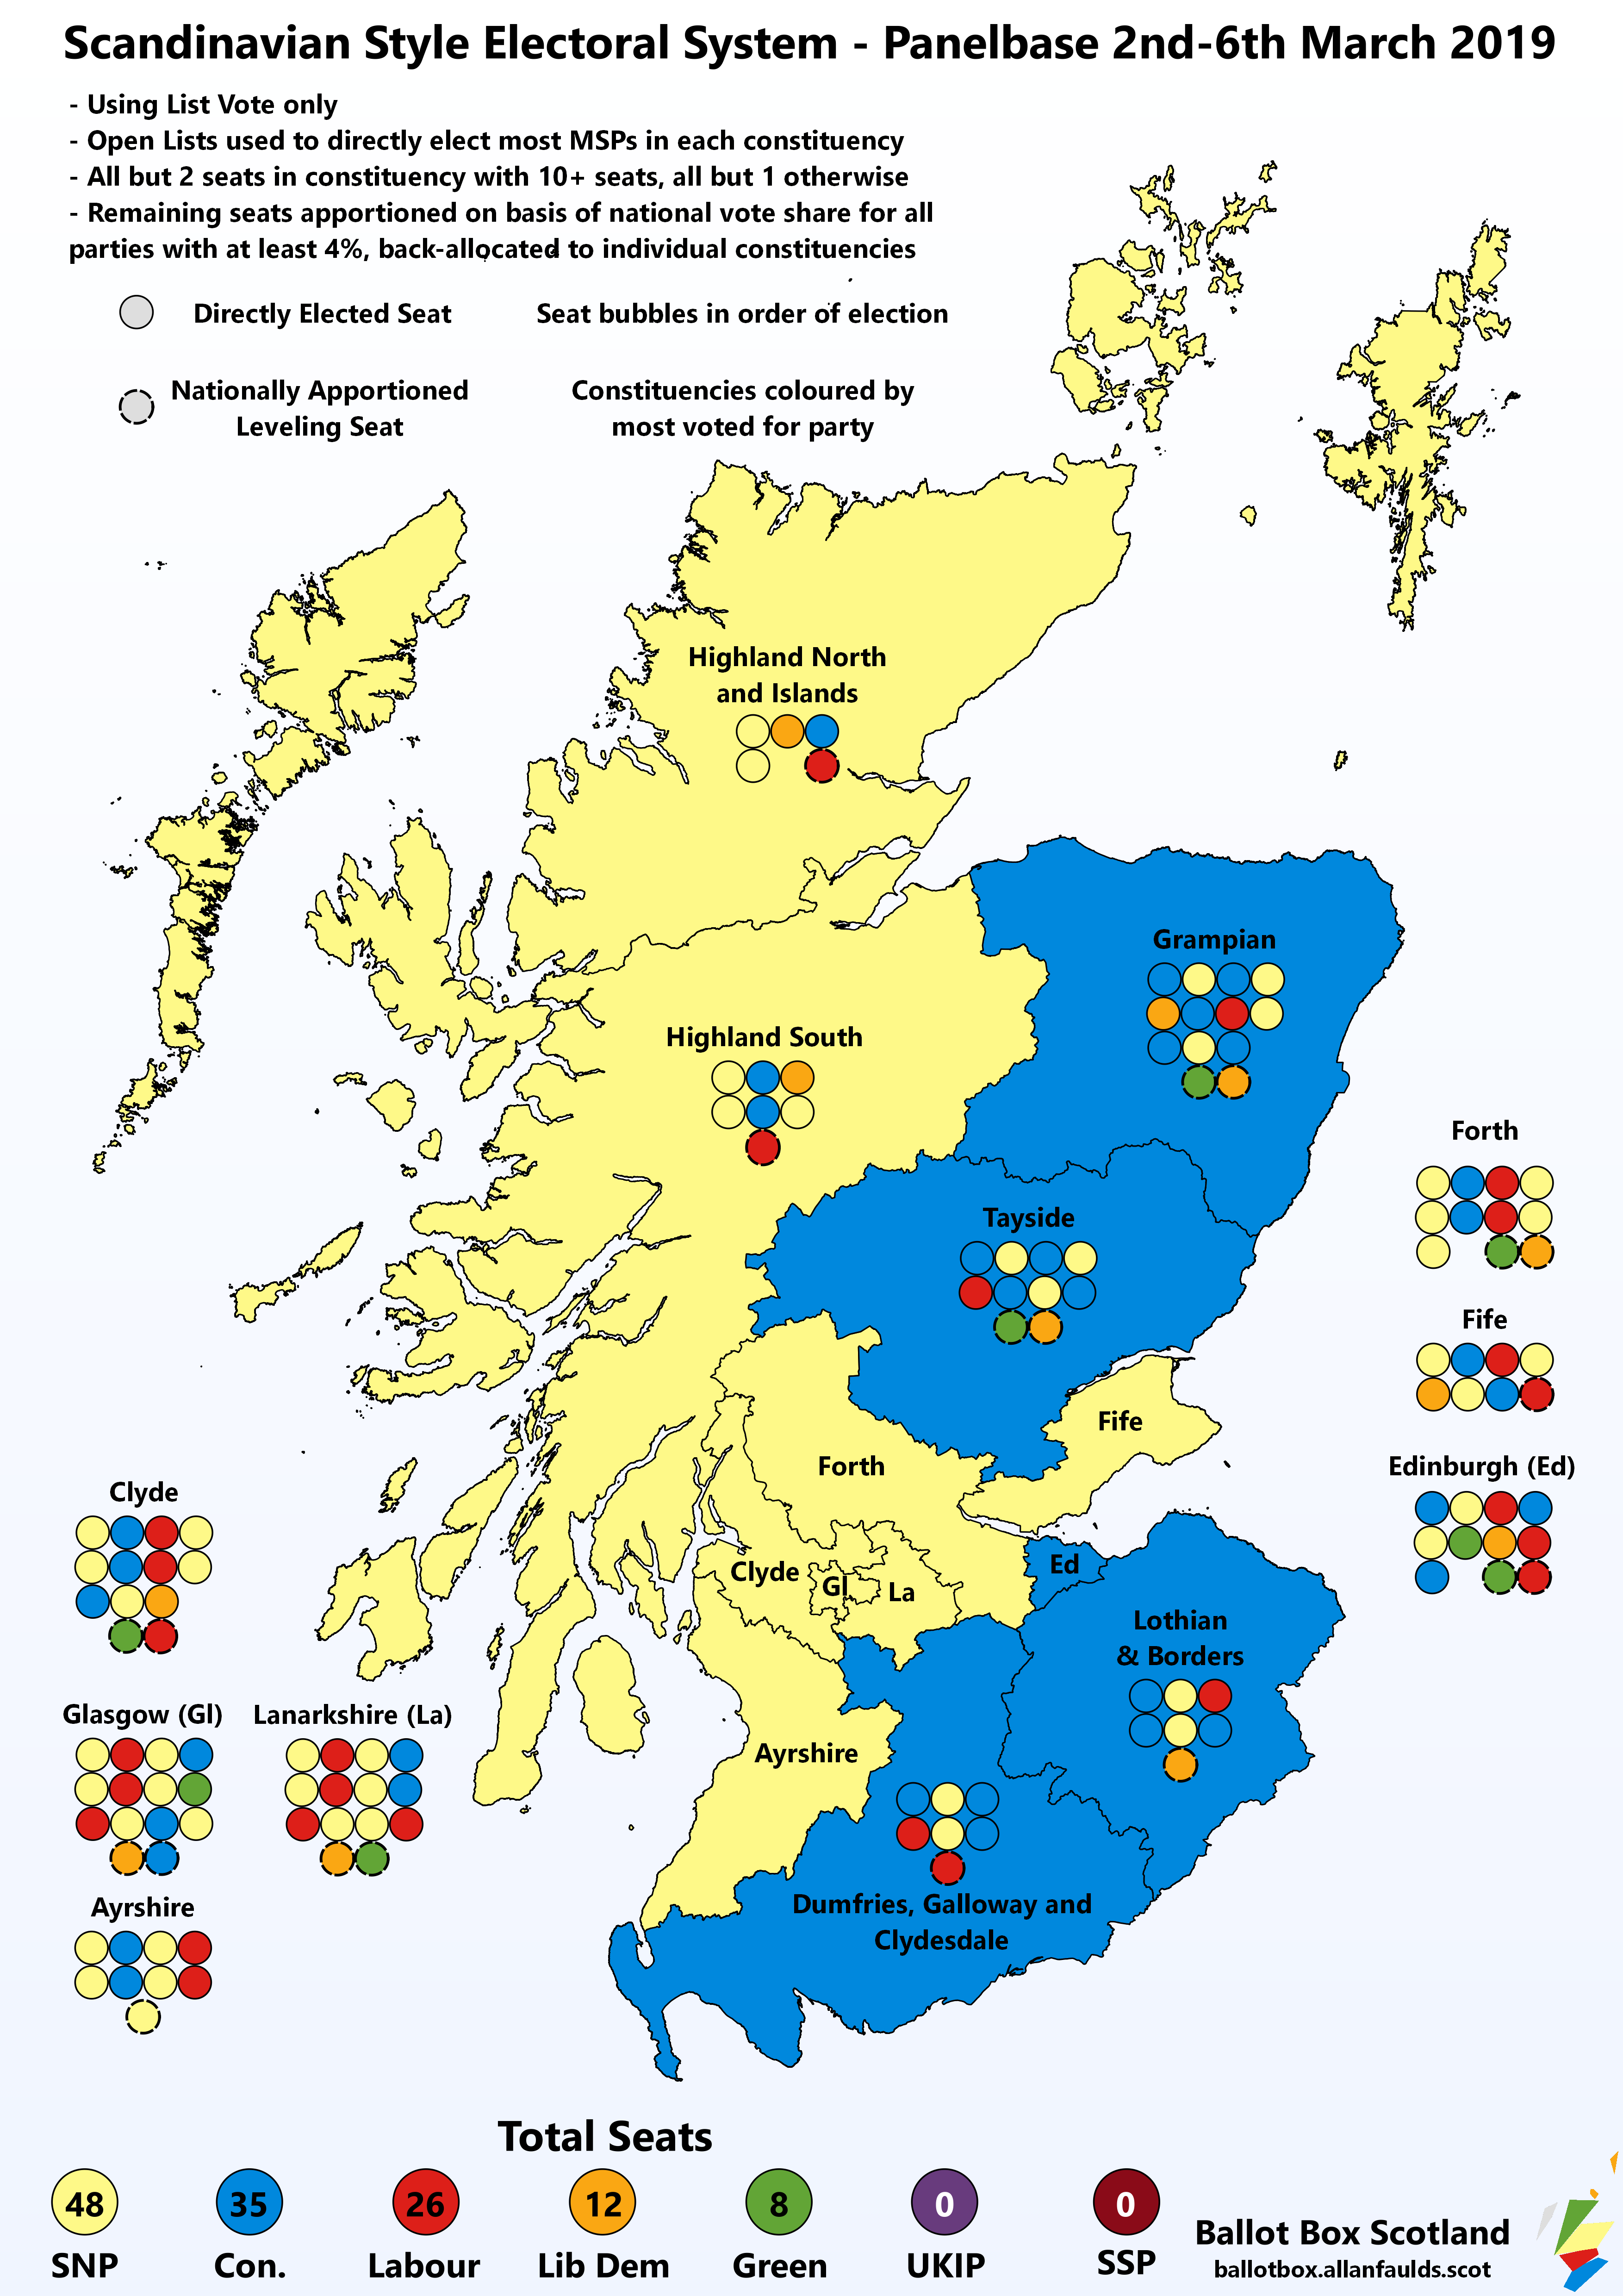
New for this post is something I’ve been meaning to update and brand for Ballot Box Scotland for a while – what if Scotland used a more proportional voting system? As noted above, AMS isn’t brilliantly proportional, with the Greens here estimated to have their seats slashed in half for only a very small drop in vote share. That’s largely down to the regional rather than national nature of proportionality under our electoral system, though the existence of FPTP seats can also contribute to that distortion via overhang.
Using just the list vote (though with the caveat that a list vote in a one ballot situation would undoubtedly be different than it is in a two ballot) and applying it to Scottish adaptation of systems used in the Scandinavian countries may give the following (vs AMS projection);
- SNP – 48 (-9)
- Conservative – 35 (nc)
- Labour – 26 (+2)
- Lib Dem – 12 (+2)
- Green – 8 (+5)
Westminster Voting Intention (Tracker)
- SNP – 37% (nc / nc)
- Conservative – 27% (+1/ -2)
- Labour – 22% (-4 / -5)
- Lib Dem – 7% (+1 / nc)
- Green – 2% (nc / +2)
- UKIP – 2% (nc / +2)
- TIG – 2% (+2 / n/a)
At Westminster, the TIGers put in their first appearance – but only 2%. That’s substantially lower than they’ve been polling across the UK as a whole. Labour meanwhile have fallen pretty hard here as well, though remain slightly better off than at Holyrood as they are still in the 20’s. That’d likely be enough to knock them right back down to one MP.
Constitutional
Packaging Independence and Brexit into one section here, since the questions overlap. Voting intention for a pure in-out EU Referendum;
- Remain – 64% (+3)
- Leave – 33% (-3)
- Don’t Know – 3% (nc)
Excluding Don’t Knows;
- Remain – 66% (+3)
- Leave – 34% (-3)
Although there was (seemingly) no “pure” Independence question, a couple of Brexit consequential questions were asked. Between Independence and No Deal;
- Independence – 52%
- No Deal – 48%
Between Independence and May’s Rejected Deal;
- Independence – 53%
- May’s Rejected Deal – 47%
It’s always worth taking “if X happens, then will you Y or Z?” questions with an entire drum of salt, being a further hypothetical step removed from basic voting intention polling. Past experience of Scots saying in polls they’d lean Yes if the UK voted to Leave the EU have so far not led to that being the case in polling. Nonetheless, these figures are somewhat interesting, though they lack a true “soft Brexit vs Independence” option for full context – not that a soft Brexit is looking likely at the moment.