With the General Election campaign well and truly underway, and the first postal votes already cast, we’re getting a fair bit of polling. It’s enough that there are currently a whopping 7 different pollsters in the Westminster average over on the GE24 Hub page. Yet a few of the most recent have been partial polls, from my perspective, only featuring Westminster figures, or maybe Independence if you’re lucky. I only write up these full analysis pieces for polls with a Holyrood component though, which after a couple of weeks absence we got from Norstat (link to tables) for the Sunday Times (link to original writeup).
(Did my original draft of this forget to put Westminster first and include an “only because the election is looming” seat projection? No, surely not, nobody saw that…)
The previous Norstat covered the 30th of April – 3rd of May 2024. Changes are shown as (vs that poll / vs last election).
Votes
Okay, so here’s the theme that’s going to run through all of this analysis: all changes are within margin of error, and in fact are mostly just single digits. That means absolutely nothing in strict statistical terms, effectively representing no change whatsoever compared to the last poll. With that caveat in mind, the parties going up this time are the SNP, Lib Dems and Reform UK. The Conservatives and Alba are down. Labour and the Greens are steady. Given this, I think what’s interesting here is to think about what this tells us about polling in general, rather than get too fixated on the specific figures.
If you look at the average on the GE24 Hub page, you’ll see Labour’s line on the chart is now looking pretty flat. So too is the SNP’s, though it had a little bit of a bounce more recently just due to newer polls entering the average that have balanced out what was the remarkably low YouGov figure. There’s still a few weeks left of the campaign and we could yet see more changes, but at the moment it seems like Labour have plateaued and the SNP have stopped sliding.
To be clear, that’s settling onto a space where Labour are clearly ahead of the SNP, and polling is not an exact science. As I explained in this piece, even a relatively small lead for Labour nationally amounts to a big lead in the Central Belt, and the ability to completely sweep the SNP out of most seats. Nonetheless, it may be the both parties are approaching their natural ceiling and floor figures, so whilst the results on the day still look likely to be dramatic, polling isn’t showing the gap widening.
This may be a problem for the Conservatives, as whilst they too appear to be bottoming out, further SNP decline could have helped them win a few more seats. Especially with Douglas Ross having blown his own leadership to smithereens mid-campaign, and Reform UK polling well and present in every constituency, they might be a bit more vulnerable now than they were when the Prime Minister sprung the election.
Seats
As outlined in a (now very, very, yeesh, look at the lack of quality) old post, I’ve generally avoided providing Westminster projections here on BBS. First Past the Post is really difficult to get right, and even small errors can give huge differences in seats. At Holyrood, that’s moderated by a proportional element that means you can’t be that far off, but pure FPTP at Westminster is a different beast. In addition, plenty of others do those projections much better than I ever could, so why bother?
That said, I have pulled together a simple projection model for this campaign. Unlike Holyrood, I won’t be providing seat-by-seat projections, and I’ll provide the Electoral Calculus estimate on the votes too for comparison, but this just helps provide a little bit more context to the vote figures.
A notable difference is emerging in successive polls between the BBS and Electoral Calculus models. Mine clearly viewing the current Conservative seats as more secure, whereas EC think they are quite vulnerable.
Regional Vote
Hello again, margin of error. Who is affected here? The parties going up are the SNP, Reform UK and Alba, whilst Labour, and the Conservatives are down. The Greens and Lib Dems are totally static. As a result, the SNP are the ones coming out of the statistical tie with a slight edge over Labour.
As with the last poll, one thing I’m really dubious about here is the fact the combined Conservative and Reform UK figure is near enough what the Conservatives managed in 2021. Especially when you consider that not all Reform UK votes will be coming from the Conservatives (though most will), and some of the Labour growth will be at Conservative expense, I really struggle to see this being the case in reality.
As I always point out for Norstat, much to their unhappiness I know, they are the only pollster finding this much support for Alba. Nobody else has had them above 3% this term. Whilst this is a record figure for them this side of 2021, it needs to be understood in that context, and the context that Panelbase (as Norstat used to be) were the pollster that most overestimated them in 2021.
Reform UK are similarly on a record figure here, which isn’t necessarily a surprise given all the attention they are getting. Again though, I have a standard note of caution for this party: they’ve been here before. Ahead of 2016, their predecessor party UKIP had a run of polls suggesting they’d get into Holyrood. They got 2% and nowhere close. Likewise, under their previous title of the Brexit Party, at the peak of their relevance in summer 2019 they were projected to elect MSPs.
2026 is a good while off, but my gut instinct is we’re just seeing the same thing: a spike in support and interest due to events at other levels of election, that won’t be sustained all the way to 2026. Reform UK continue to be an organisationally very weak outfit in Scotland, not having stood a single candidate in the 2022 local elections, and whilst they managed a full slate of candidates for the general election, they had to draft 8 of the 57 in from England.
Constituency Vote
All margin of error changes on the constituency vote too. Here, Labour and the Lib Dems are down, whilst the Lib Dems and Greens are up, and the SNP unchanged on a still quite narrow lead over Labour. That’s definitely on the higher end for Green constituency polling, but adds to the point I keep making (based on the evidence of 2021) that we can reasonably expect them not to be too far off their List share.
Seat Projection
Projecting that into seats might give us something like this:
Please see this page for how projections work and important caveats.
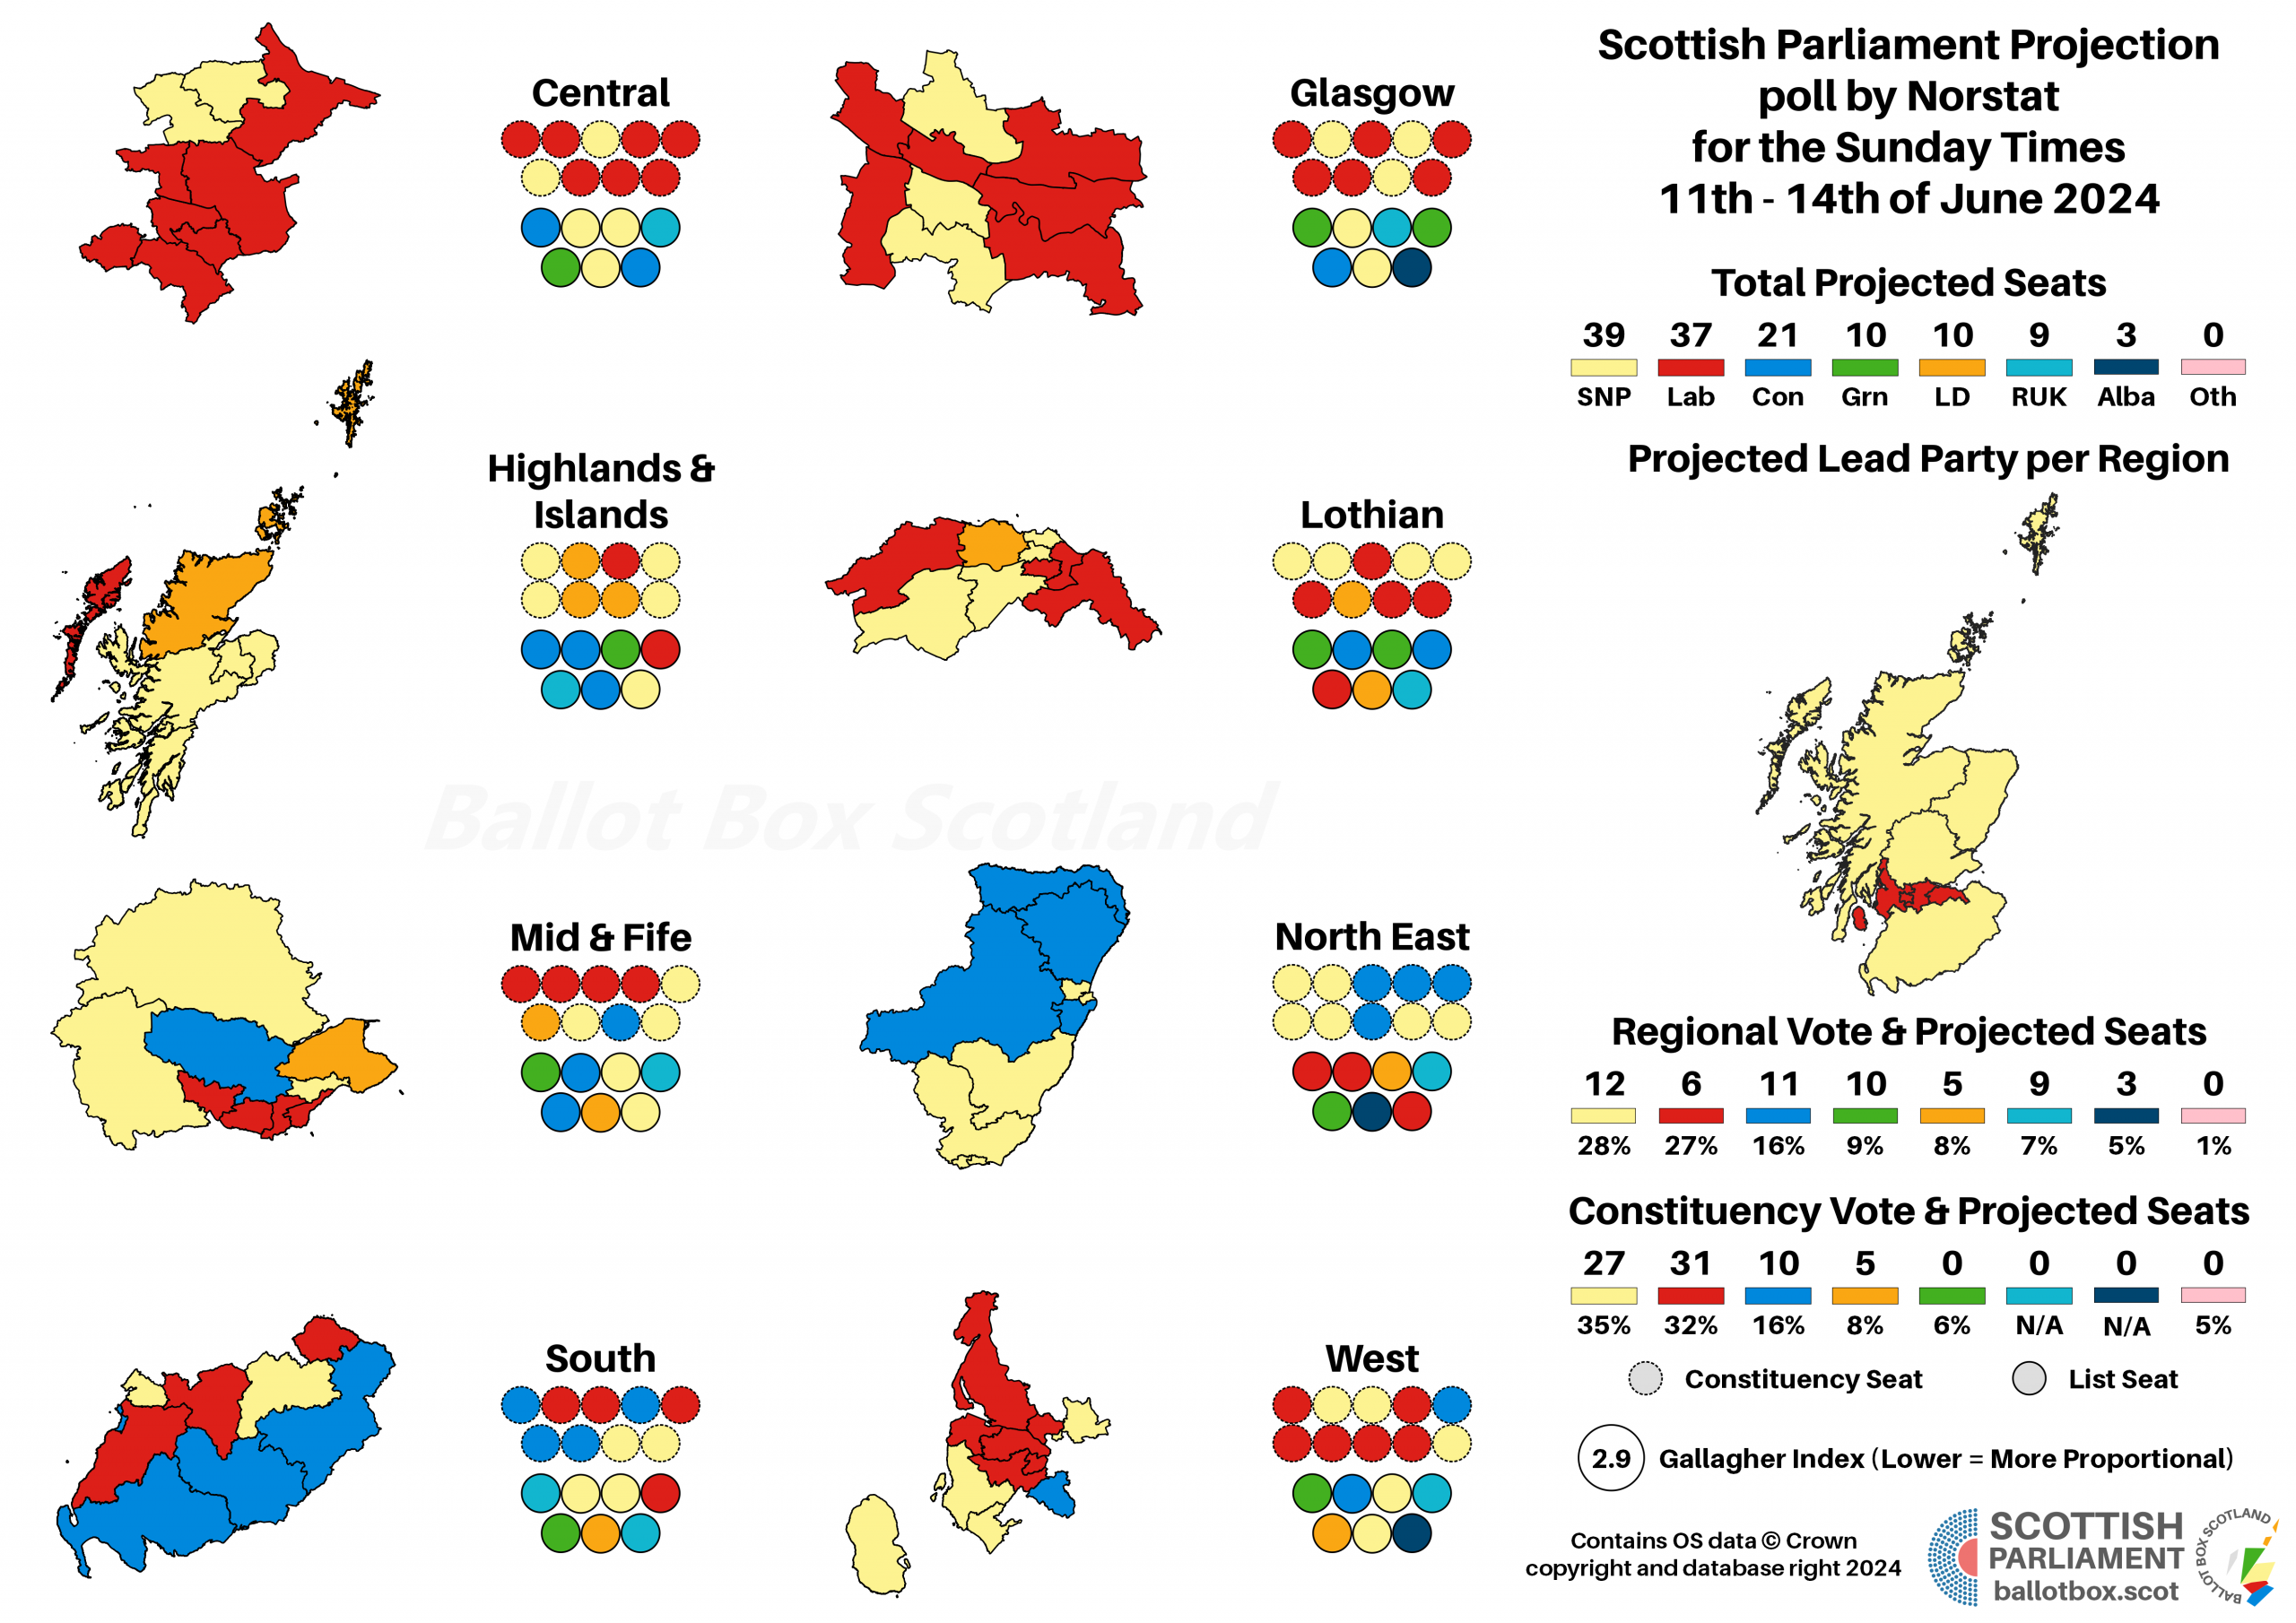

As much as I may have caveated the Reform UK and Alba figures in this poll, they are what they are, and they contribute to a spectacularly chaotic vibe for the seat projection. There’s a clear and substantial lead for the Pro-Union bloc here, at 77 seats to 52 for the Pro-Independence parties.
Not all of the Pro-Union parties would be required for a majority, with the three mainstream parties adding up to a small but workable majority of 68. However, unlike some other recent polling, at only 57 seats the alternative traffic light arrangement (Labour, Lib Dems, Greens) wouldn’t be. That’s a relatively tough situation for Labour to be in, effectively requiring active Conservative support for budgets.
The change figures here look slightly odd, in that No is down 2% without either of the other options changing. That’s just a particularly wonky rounding situation – last poll the rounded figures went up to 101%, here they only go to 99%. In statistical terms, just like the rest of the poll, there isn’t any real change here, all entirely within margin of error never mind the rounding.
It does however keep this question pretty closely run, continuing the trend of finding the constitutional split almost even regardless of the fact the SNP are taking a beating in terms of party voting intention. Same thing I always say here: you need to give your head a wobble if you think this issue has been put entirely to bed, or that your side has any future second referendum in the bag.
Hypotheticals
As ever, the last little bit of analysis concerns those hypothetical and more proportional voting systems that BBS likes to play about with. The use of pure FPTP at Westminster is an affront to democracy, and though Holyrood fares far better, AMS is still deeply imperfect. The examples here simply transpose the poll findings onto more proportional voting systems – the reality is that different systems would of course result in different voter behaviour.
Here’s a really odd little thing here: this system is intended to be “ideally” proportional for parties with at least 3% of the vote. Yet note how Reform UK pip the Lib Dems by a seat here. This is because in my model Reform UK have a much more evenly spread vote than the Lib Dems, giving them a directly elected seat in more constituencies. That’s more than their proportional share, which creates a rare overhang that prevents the Lib Dems from overtaking them.
I don’t think this would happen in reality, as the Reform UK share would be a lot less evenly spread than my model anticipates (remember, it’s building on pretty low shares in 2021), but it’s a great example of how it can be hard to account for newly emergent parties in models predicated on past performance.
Scandinavian Style Westminster
If you find this or other Ballot Box Scotland output useful and/or interesting, and you can afford to do so, please consider donating to support my work. I love doing this, but it’s a one-man project and takes a lot of time and effort. All donations, no matter how small, are greatly appreciated and extremely helpful.
(About Donations)