There’s no rest for the wicked, nor for election nerds. A week on from count day, and I’m still taking an analytical machete to the tangle of data available. Having already covered the new distribution of marginal battleground constituencies, it’s time to take a look at each party’s spread of the vote. I’ll bang my usual drum here which is you’ve got to have the data for both votes on a per constituency basis to really understood what happened in this election and thankfully, unlike most other sources, I do collect and publish that!
SNP
- Best Constituency Vote Share:
- Glasgow Central, 57.4%
- Worst Constituency Vote Share:
- Orkney Islands, 16.2%
- Lost Constituency Deposits: 0
- Best Regional List Vote Share:
- Mid Fife and Glenrothes, 36.0%
- Worst Regional List Vote Share:
- Orkney Islands, 17.1%
- Constituencies Below 5% Regional List Vote Share: 0
- Lost Regional Deposits: 0
As has long been the case for the SNP, their vote share on both votes continues to be relatively evenly distributed: not that many sharp shifts in the shade of yellow on these maps. There’s nowhere they lose their deposit, and even their worst shares are still in the high teens.
Broadly speaking this shows the same pattern we’ve come to expect from the SNP: generally higher support across the Central Belt, especially outside Glasgow and Edinburgh, hotspots in Dundee and Aberdeen Central, and comparatively weak along the Borders and the far north. With the gap between the party’s two votes continuing to widen, the regional map is notably paler however.
One thing really worth pointing out is that Glasgow Central constituency vote figure. If you zoom right in on the constituency map, the dark shade really pops out compared to its neighbours. On the region though, it’s indistinguishable, and well short of the party’s best share in Mid Fife and Glenrothes. What happened there? Well, by regional list vote result, that was the third best Green constituency in the country. In other words, it’s the best constituency they didn’t stand a local candidate in. Given how well they did in the constituencies on either side, we could probably slash 20-25% directly off the SNP share here if they’d faced the competition.
- Best Constituency Vote Swing:
- Shetland Islands, +5.6%
- Worst Constituency Vote Swing:
- Glasgow Southside, -31.5%
- Best Regional List Vote Swing:
- Shetland Islands, -7.5%
- Worst Regional List Vote Swing:
- Glasgow Easterhouse and Springburn, -18.9%
The SNP were narrowly spared from a universal loss of support by two constituencies. One is the aforementioned Glasgow Central: we can take it that is not a “real” increase on the constituency vote given the absence of the Greens, and indeed if you look at the regional map it’s a darker tone than its neighbours, indicating a big loss of support. The other is Shetland, which is completely genuine, both because they obviously gained that constituency, and the Greens contested it. They still lost support there on the list though, which is uniformly grey and mostly darker toned overall.
There are two areas where the SNP’s decreases are generally sharpest. The first is Glasgow and surrounds, where the Greens picked up lots of extra support (in the city) or SNP voters really stayed at home (surrounds). The second are those seats the Lib Dems gained or came close to. Those are by no means the only places that had decreases on the upper end, but they are the ones where you can most see a pattern. Some of their least bad decreases are highly visible on the maps, because it’s Perthshire, the northern part of which is John Swinney’s patch. Perhaps the First Minister being a local man really helped there.
Reform UK
- Best Constituency Vote Share:
- Banffshire and Buchan Coast, 33.9%
- Worst Constituency Vote Share:
- Edinburgh Central, 5.3%
- Lost Constituency Deposits: 0
- Best Regional List Vote Share:
- Banffshire and Buchan Coast, 33.8%
- Worst Regional List Vote Share:
- Edinburgh Central, 6.2%
- Constituencies Below 5% Regional List Vote Share: 0
- Lost Regional Deposits: 0
As Reform were not meaningfully present at the last election, no vote change maps for them. For the regional list vote, basically just take -0.2% off every constituency’s share and that that tells you how much they went up by! Like the SNP, Reform have a pretty even distribution to their vote, which helped ensure they didn’t lose any deposits. They can very, very close to doing so in Edinburgh Central, which is hardly surprising, and indeed that city, alongside Glasgow Southside, Eastwood, Strathkelvin and Bearsden, and North East Fife showed some of the least interest in Reform.
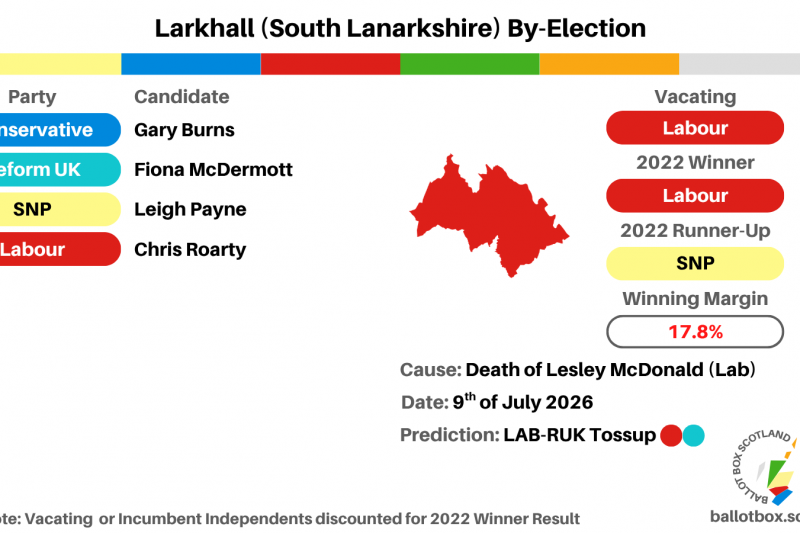
Where they did better than average was largely in line with pre-election expectations: Central Scotland and Lothians West, the North East, and the South. It was however slightly surprising that was the order; I’d had North East as a stronger area overall, and they lived up to that with a very near constituency win in Banffshire and Buchan Coast, which they led the regional list vote in. However, their vote was higher on average in that patch of the Central Belt in between the two big cities, as well as in the easternmost parts of Glasgow. In addition, their vote in the South was less from the rural components, especially the Borders, and more from rural Ayrshire, Clydesdale and Hamilton, Larkhall and Stonehouse.
That may point us to the kinds of places where we can expect Reform to gain the most councillors next year. It’s entirely believable they replicate the Conservatives 2017 success and have a “councillor in most wards” result across the Lanarkshires, West Lothian, Falkirk and the Ayrshires, as well as Renfrewshire and Inverclyde. Dumfries and Galloway and Southern Fife should be good for them too, as should Angus, Aberdeenshire and Moray. However the Highlands may be harder to crack, especially given the penchant for Independents, Edinburgh may only see a handful, and in Glasgow it’ll be the far east and far south of the city most likely to see councillors.
Labour
- Best Constituency Vote Share:
- Edinburgh Southern, 42.9%
- Worst Constituency Vote Share:
- Shetland Islands, 1.5%
- Lost Constituency Deposits: 10
- Best Regional List Vote Share:
- Na h-Eileanan an Iar, 26.2%
- Worst Regional List Vote Share:
- Banffshire and Buchan Coast, 4.0%
- Constituencies Below 5% Regional List Vote Share: 4
- Lost Regional Deposits: 0
With Labour, we start talking about parties with much more notable concentrations of support. That means they lost a total of 10 constituency deposits, though we can see the impacts of tactical voting under FPTP by the fact that they only placed below 5% of the regional list vote in 4 constituencies. Given that includes constituencies like Shetland and Fife North East, it’s easy to imagine that’s otherwise Labour voters plumping for the Lib Dems.
The opposite is evident on the regional list vote however. Overall the shades of red are much lighter, and it’s really notable that the best Labour share on that vote isn’t either of the two mainland constituencies they held, but instead their gain in Na h-Eileanan an Iar. Edinburgh Southern ran about 17% different between the votes, and Dumbarton was not far behind on 16% difference. Even seats they didn’t win but would have really hoped to have wide differences: around 9% in East Lothian Coast and Lammermuirs, 6% in Hamilton, Larkhall and Stonehouse.
Outside the Central Belt, Labour have withered away to nearly nothing. Even in Dundee they failed to cross 20% on the regional vote in either constituency, and it’s particularly remarkable how poorly they do in Dumfries and Galloway, which unlike the rest of rural Scotland had long periods of Labour constituency representation in both parliaments in my lifetime.
- Best Constituency Vote Swing:
- Na h-Eileanan an Iar, +10.0%
- Worst Constituency Vote Swing:
- Glasgow Southside, -10.9%
- Best Regional List Vote Swing:
- Na h-Eileanan an Iar, +4.9%
- Worst Regional List Vote Swing:
- Glasgow Central, -8.0%
Despite their loss of support, more than any other party Labour have an intriguing spread of areas they actually gained support in against national trend. Barring Na h-Eileanan an Iar though, none of those shifts are really where Labour needed them to be. If you zoom in on the constituency swings map in particular, we can see what an absolutely catastrophic miscalculation Labour made in this election with their much discussed “constituency strategy”. Even until polling day, even as their vote continued to tick, tick, tick downwards, the Scottish Labour operation was briefing they were on track for a constituency bonanza of upwards of 30 seats.
This went far beyond the usual natural optimism from a campaign and into genuinely delusional territory. As the scale of their crisis became apparent, a sensible campaign would have pulled the plug on most of those and retreated into around a dozen key constituencies, pouring resources into a couple of seats in each region (barring Highlands and Islands and the North East) with the best prospects of success, to chip away at the SNP’s constituency over-representation.
Labour did no such thing. Instead, they kept bombarding the nation with empty, pointless adverts on YouTube, running a Presidential campaign for a candidate who didn’t have the personal popularity for it. There was no focus, no cleverness, no real strategy, just the sheer belief they were going to if not win, at least run the SNP far closer than the polls suggested. And what was their reward? -8% in Edinburgh Central. -4% in East Lothian Coast and Lammermuirs, Clydebank and Milngavie, and in Hamilton, Larkhall and Stonehouse. -11% in Rutherglen and Cambuslang. Some of their most winnable constituencies had some of their worst decreases.
Then, because they’d pinned all their hopes on the constituencies, as if they were completely politically illiterate, they experienced further losses on the regional list vote they could ill-afford. They did so shockingly poorly they are now the third party of not just Edinburgh but also Glasgow, behind the Greens. 15 years ago, the SNP being narrowly first in Glasgow was an absolutely jaw-dropping result. Now, placing 5% behind the Greens feels like exactly what their campaign justified, and they now face the very real risk of being beaten again in next year’s council elections, especially in Edinburgh.
Green
- Best Regional List Vote Share:
- Edinburgh Central, 37.6%
- Worst Regional List Vote Share:
- Banffshire and Buchan Coast, 4.5%
- Constituencies Below 5% Regional List Vote Share: 1
- Lost Deposits: 0
- Best Regional List Vote Swing:
- Glasgow Central, +15.5%
- Worst Regional List Vote Swing:
- Banffshire and Buchan Coast, +0.7%
As the Greens only stood in six constituencies, and those were not usefully comparable with where they stood in 2021 due to boundary changes, I’ve not bothered showing a constituency map for them. I have however made a little normal chart just to quickly show the headline results.
On the regional list vote front though it’s universally upwards movement for the Greens, though how strongly varies widely. Rural Aberdeenshire and Na h-Eileanan an Iar remained the toughest nuts for them to crack, but their performance in Scotland’s two big cities was astonishing, leading to their first ever constituency wins with one in each. They also overtook Labour in both regions, meaning that within the core city components they’ll have been even further ahead.
Notable patches of support are also visible throughout the country, most notably in Stirling and Aberdeen Central where they came second. They might finally be able to win more than a single councillor in Stirling next year, and with some very strong results in Dundee too, assuming their North East branches can stop knifing each other for five minutes, they could finally break onto Scotland’s third and fourth cities.
Based on these vote shares, I’d also be advising keeping an eye out for the Greens adding additional councillors to their sole representatives in East Lothian and the Borders (particularly in Tweeddale). If the play their cards right, they could also be seeing councillors in Renfrewshire (15% in Paisley) and Fife (14% in Dunfermline), whilst they should feel relatively confident of largely holding what they have in Highland, Clackmannanshire and Moray.
One final little thing worth mentioning: already placing only 2% behind Labour nationwide, the Greens had a marginally higher (by 0.5%) floor and much higher (by 11%) ceiling on their list vote. The latter is partly down to how much more concentrated the Green vote is, but also, it somewhat punctures one of the biggest myths about the Greens only being a tactical vote: in fact, their shares in the two seats they won are nigh-on identical on both votes, and very similar in the other mainland constituencies they contested. Unlike Labour, those who voted for Green constituency MSPs were almost entirely not doing so tactically, and then their votes carried over comfortably to the list.
Conservative
- Best Constituency Vote Share:
- Ettrick, Roxburgh and Berwickshire, 44.8%
- Worst Constituency Vote Share:
- Shetland Islands, 1.2%
- Lost Constituency Deposits: 23
- Best Regional List Vote Share:
- Ettrick, Roxburgh and Berwickshire, 37.8%
- Worst Regional List Vote Share:
- Glasgow Central, 2.9%
- Constituencies Below 5% Regional List Vote Share: 12
- Lost Regional Deposits: 1
Although the Conservatives had an absolutely awful election, areas of real strength are still very visible on the map. They remain very strong across large parts of rural Scotland, primarily in the South and the North East, plus Moray and Perthshire. Limited patches of urban (or suburban) strength are also visible in the likes of Eastwood, which they very nearly held, Ayr, Edinburgh South Western, and Aberdeenshire South and North Kincardine.
On the other hand, the bulk of the Central Belt looks like an absolute deadzone for the party, worse even than their pre-revival era. They lost their deposit in every single Glasgow constituency, and lost both of their MSPs in the city, leaving them without a national spread for the first time in history. Barring Moray, the Highlands and Islands have also reverted to seriously weak territory for the party.
Similar to the other Pro-Union parties, the Conservative share in the constituencies they held is notably higher on the constituency than list vote. This indicates that for all the other troubles the party was facing, a certain amount of tactical voting in favour of the incumbent was in play. Also note that the Conservatives are in a similar position vis a vis the Greens as Labour; their floor is lower, and on the regional vote their ceiling was only 0.2% higher.
- Best Constituency Vote Swing:
- Orkney Islands, -2.5%
- Worst Constituency Vote Swing:
- Inverness and Nairn, -23.2%
- Best Regional List Vote Swing:
- Glasgow Southside, -5.4%
- Worst Regional List Vote Swing:
- Banffshire and Buchan Coast, -19.3%
As you might expect it’s all negative for the Conservatives on these maps. The best thing they can say about these maps is that they show, particularly the constituency map, their vote holding up relatively well in several key constituencies. Relatively light colouration in Aberdeenshire West and Galloway and West Dumfries for example help explain how the Conservatives held on to those constituencies.
On the other hand, look how dark the hue is across the Highlands and Islands. Whilst I did have a fall to a single MSP there in my final prediction, that was rooted more in an expectation either the SNP or the Lib Dems would break the proportionality in that region. In actual fact it ended up the only region to deliver an accurately proportional result, and the Conservatives genuinely lost three of their seats without being able to point the finger at disproportionality.
Don’t let the relatively light colouration of Glasgow on these maps fool you: it’s only that they were starting from a lower base so had less to lose in the first place. Given that what they did lose cost them both seats, that’s absolutely dire. If Reform and the Greens can expect a bumper haul of new councillors next year, the Conservatives are very likely to end up wiped back out across large parts of the western Central Belt. Glasgow certainly will end up sans Conservatives barring a real shock turn of events, and it’s easy to imagine the likes of North Lanarkshire, East Dunbartonshire, Inverclyde and West Lothian ending up without any too.
Lib Dem
- Best Constituency Vote Share:
- Orkney Islands, 70.2%
- Worst Constituency Vote Share:
- Airdrie, 2.6%
- Lost Constituency Deposits: 25
- Best Regional List Vote Share:
- Fife North East, 41.4%
- Worst Regional List Vote Share:
- Glasgow Easterhouse and Springburn, 2.4%
- Constituencies Below 5% Regional List Vote Share: 25
- Lost Regional Deposits: 2
Lib Dem maps have always been like this since I took an interest in politics: a couple of handfuls of genuinely deep support, vast swathes of negligible support (in this case costing them over a third of their constituency deposits, and a quarter of their regional), and in between a few barely darker patches of residual support that often marks places that have several councillors.
The other aspect that has been common in recent years is how much paler the map is for the regional list vote versus the constituencies. The Lib Dems more than any other party are the masters at digging in to key constituencies, but that is in part built on a strong tactical appeal to other parties voters – other Pro-Union party voters specifically. That’s a large part of why their regional list vote nationwide is always a bit lower than their constituency vote, because it isn’t being padded out as much by those stonking victories. The other part is that even in non-target areas they usually do a smidge worse on that vote.
In any case, all of the notably dark patches on these maps are constituencies the Lib Dems either won or came reasonably close to this year. Their support in Orkney is so strong that this is I think the highest proportion of the vote for any MSP in Holyrood’s history! The mainland Highlands and Argyll and Bute at least form a big contiguous stretch of support, whereas barring their Edinburgh double act the rest of their constituencies are more scattered.
- Best Constituency Vote Swing:
- Strathkelvin and Bearsden, +25.1%
- Worst Constituency Vote Swing:
- Shetland Islands, -14.3%
- Best Regional List Vote Swing:
- Inverness and Nairn, +19.4%
- Worst Regional List Vote Swing:
- Paisley, +1.1%
Looking at the change in votes and the Lib Dem constituency map is effectively an inverse of the SNP: they’re up, up, up everywhere… except Shetland, where they had that shock loss. Even there, they made gains on the regional list vote, really emphasising just how bad a candidate choice they made for the constituency.
The deepest shades cover Strathkelvin and Bearsden, Skye, Lochaber and Badenoch (both of which they won) and Inverness and Nairn (which they almost did), really showing the effects of their intense, targeted campaigning in those areas. The regional list vote map also makes clear how they made regional MSP gains in the North East and South: some very creditable increases, particularly in sort of central Aberdeenshire and in Tweeddale. Meanwhile it also demonstrates their continued lack of presence in Glasgow and in Central Scotland and Lothians West: very, very pale, reflecting very limited movement.
More still to come!
There’s still lots to do to complete my analysis of the election! A big piece of work will be adding dedicated pages for each region. I’ve so far only done Central Scotland and Lothians West but will be doing the rest over the coming period, so give that page a check and let me know if anything is glaringly wrong or unclear. I’ll also be doing my usual hypothetical “this is not a particularly good system of PR, what if we used something else instead?” run through at some point. That’s especially relevant this year, given this was the least proportional election in Holyrood’s history.
If you find this or other Ballot Box Scotland output useful and/or interesting, and you can afford to do so, please consider donating to support my work. I love doing this, but it’s a one-man project and takes a lot of time and effort. All donations, no matter how small, are greatly appreciated and extremely helpful. (About Donations)