Keep tabs on all the latest polling, articles and information ahead of the 2021 Scottish Parliament election in the Ballot Box Scotland Holyrood Hub!
It’s been another busy week in polling, so busy in fact we’ve had two polls from the same agency. On Tuesday night I posted the analysis of a Survation poll spanning the 9th to the 12th of March. I finish the week on Friday with a Survation poll spanning the 11th to the 18th! Just a touch of overlap in terms of who was commissioning polling and when. With that in mind, even more than normal any “changes” between polls here could be largely down to margin of error rather than actual shifts.
I nearly added to this surfeit of Survation surveys (try saying that five times fast) as well! Last summer I’d scoped them out for some BBS-commissioned polling, on the basis we’d heard from them the least at the point I asked. However, I’d have had to entirely crowdfund the cost of the poll. As I noted on Twitter, given the ongoing pandemic I didn’t feel it was right to ask people who already donate to support the project to put their hands in their pockets for a poll too.
Display format for this post:
- Party/Option – Vote% (Change vs last poll by agency 9th – 12th of March / vs last election or referendum)
Regional Vote
SNP ~ 39% (nc / -3)
Labour ~ 20% (nc / +1)
Conservative ~ 19% (-2 / -4)
Green ~ 11% (+1 / +4)
Liberal Democrat ~ 7% (-1 / +2)
Reform UK ~ 1% (nc / +1)
UKIP ~ 1% (nc / -1)
A few little differences here compared to the previous Survation, with the Conservatives slipping behind Labour on the list vote, the Lib Dems dropping a point, and Greens gaining one. That looks like a lot more negative than positive changes, but that can come down to rounding and the nameless “others” portion.
Constituency Vote
SNP ~ 50% (+4 / +3)
Conservative ~ 21% (nc / -1)
Labour ~ 20% (-3 / -3)
Liberal Democrat ~ 8% (nc / nc)
Green ~ 1% (+1 / nc)
This vote looks more starkly different to the other poll this week, putting the SNP bang on half the vote. Here it’s Labour who are down to make room for that, putting them back behind the Conservatives, though this is the less important vote for their total seat share anyway.
Seat Projection
Please see this page for how projections work and important caveats.
SNP ~ 67 (+6 / +4)
Conservative ~ 21 (-3 / -10)
Labour ~ 25 (-1 / +1)
Green ~ 11 (+1 / +5)
Liberal Democrat ~ 5 (-3 / nc)
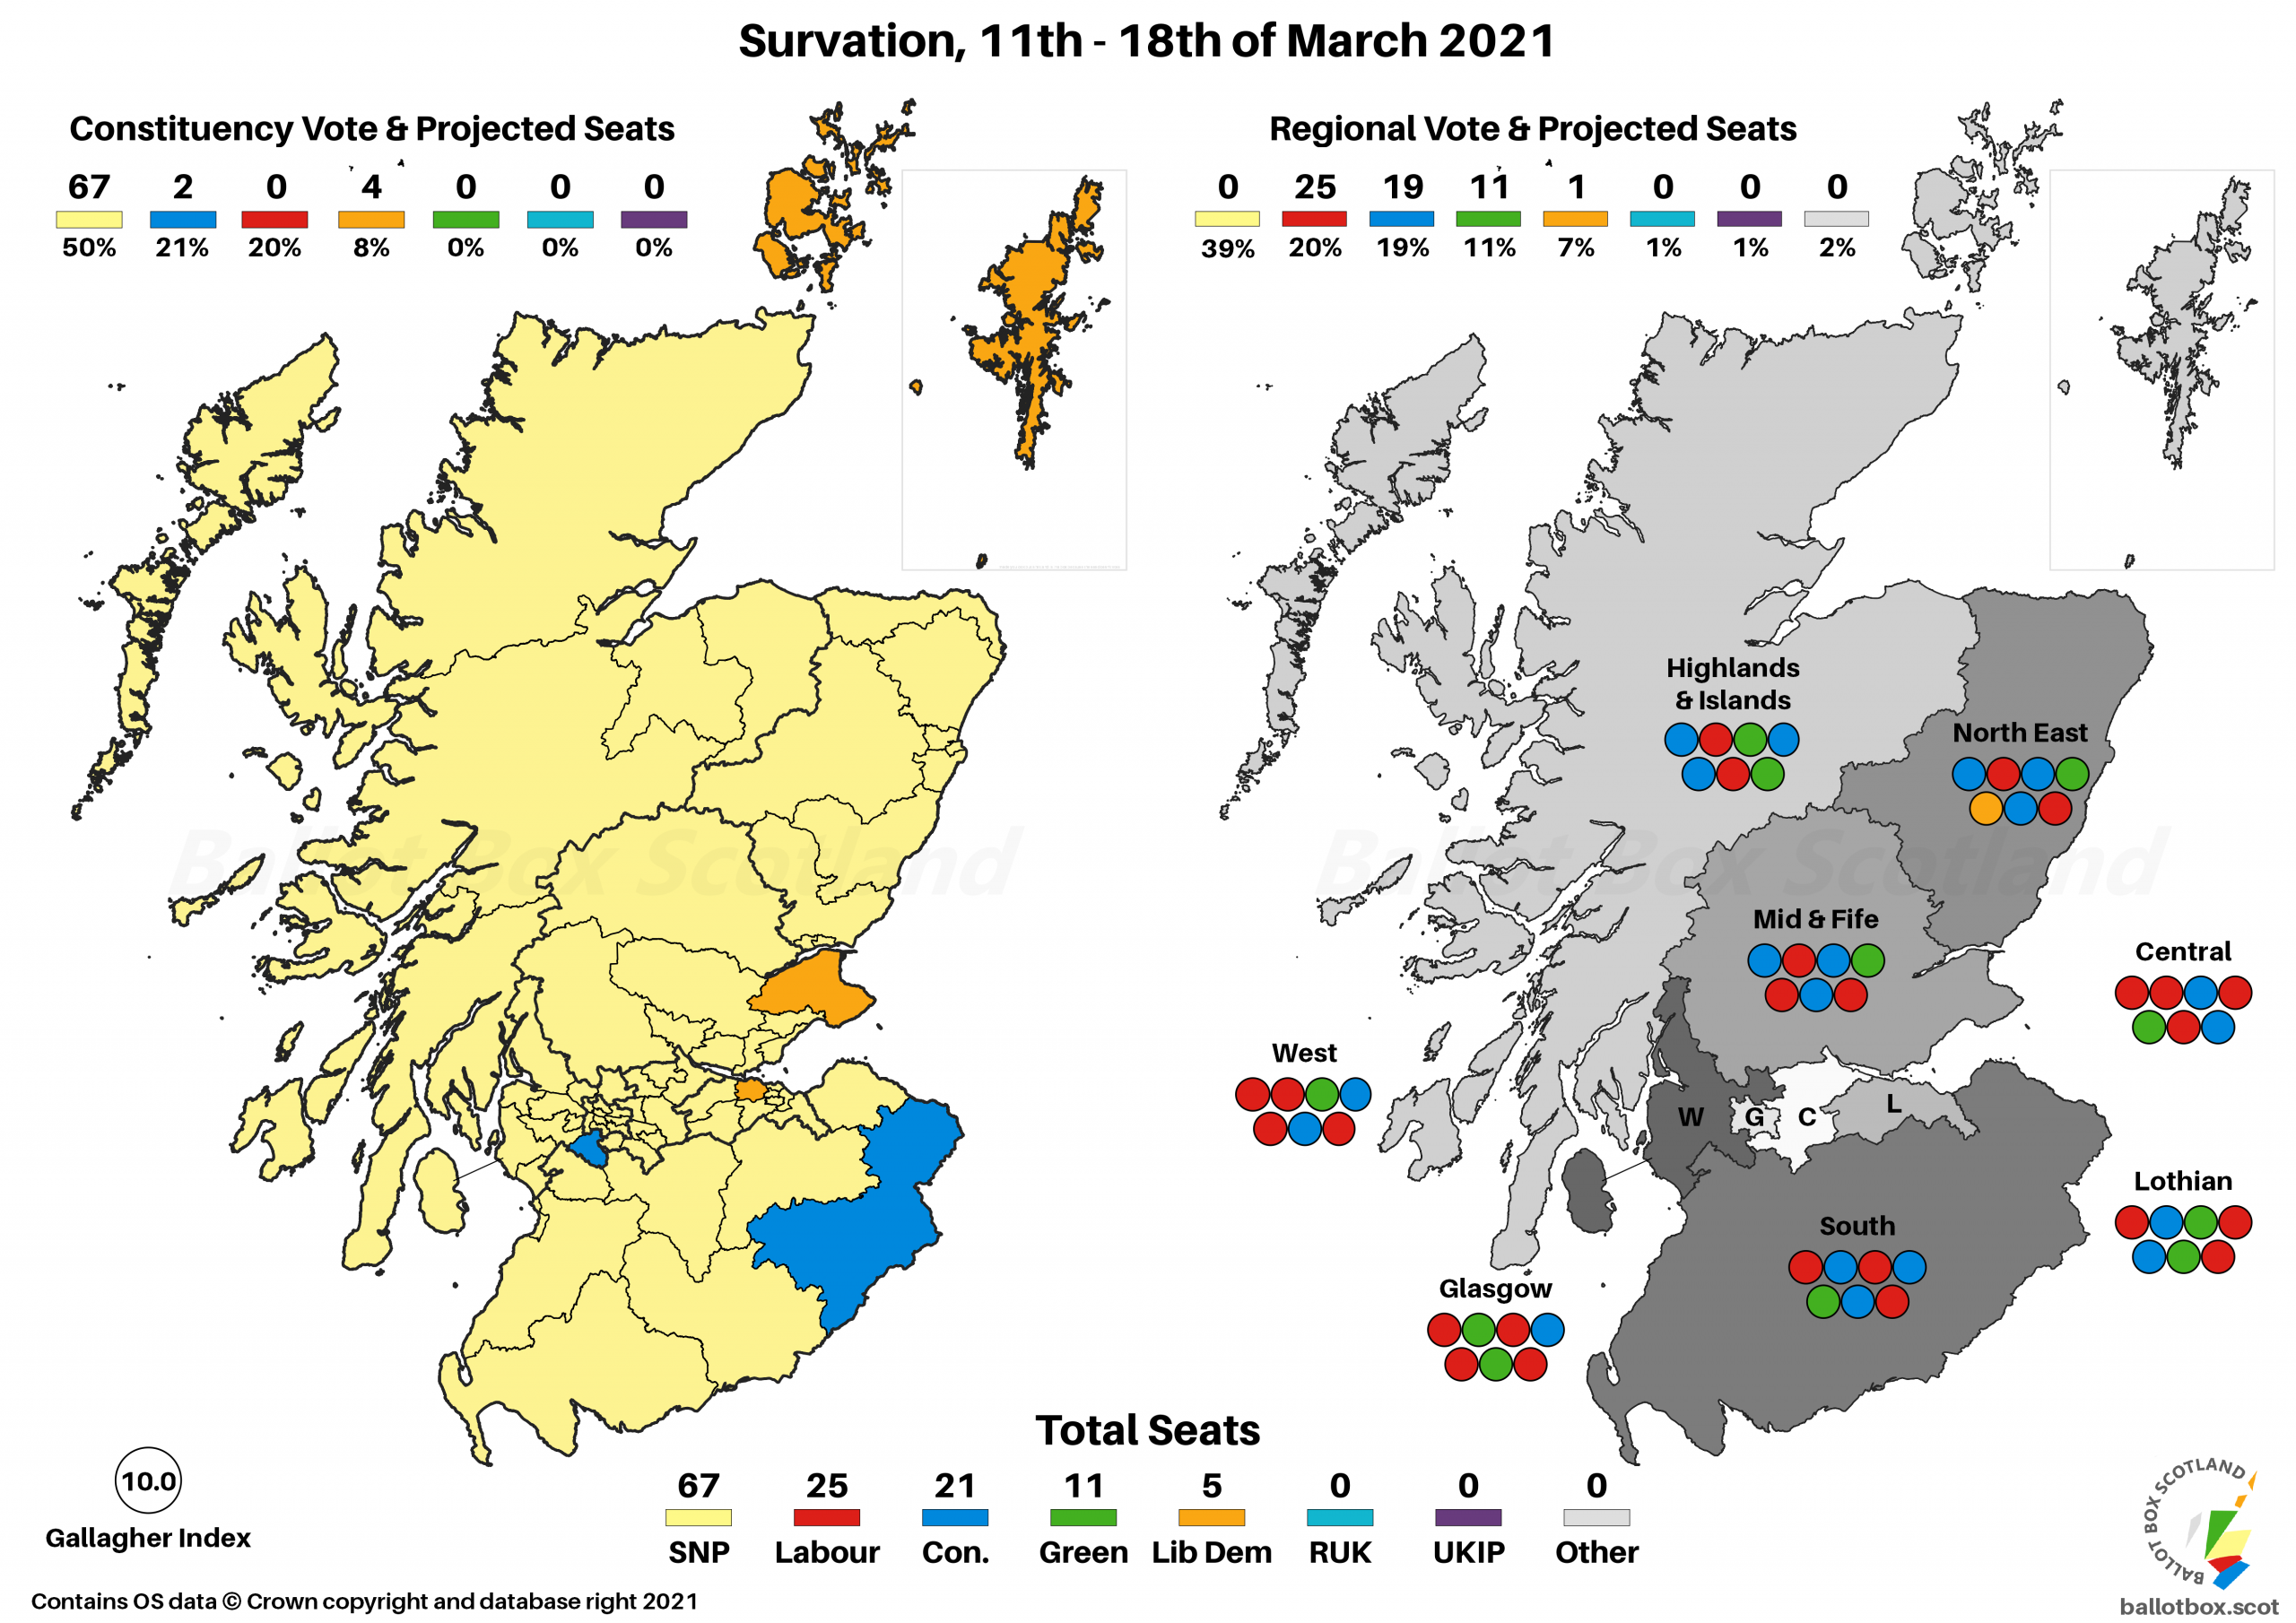

That difference in the constituency vote makes all the difference for this projection, giving the SNP a majority with 67 seats. That’s the second highest seat projection for them this month, whereas the earlier Survation was their worst projection since 2019. Not confusing at all, eh?
Labour are again ahead of the Conservatives, which is actually justified this time due to being ahead in the proportional vote. In other “small shifts mean big changes”, losing just 1% of that vote has the Lib Dems projecting to the same 5 seats they currently hold, whilst an opposing bump for the Greens gives them their highest seat projection this month.
SNP ~ 49% (+3 / +4)
Conservative ~ 21% (-1 / -4)
Labour ~ 21% (-2 / +2)
Liberal Democrat ~ 7% (nc / -3)
Green ~ 1% (+1 / nc)
Over on the Westminster vote, we’re seeing broadly the same dynamics as the Constituency vote, with the SNP higher than the other poll, and Conservatives and Greens lower.
Note that changes here are versus the 25th – 26th of February as the earlier March poll used a non-standard and thus non-comparable question.
Standard Question
No ~ 45% (+1)
Yes ~ 43% (nc)
Don't Know ~ 12% (nc)
Just a very slight change here that pulls No a bit further ahead when it had been been basically rounding in the previous poll.
Excluding Don't Knows
No ~ 51% (+1 / -4)
Yes ~ 49% (-1 / +4)
That therefore translates to an actual lead for the Union when we exclude Don’t Knows. We’re still absolutely knife-edge when it comes to polling at the moment, which is nice and indecisive of us as a country. I reckon we’ll probably have to wait until after the election before we see whether we’ve entirely settled into a period of clear support for one side or the other again.
Council Area Projection
Please see this page for how projections work and important caveats.

On a simple Uniform Swing versus 2014, this might put a total of 20 Councils in the No column, a decrease from 28 in 2014. Yes could be on 12, up from 4 at the referendum.
Hypotheticals
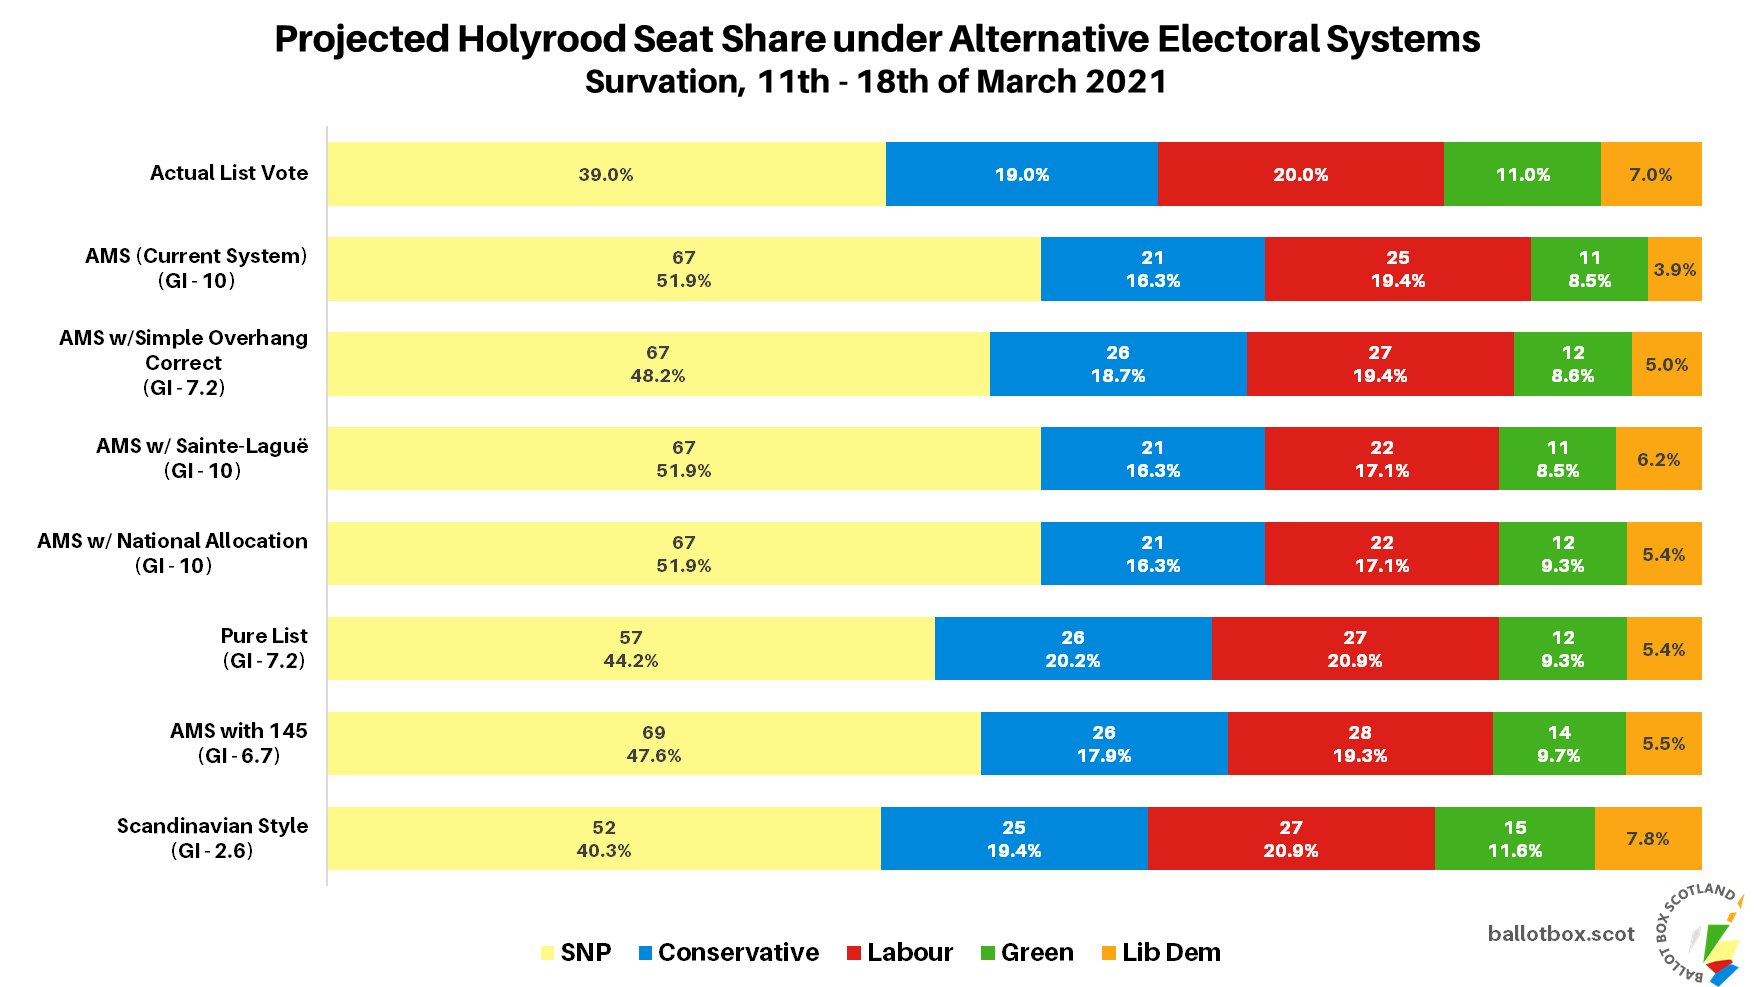
As ever, the last little bit of analysis concerns those hypothetical and more proportional voting systems that I have a bee in my bonnet about here at BBS. The fact Westminster uses pure FPTP is an affront to democracy, and though Holyrood fares far better, AMS is still deeply imperfect. The examples here simply transpose the poll findings onto more proportional voting systems – the reality is that different systems would of course result in different voter behaviour.
Changes here are vs AMS / vs same projection for the last poll.
SNP ~ 52 (-15 / +1)
Labour ~ 27 (+2 / +1)
Conservative ~ 25 (+4 / -3)
Green ~ 15 (+4 / +2)
Liberal Democrat ~ 10 (+5 / -1)

Long-time followers of BBS will know the score here – lots fewer SNP seats, more for everyone else. This would more accurately reflect the constitutional and partisan balance, giving us 67 seats for the combined pro-Independence parties rather than 67 for the SNP alone.
Scandinavian Style Westminster
Changes here are only versus the same projection on the last poll, given my aversion to doing projections on pure FPTP.
SNP - 29 (+2)
Conservative - 13 (nc)
Labour - 13 (-1)
Liberal Democrat - 4 (-1)

Obviously this would be massively different to FPTP where the SNP would continue to win the overwhelming majority of seats in the country.
If you find this or other Ballot Box Scotland output useful and/or interesting, and you can afford to do so, please consider donating to support my work. I love doing this, but it’s a one-man project and takes a lot of time and effort. All donations, no matter how small, are greatly appreciated and extremely helpful.
(About Donations)