Keep tabs on all the latest polling, articles and information ahead of the 2021 Scottish Parliament election in the Ballot Box Scotland Holyrood Hub!
The finish line is in sight, which is why we’ve had a whopping THREE polls in the past 24 hours. YouGov’s final contribution was both the last to be released of today’s batch and to begin fieldwork, coming entirely within this month. It also seems to be the most focussed poll, as it relates only to Holyrood, at least what was initially published. If there are later data releases I will try and add them in, but it’s… rather late in the game for “holding back questions for more clicks”, media outlets.
I had intended on publishing this one tomorrow, but having thought about it, if I can keep a separation between the polls out today and tomorrow, that might be wise. I know we’ve got ComRes and Ipsos MORI due – and with any luck, those will be the last two polls of the campaign! (Update: It was extremely wise to do this one on the Tuesday as THREE polls emerged on Wednesday, and it was confirmed there WAS more data in this poll that came out as well.)
Display format for this post:
- Party/Option – Vote% (Change vs last poll by agency 16th – 20th of April / vs last election or referendum)
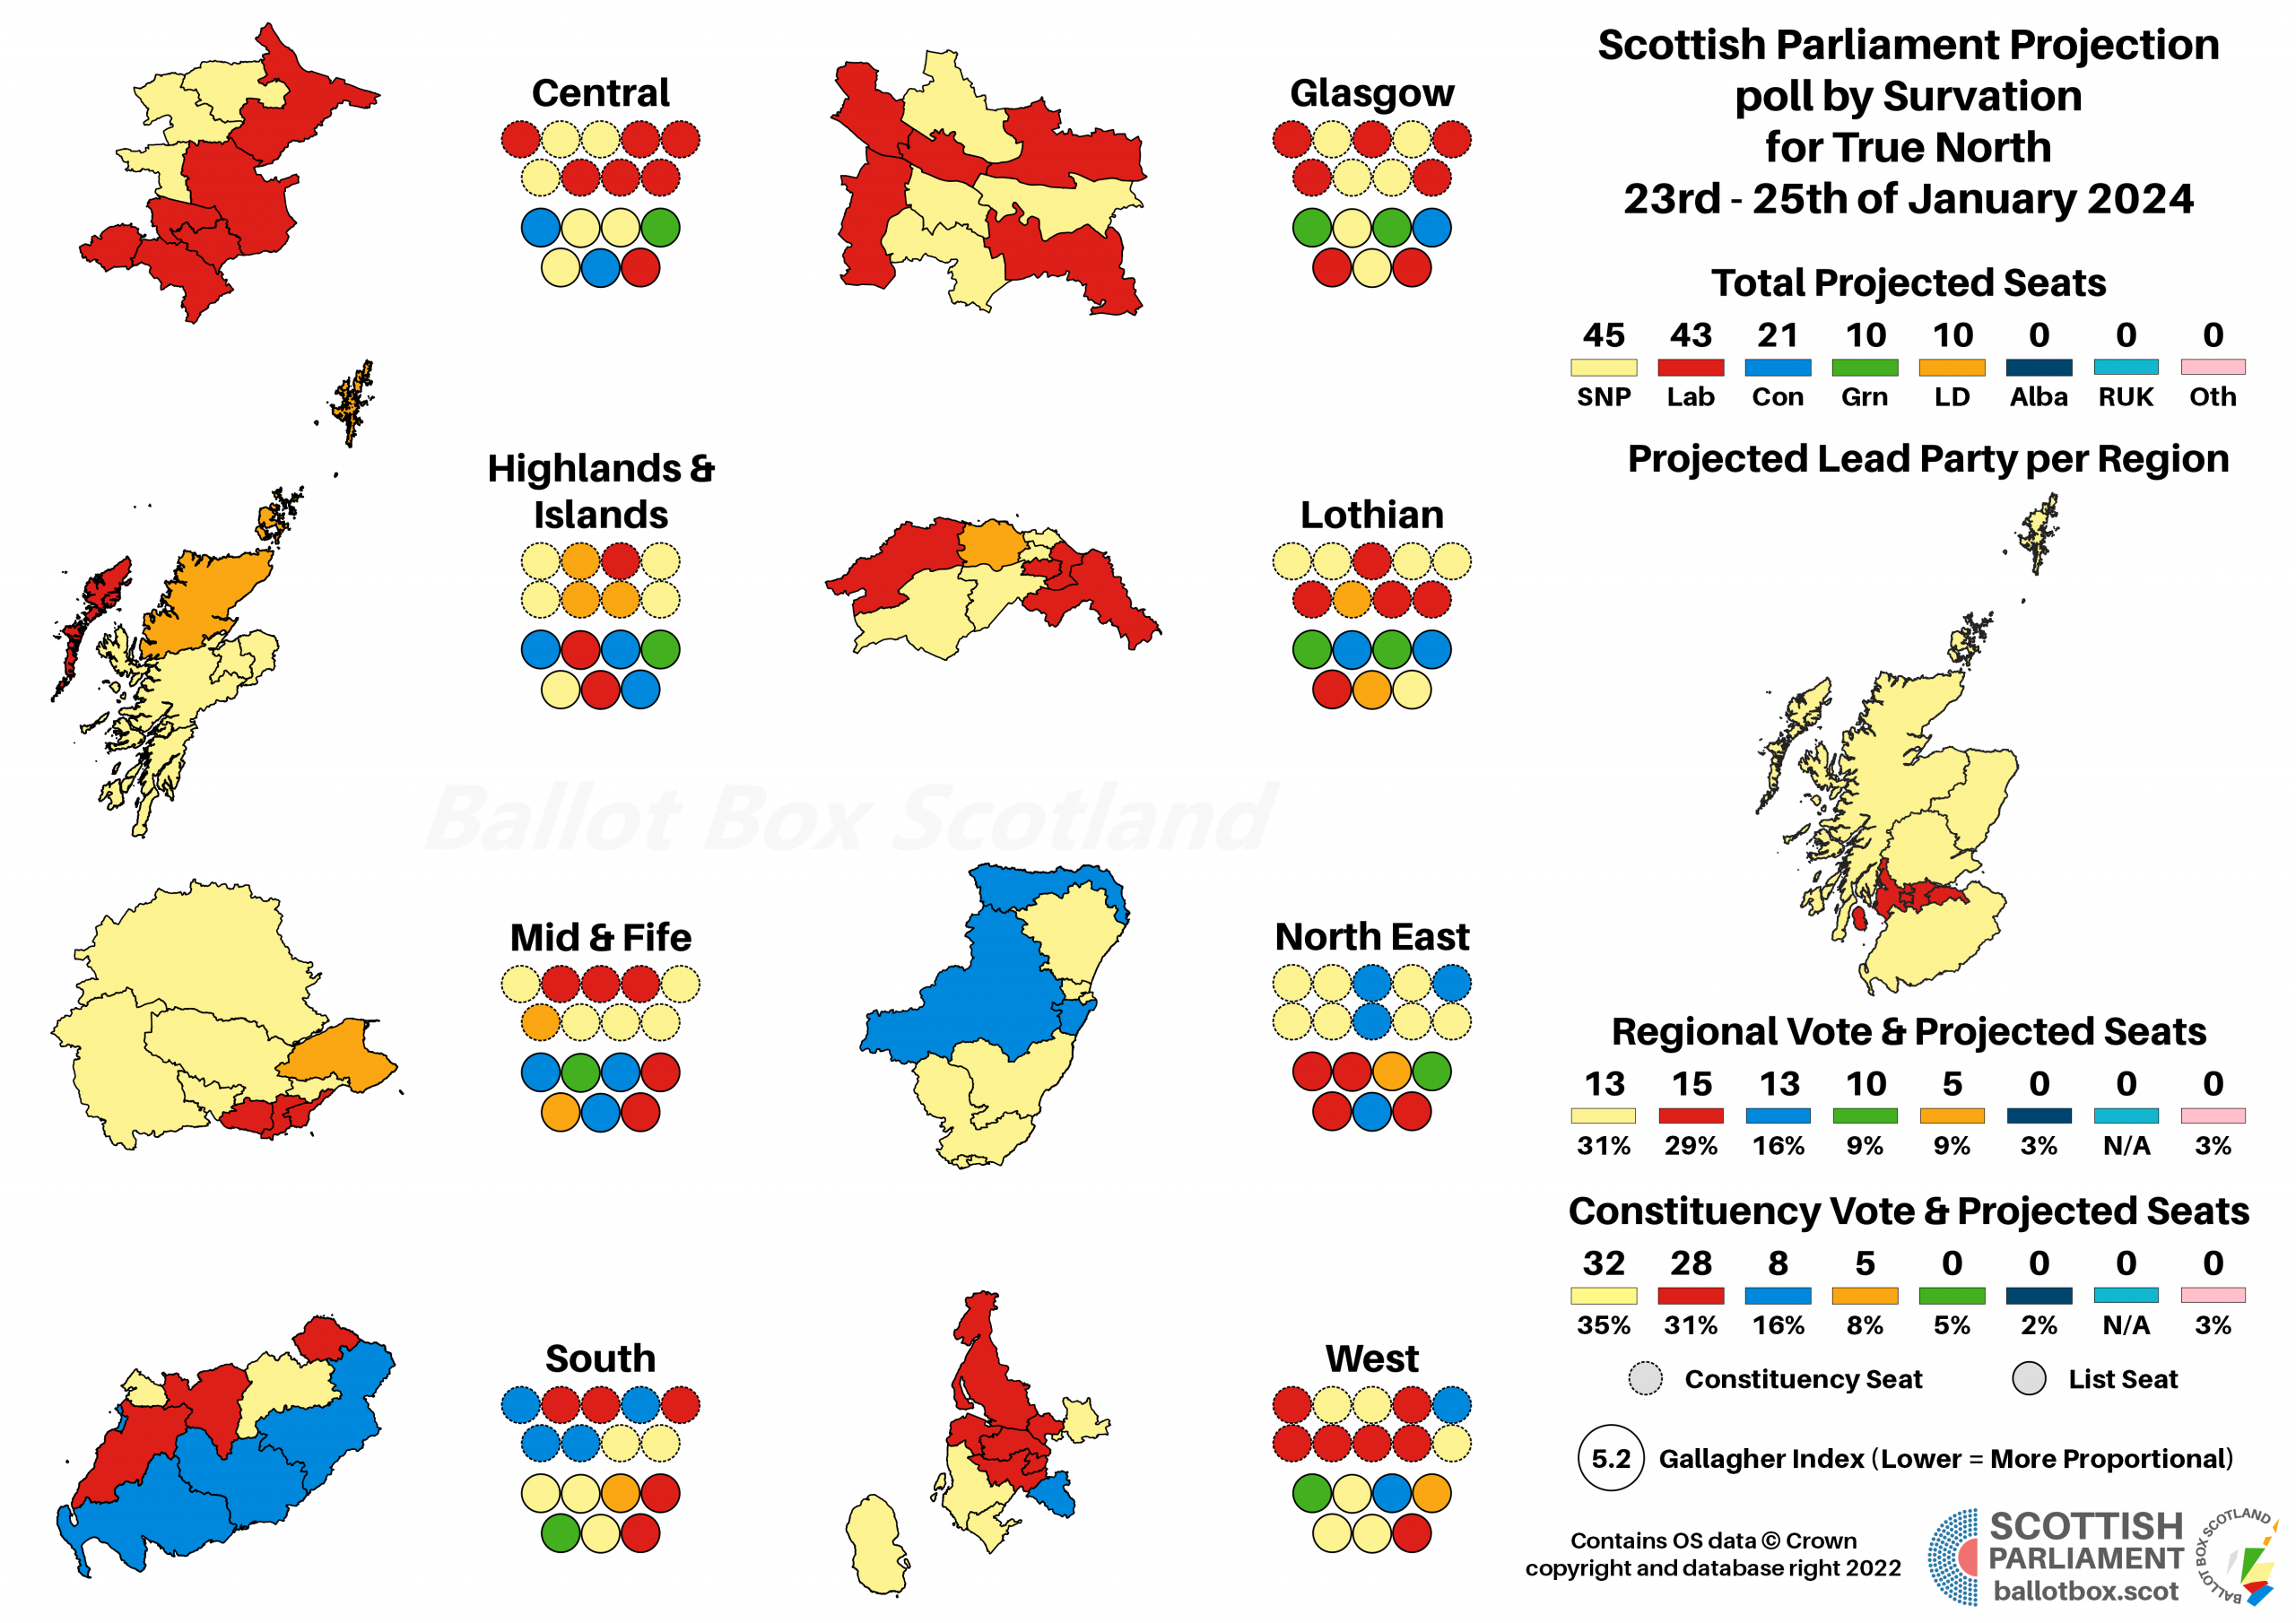
Regional Vote
SNP ~ 38% (-1 / -4)
Conservative ~ 22% (nc / -1)
Labour ~ 16% (-1 / -3)
Green ~ 13% (+3 / +6)
Liberal Democrat ~ 5% (nc / nc)
Alba ~ 3% (+1 / +3)
All for Unity ~ 1% (nc / +1)
What’s most remarkable here is that the Greens are within touching distance of Labour, on their highest share with any pollster in this term. Given what we’ve seen from those other pollsters this is quite likely to be an outlier, however. That’s balanced by slight decreases for both the SNP and Labour, and there’s also a small uptick for Alba. Conservative polling has been extremely consistent across pollsters lately, so this one is bang on their average.
Constituency Vote
SNP ~ 52% (+3 / +5)
Conservative ~ 20% (-1 / -2)
Labour ~ 19% (-2 / -4)
Liberal Democrat ~ 6% (nc / -2)
Green ~ 2% (+1 / +1)
Over on the constituency ballot, the SNP are actually up quite a bit, which in a counter to what every other party needs, is effectively the right way round for them to maximise their seats. The Conservatives and Labour are down slightly, but since they are in the opposite position to the SNP of more desperately needing list votes, that’s unlikely to be too concerning to either party.
Seat Projection
Please see this page for how projections work and important caveats.
Projecting that into seats might give us something like this:
SNP ~ 70 (+2 / +7)
Conservative ~ 25 (-2 / -6)
Labour ~ 18 (-1 / -6)
Green ~ 12 (+1 / +6)
Liberal Democrat ~ 4 (nc / -1)
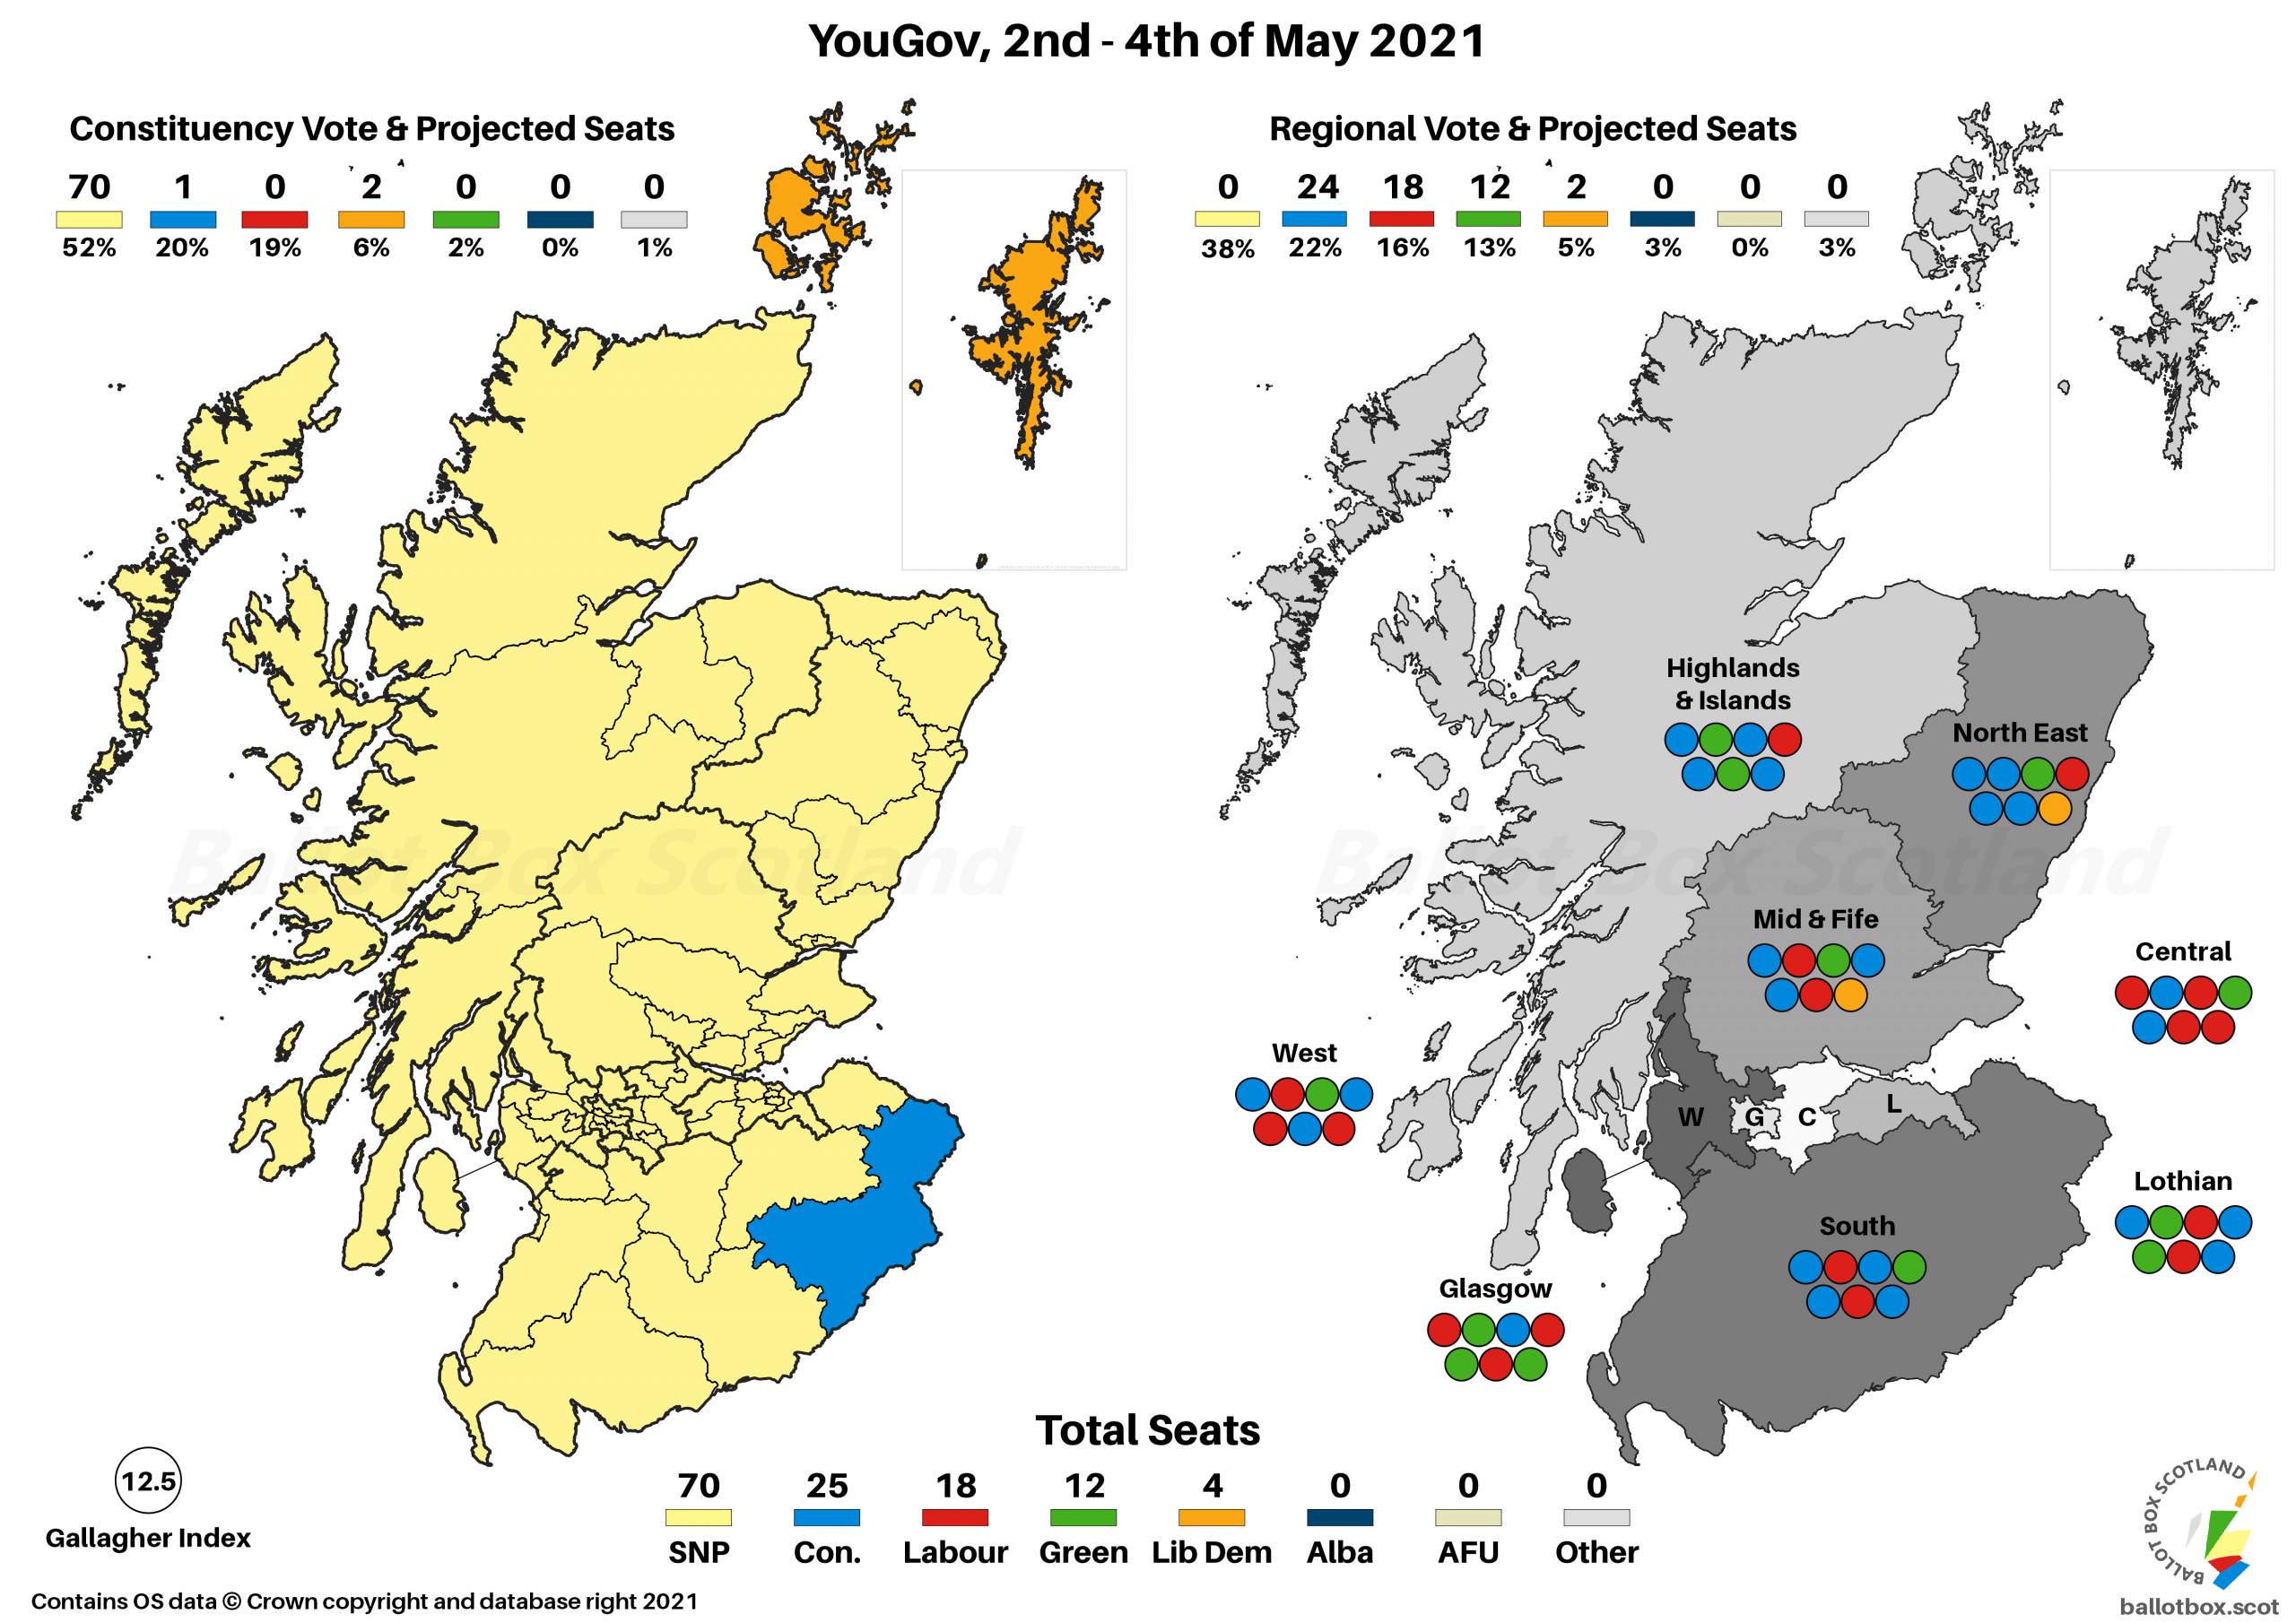

A big majority of the constituency vote for the SNP projects to a big majority in seats, giving us one of those almost clean-sweeps. Even in this scenario I would be rather sceptical of this degree of success, with areas like North East Fife likely to remain elusive. 12 seats for the Greens is also almost their best projection of this entire term, whilst this is another low for the Lib Dems due to those intense overhangs.
As I’ve noted a few times, 3% is the point at which I reckon it’s about 50/50 as to whether Alba get Salmond into the North East, and my model thinking “no” could well be falling on the wrong side of that.
If you’re looking closely at the runners up map, you may spot the Greens placing second in Inverness and Nairn. That is absolutely, 100% guaranteed to just be a blip in my model – indeed, it’s by just 0.03% ahead of the Conservatives. Given the Greens relatively limited constituency contest rate in the past, it’s hard to gauge where they will fall. I’m using the list vote as their baseline in most cases as a result, and in this case the model just gets a bit… broken. There just isn’t time to try and fix that, so, I’ve let it stand, but just be aware it’s clearly off!
SNP ~ 48% (nc / +3)
Conservative ~ 22% (-2 / -3)
Labour ~ 19% (nc / nc)
Liberal Democrat ~ 5% (+1 / -5)
Green ~ 4% (+1 / +3)
The SNP still very clear leaders in polling for the other parliament, though unchanged on the last poll, and a similarly unchanged Labour remain in third. Though second the Conservatives drop two points, whilst both the Lib Dems and Greens gain a point each. YouGov are the least favourable Westminster pollster for the Lib Dems, and most positive for the Greens, putting the parties neck-and-neck. Even if this was accurate however, the Greens would likely have a much more evenly spread vote, whilst the Lib Dems could probably count on holding Orkney and Shetland.
Standard Question
No ~ 46% (+1)
Yes ~ 41% (+2)
Don't Know ~ 8% (-2)
Putting aside YouGov’s continuing odd tendency to include refused/didn’t answer in their reporting, they join the bulk of pollsters in finding the Union out in front, albeit with a narrower lead than the last poll, with Yes recovering slightly from the first sub-40% figure since December 2019.
Excluding Don't Knows
No ~ 53% (nc / -2)
Yes ~ 47% (nc / +2)
Taking it to a straight No vs Yes question and it’s the same 6 point lead as the last poll. I keep emphasising we’re in the margin of error, but the very final entry in the agency average tracker for the Holyrood campaign now has it at 51:49 in favour of the Union.
Council Area Projection
Please see this page for how projections work and important caveats.

On a simple Uniform Swing versus 2014, 26 Council areas might lean towards No, down just 2 from the 28 then, whilst Yes could be out in front in 6, up from 4.
Hypotheticals
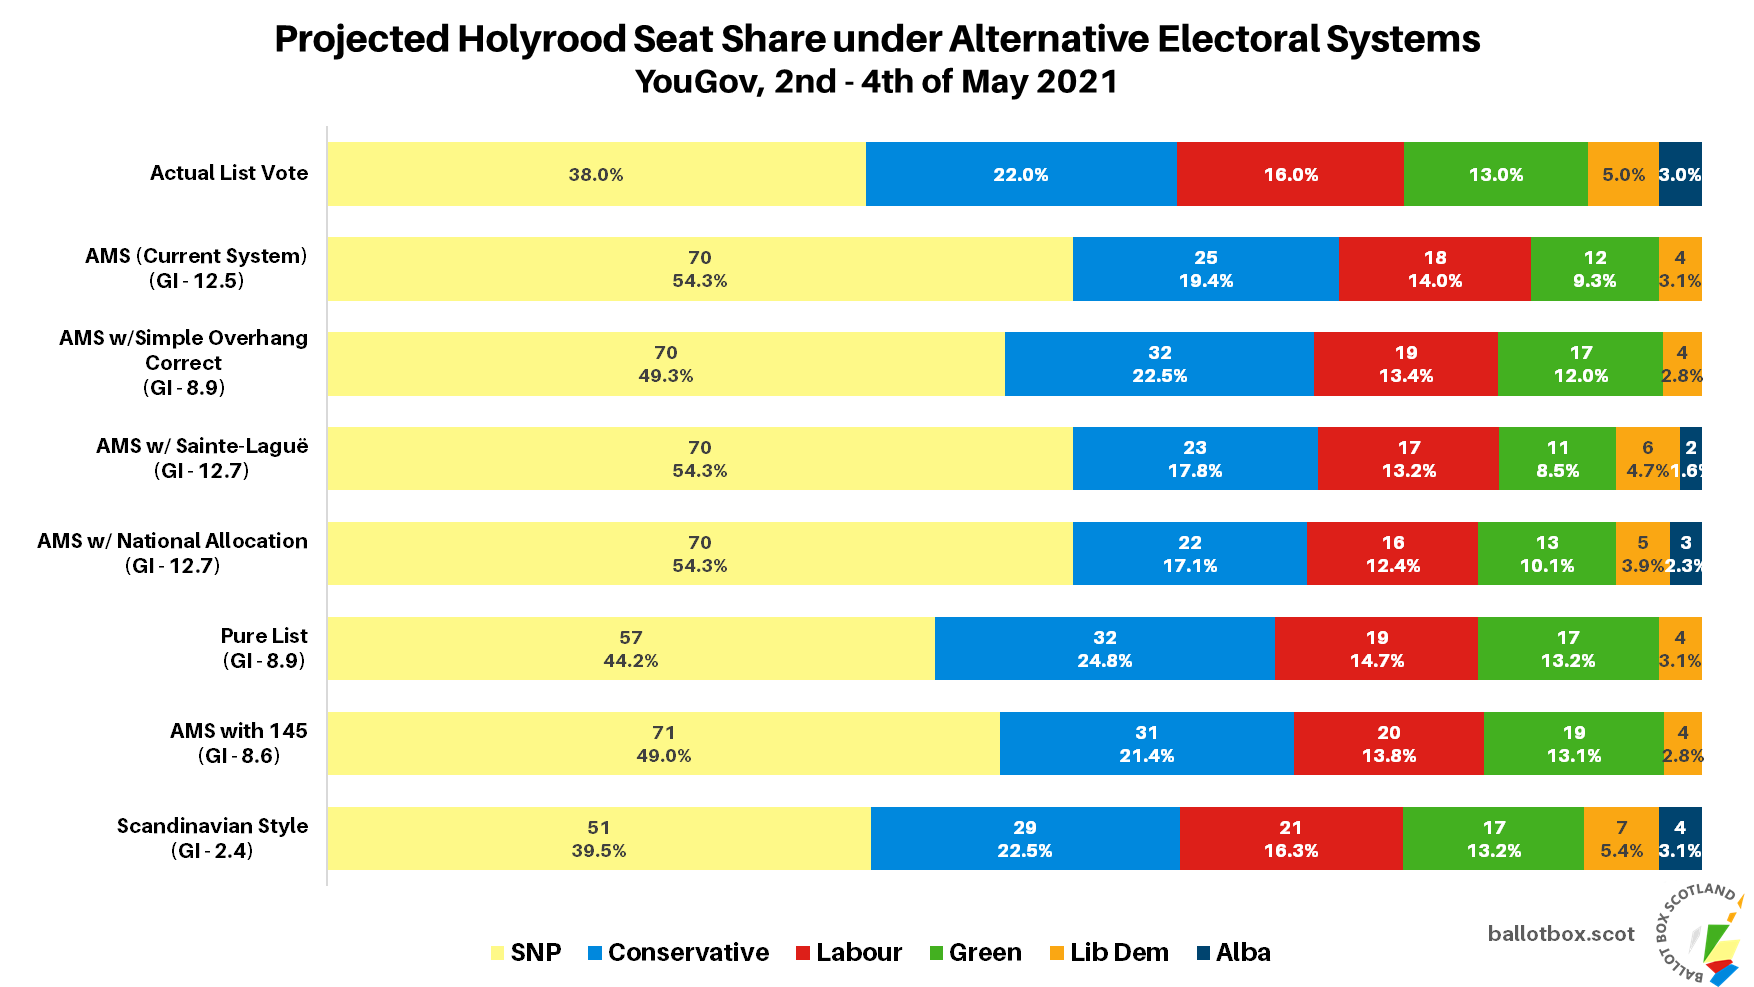
As ever, the last little bit of analysis concerns those hypothetical and more proportional voting systems that I have a bee in my bonnet about here at BBS. The fact Westminster uses pure FPTP is an affront to democracy, and though Holyrood fares far better, AMS is still deeply imperfect. The examples here simply transpose the poll findings onto more proportional voting systems – the reality is that different systems would of course result in different voter behaviour.
As the election approaches and polls are coming out more frequently, I’m jettisoning the actual map for this one for now. I still think it’s a fun and useful exercise, but it’s also time consuming to manually change 129 bubbles! (The AMS projection is only 56 bubbles, because the 73 constituencies are driven from a spreadsheet).
Changes here are vs AMS / vs same projection for the last poll.
SNP ~ 51 (-19 / -3)
Conservative ~ 29 (+4 / -1)
Labour ~ 21 (+3 / -3)
Green ~ 17 (+5 / +3)
Liberal Democrat ~ 7 (+3 / nc)
Alba ~ 4 (+4 / +4)
We should know what happens when we imagine a more proportional system – the SNP would do much worse than under AMS, and everyone else much better. Though Alba would win a handful of MSPs under this scenario, there’d actually be a reasonably comfortable pro-Independence majority just between the SNP and Greens of 68 seats.
Scandinavian Style Westminster
Changes here are only versus the same projection on the last poll, given my aversion to doing projections on pure FPTP – and, given pressures of looming Holyrood election, again no accompanying map.
SNP ~ 29 (nc)
Conservative ~ 13 (-2)
Labour ~ 12 (+1)
Liberal Democrat ~ 3 (+1)
Green ~ 2 (nc)
A more modest though still large SNP group than we’d expect FPTP to return, and far more MPs from every other major party, including a pair of Greens.
If you find this or other Ballot Box Scotland output useful and/or interesting, and you can afford to do so, please consider donating to support my work. I love doing this, but it’s a one-man project and takes a lot of time and effort. All donations, no matter how small, are greatly appreciated and extremely helpful.
(About Donations)