2022 in Review: Council By-Elections

Background and Caveats

Full Elections

Although for your average voter, and indeed political journalist, local elections are the least exciting and important vote, that’s absolutely not the case for Ballot Box Scotland. That’s why this year has ended up the biggest and best (if I may say so myself) since I launched this project in 2018. Although this piece is mostly going to be about local by-elections, it’d be daft not to reflect on May’s full elections.

Even before the election, you could find a massive amount of coverage on the LE22 Hub. In addition to the usual party profiles and a comprehensive breakdown of where they were standing, I had the Wards Worth Watching series picking out some of the key contests in all 32 councils. In addition, thanks to generous crowdfunding support, I was able to commission my first ever poll with both national and local questions. If that wasn’t enough for you, BBS live-reported results on Twitter throughout the day, ably supported by a team of wonderful volunteers.

That only scratched the surface of results however, and over the course of the following three months I compiled what I believe to be the most detailed dataset ever produced for a Scottish election. For every single council and ward in Scotland, you can find more data than you’d ever have thought possible, plus some further analysis building on that data. It’s not just candidates, councillors, first preferences, and turnout – it’s a complete breakdown of transfer rounds, second preferences per party, votes by polling district, and two-candidate preferred winners.

Okay, I promise I’m about to stop patting myself on the back, but honestly it’s been an incredible year for BBS. It’s also been an exhausting one, as in an ideal world it shouldn’t fall to a volunteer to gather all this data. That said it’s been an absolute blast, and there’s one more bonus bit of analysis due out for LE22, as a bit of a Christmas treat…

By-Elections

Before that however, we’ve got the usual annual review to get through. Given we had those full elections in May, the limited number of by-elections we’ve had since then tell us even less about the “national” picture than would normally be the case – we don’t need them to, because we had that nationwide vote not so long ago! 

Well, an almost nationwide vote, because of course a number of wards ended up uncontested. Three of those were “undercontested” and thus automatically triggered by-elections, and one of the other uncontested seats ended up voting anyway after by the resignation of a councillor who had never expected to be elected. That means of the 9 by-elections that followed the main elections, only 5 of them actually have results to compare. That’ll complicate figures!

Regardless of the number and spread of by-elections (and we had a lot more last year), remember they always make up just a small fraction of Scotland’s 355 wards. That alone means these figures aren’t representative of the whole country anyway, even if there weren’t uncontested wards in the mix. Also important for many by-elections, especially in the more rural wards, is the absence of popular independent councillors. Councillors that continue to serve or who have sadly passed away obviously don’t appear on the ballot for by-elections, and so that can limit the usefulness of direct comparisons with May 2022 in their wards.

Finally, remember the most important aspect of STV – that the nice simple language used for FPTP of “gain/loss/hold” isn’t as applicable here. Whoever vacated one of three or four seats is not always the same as the overall winner at the last election. It’s entirely possible for the vacating party, the party that had a first preference lead, and the party that would have won a single seat election in May 2022 to all be different!

There’s an “orphaned” 2022 by-election that took place in January – that is not counted in this piece, as it wouldn’t make sense given it was followed by the full election. I mention it only if anyone is enough of a nerd to remember it happened and quibble with me about it!

Seat Shifts

As usual, let’s start with how changes in seats, with all the complexity that involves under STV. The table below shows each of this year’s by elections with both the vacating party and 2022’s notional winner shown, alongside the eventual winner of the by-election. You can click the ward name to see the result analysis for each by-election.

And translating that table into a simpler chart format:

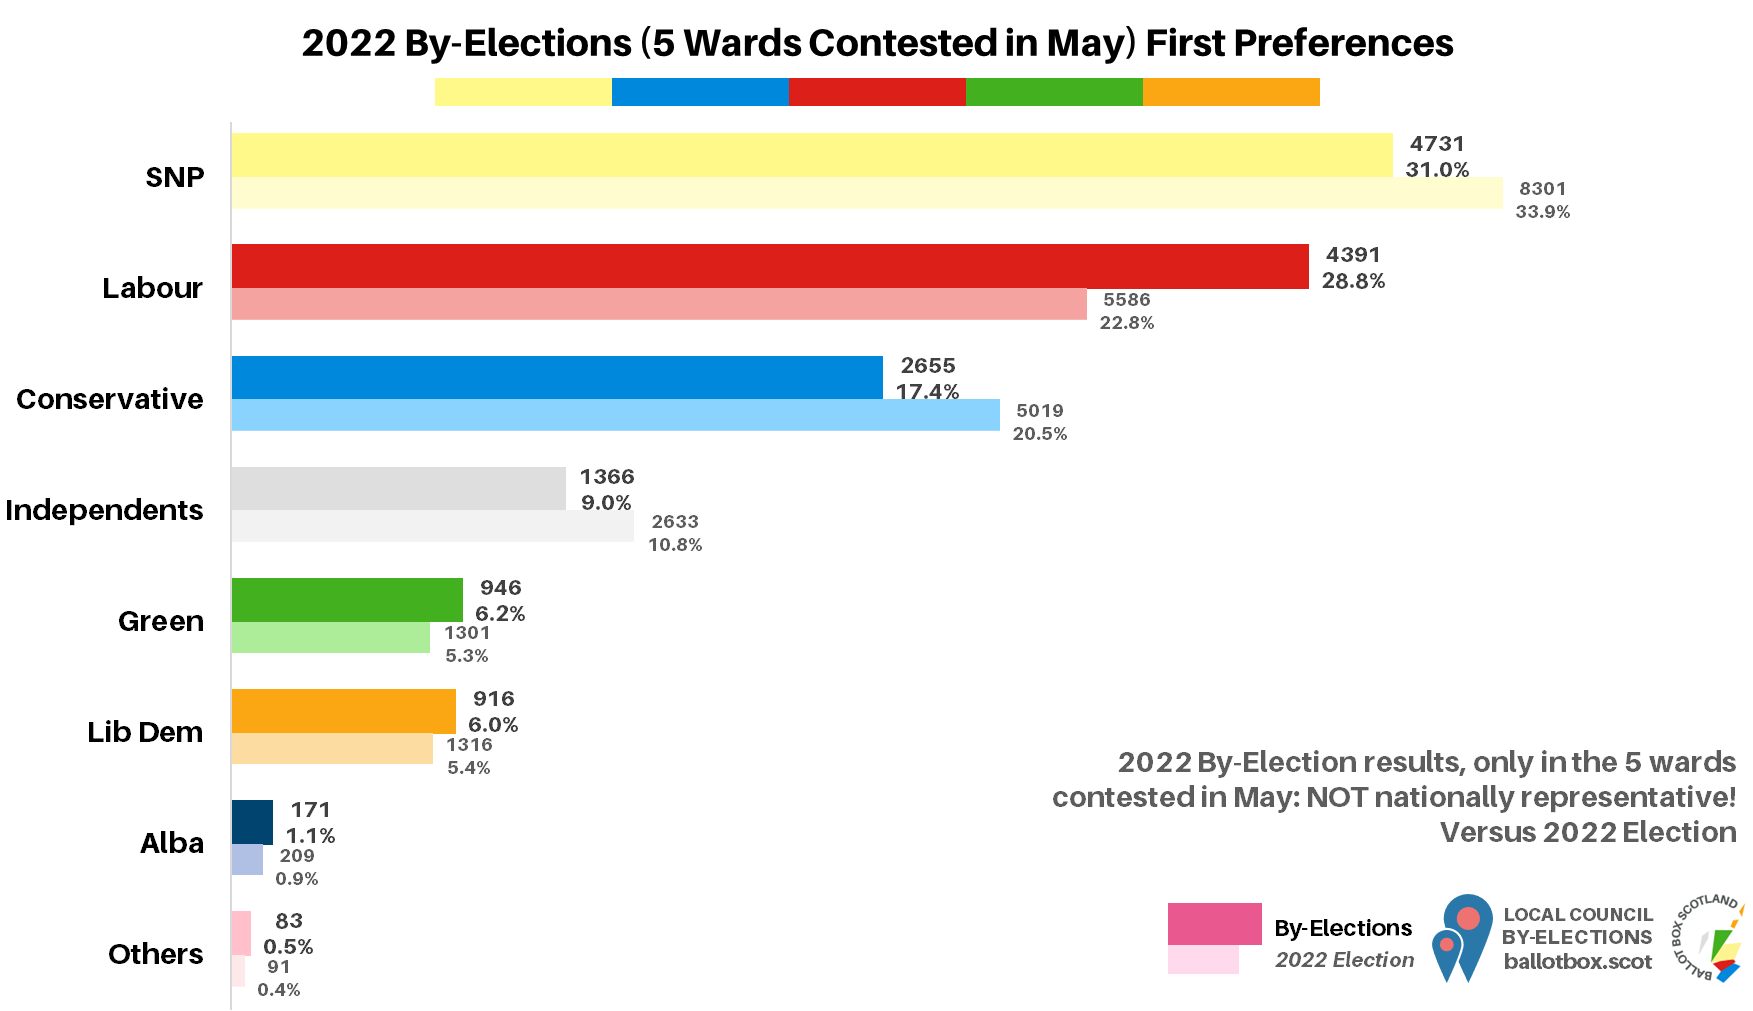
When visualising the results this way, it really jumps out how many of this year’s by-elections have no comparability to May’s results. It also means the seats won end up looking relatively favourable for everyone bar the Lib Dems (and the Greens, but they didn’t feature either in vacating or defending senses anyway.) If we look first specifically at the comparison with seats vacated, which is more impactful for political control but less reflective of voter change (note Independents use slightly different terminology as they aren’t directly comparable to one another):

⚪Independent: Vacated 2, won 5 (net +3)
🟡SNP: Gained 1 (net +1)
🔵Conservative: Gained 1 (net +1)
🔴Labour: Vacated 3, held 2, lost 1 (net -1)
🟠Lib Dem: Vacated 1, lost 1 (net -1)

By this measure Independents end up winning big, whilst Labour and the Lib Dems lose out. At the same time, the SNP and Conservatives look to have come from nowhere to pick up a seat each – which is why I scream inside when I see (otherwise very good) UK-level accounts doing this kind of simple gain/loss terminology in their tweets without any explanation whatsoever as to how STV works. If we instead do the more electorally relevant comparison with the May 2022 single-seat winner:

⚪Independent: Expected 2, won 5 (net +3)
🔴Labour: Defending 1, held 1, gained 1 (net +1)
🔵Conservative: Defending 1, held 1 (net nc)
🟡SNP: Defending 1, gained 1, lost 1 (net nc)
🟠Lib Dem: Defending 0 (net nc)

Independents still end up with the most gains here, but then the only other party making gains are Labour, having won both the ward they were May leaders in and another where that had been the SNP. Conservatives are entirely neutral, as they held their one defence, whilst the SNP made up for their loss to Labour by picking up a seat in what had been an uncontested ward.

It’s worth adding further caveats here though. Although it wouldn’t be strictly correct to tally it up this way as there aren’t any May figures to compare with, you’d have expected Independents to win all three Islands by-elections, so they really emerge with what you’d largely expect anyway. Likewise the SNP would probably have been favourites in Buckie, so that’s more likely to be a net  -1 for them if imagining a reality they hadn’t inexplicably failed to stand a second candidate in that ward in May.

First Preference Votes

First Preferences across all 9 By-Elections

In terms of actual votes, there’s no comparison with May for the raw first preferences, given how many of the wards were uncontested. The number of Islands by-elections is pretty apparent here from the number of votes for Independents, which isn’t too far behind the Conservative total. Overall, the general pattern here isn’t too different to the national picture from May – SNP ahead but not overwhelmingly so, Labour somewhat ahead of the Conservatives, and the Lib Dems leading the Greens.

First Preferences across 5 By-Elections in Wards Contested in May

If we take out the uncontested wards, the picture changes dramatically. Given the two urban by-elections where Labour won make up 63% of the total votes across all five, they end up with significant gains that put them just behind the SNP, who are down a few points. In negative swing terms however it’s the Conservatives who are narrowly the worst off, again reflecting extremely poor results in Linn and Broxburn (etc) wards.

The Greens end up squeaking ahead of the Lib Dems on this measure, but again that comes down to where the votes are coming from – a decent advantage in Linn plus the fact they contested Shetland West and the Lib Dems didn’t.

First Preferences across 4 By-Elections with Holyrood 5

Taking Shetland West out is all that happens for this chart relative to the previous one, hence the Lib Dems re-overtaking the Greens. This gives the narrowest gap between the SNP and Labour of any of these measures, but again remember how dominant those two wards that swung Labour are in the total. These figures are useful as indicators of what has happened overall across these wards since May, but this isn’t reflective of Scotland as a whole! Nonetheless, this is further evidence that points in particular to growth for Labour and decline for the Conservatives.

Looking Ahead to 2023

There are already two by-elections in the pipeline for the new year, with the unfortunate passing of councillors in Aberdeen and Stirling. There’s possibly also one in the offing in Edinburgh, but at this point it’s unclear as to whether the SNP councillor who has resigned has simply done so from his party, or from the council as a whole. Later this week – just before Christmas! – you can also expect the usual Parliamentary and Constitutional review pieces. I’m expecting at least one more poll to drop, so have to wait for that before I can pull those last bits together.

If you find this or other Ballot Box Scotland output useful and/or interesting, and you can afford to do so, please consider donating to support my work. I love doing this, but it’s a one-man project and takes a lot of time and effort. All donations, no matter how small, are greatly appreciated and extremely helpful.
(About Donations)