Rounding out the year we’ve got one final poll from our most regular and reliable source, Savanta (tables not yet published) and the Scotsman (link to original writeup). Note that just like how Ipsos recently jettisoned their MORI, Savanta have bid farewell to their ComRes, rebranding purely with the first half of the name. At least, I’m hoping this poll rounds out the year. Anyone who publishes polling any later in the year than this should, frankly, be jailed for life…
The previous Savanta covered the 30th of September to 4th of October. Changes are shown as (vs that poll / vs last election).
Regional Vote
As we’ve had three different polls since the Supreme Court judgement, we’re again able to see significant differences between them. To a certain degree, Savanta are proving to be the Anti-Ipsos, most clearly for the SNP on this vote. Although unchanged since their last poll, this represents the loss of about a fifth of the SNP’s vote since May 2021. This is a unique finding amongst our “regular” pollsters, though less frequent pollsters Survation and BMG have found similar. They went out on this limb ahead of the 2021 election too, and were notably far off the actual outcome.
If the SNP are much lower than with other pollsters, others have to be much higher. They may have lost another point since the last poll, but here that’s most obviously the Conservatives. YouGov gave them a term-thus-far low, which means they are running much higher than their average in this poll. So too are the Lib Dems, with a joint-best figure for the term, which had previously also come from Savanta.
That leaves Labour and the Greens as the two parties that are in line with other pollsters. Labour are down a touch since the last poll, but still a significant recovery since the election and in line with YouGov. The Greens meanwhile continue to record some of their strongest ever polling, which aligns with Ipsos. You may also note that Alba aren’t present. I had wondered if they would be present in the tables, but I’ve been told Savanta aren’t even bothering to prompt for them anymore, given how miniscule their shares had been.
Constituency Vote
It’s a similar story over on the constituency vote, at least in terms of comparisons with Ipsos and YouGov, with a much lower figure for the SNP. It’s still comfortably ahead of their opponents, and at least in this case it’s also not far off what Panelbase often find, so it looks less of an outlier.
Again that means the Conservatives are a fair bit stronger than with everyone else, though the Lib Dems don’t replicate their strong list showing here. Labour meanwhile are on what is a very good figure for them, but not quite a term record.
Seat Projection
Projecting that into seats might give us something like this:
Please see this page for how projections work and important caveats.
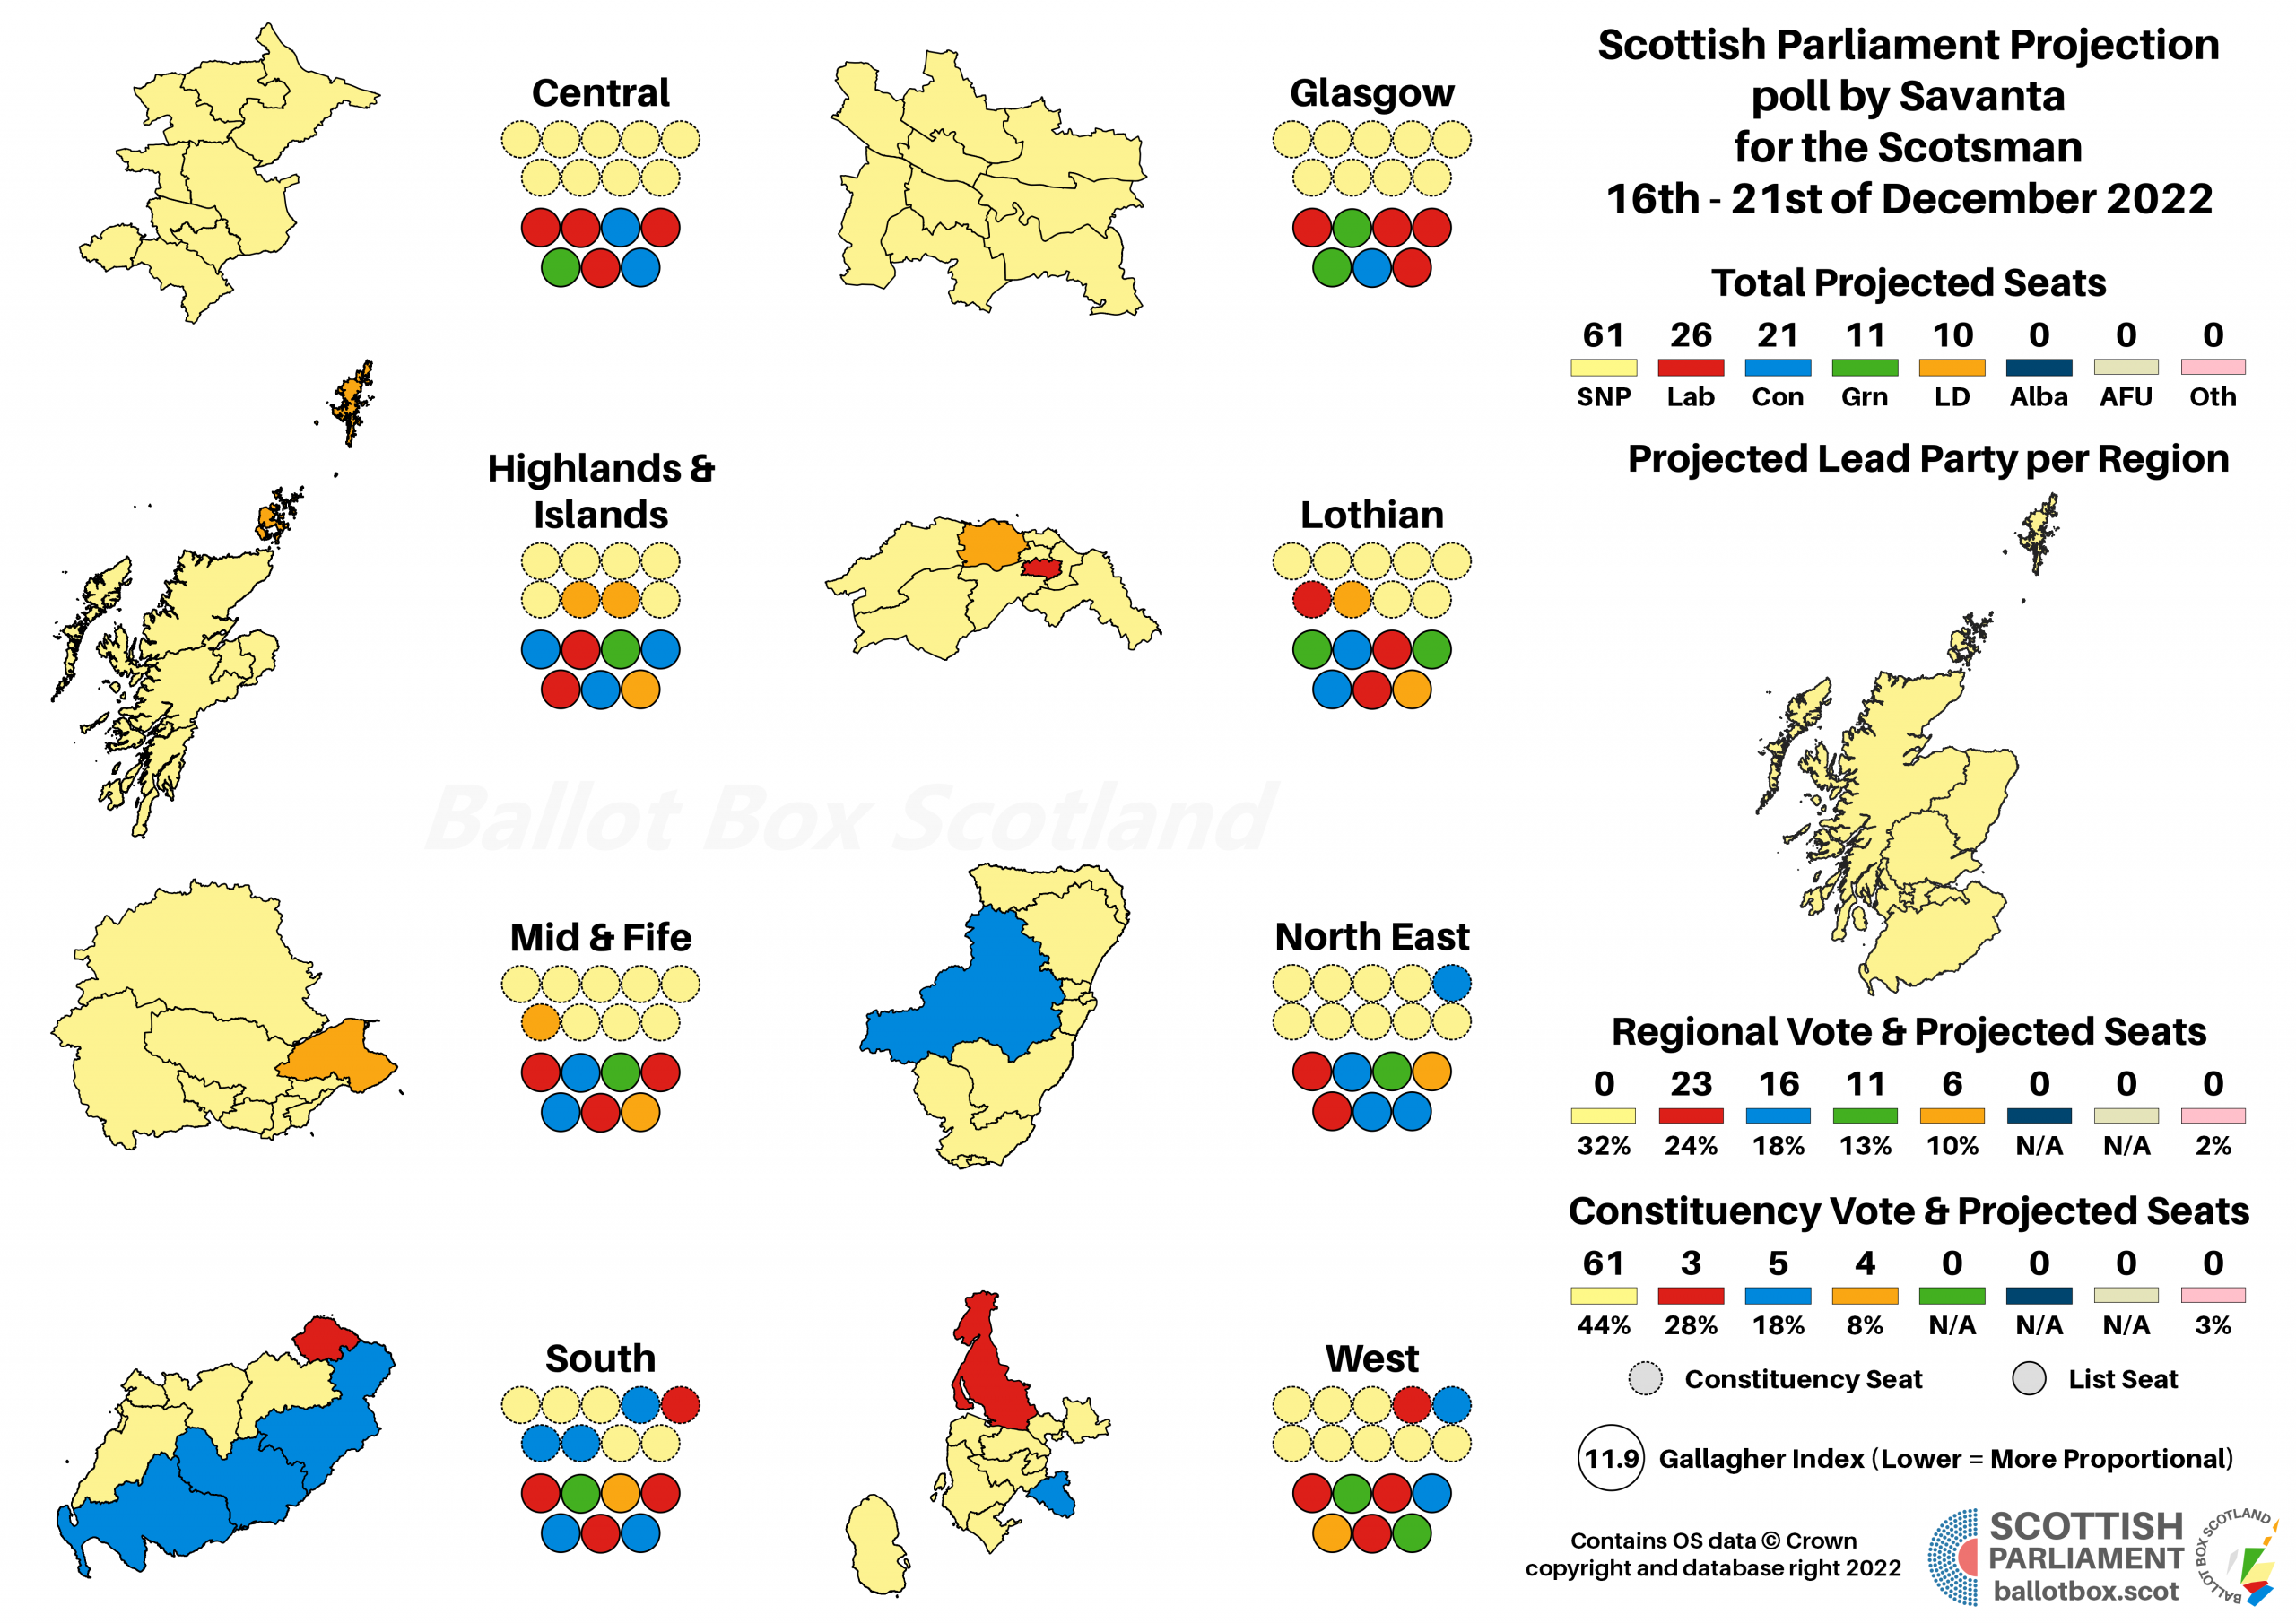

Naturally, a better Conservative performance than with everyone else also means their projected seat share is higher, “only” losing a third rather than half of their tally. Similarly, the Lib Dems would more than double their share for a joint best seat projection so far. Although the SNP lose a handful of seats, the net total for their co-operative government with the Greens would be unchanged. Notably, despite strong vote shares, both Labour and the Greens have slightly lower seat hauls than in some other equivalent polls, because the Conservatives and Lib Dems have left less space for them to gain in this poll.
No surprises then that the patterns identified above largely continue into the Westminster figures. There’s a much better Conservative number than with anyone else, though a comparatively weak SNP figure here agrees with YouGov. Combined with nothing for the un-prompted Greens, would leave the SNP far adrift of the vote majority for any “de facto referendum” plan.
Somewhat interestingly, we can see Labour and the Lib Dems moving in opposite directions across these questions. Labour are weakest on the Holyrood list bit, stronger on the Constituency, and at their best for Westminster, but the Lib Dems go in the opposite direction. There’s actually a degree to which that suits both parties just fine. It’s growth for both at Holyrood regardless, and Labour need to get a bit closer than they are to the SNP here to convert Westminster seats, whilst the Lib Dems can probably rely on holding at least 3 even with this vote share, given their pile ’em high approach to holding key seats.
Just like Ipsos, Savanta did also ask a specific “if the SNP treated a UK General Election as a ‘de facto referendum’, how would you vote?” question:
The answer, just as it was with Ipsos, is “exactly the same” – or near enough. There’s an extra point for the Conservatives at the SNP’s expense, but as I said with Ipsos, that’ll just be statistical noise rather than anything meaningful. Either way, again notably short of the 50%+ figure.
Wrapping up the whole “anti-Ipsos” vibe, Savanta have ended up being the only pollster since the Supreme Court to find a lead for No. In fact, there’s actually a tiny (albeit statistically immaterial) decrease for Yes! As I said with Ipsos, just because something looks like an outlier doesn’t mean it’s wrong, so I wouldn’t dismiss this one out of hand.
However, it is clearly against recent trend, and we’ll need more than a single poll before we can say if there’s been any turning of the tide back to the pre-decision status quo of narrow leads for the Union. As I’ve said a couple of times now I wouldn’t be surprised if we did get to that point, as I think opinion on the constitution will only substantially change if there’s some form of substantive debate on the topic itself rather than procedural wrangling, but we’ll need to wait a bit longer to see if that feeling is justified.
Timing of a Referendum
Data on the usual timing questions hasn’t yet been published. I expect given past experience it will be at some point in the coming days, at which point I’ll come back and add it in. However, it’s not enough of a gap not to publish the analysis piece, given my desire to also get my usual annual reviews completed before Christmas!
Hypotheticals
As ever, the last little bit of analysis concerns those hypothetical and more proportional voting systems that I have a bee in my bonnet about here at BBS. The fact Westminster uses pure FPTP is an affront to democracy, and though Holyrood fares far better, AMS is still deeply imperfect. The examples here simply transpose the poll findings onto more proportional voting systems – the reality is that different systems would of course result in different voter behaviour.
For the moment, although the maps are useful for illustrative purposes, I’m opting just to show these hypotheticals as charts. It’s very time consuming making maps, and for these pure hypotheticals, it’s possibly a bit overkill.
Starting with changes to AMS, it’s the common case of how proportionality can only go so far when there’s an FPTP element, giving the SNP a 2:1 advantage over Labour, albeit short of a majority. Add in the Greens though and it’s still comfortable overall for the present government.
However, it’s very different when you drive seats purely and entirely by the list vote. Since the SNP are so weak on that front with Savanta, they end up with far fewer seats, and even with Greens in the mix the balance splits 69:60 in favour of the Pro-Union parties.
Scandinavian Style Westminster
Finally, a proportionally elected Westminster contingent does the usual job of unpicking the SNP’s over-representation at present, likewise giving a Pro-Union party majority. Relatively to the last poll, the Conservatives do make some progress in this model, picking up a seat apiece from the SNP and Lib Dems.
If you find this or other Ballot Box Scotland output useful and/or interesting, and you can afford to do so, please consider donating to support my work. I love doing this, but it’s a one-man project and takes a lot of time and effort. All donations, no matter how small, are greatly appreciated and extremely helpful.
(About Donations)