After something of a lull for the (BBS tracked) pollsters for the past few weeks, the relatively infrequent partnership between STV News (link to original writeup) and Ipsos (link to tables) has scratched the polling itch. As it’s been quite some time since we heard from Ipsos, they add a smidge of diversity to recent polling averages. Now, if we could get a Survation in the next couple of weeks, we’d complete the list of regulars having polled in Q4, which would be lovely for my annual review…
The previous Ipsos covered the 15th – 21st of May 2023. Changes are shown as (vs that poll / vs last election).
Regional Vote
Despite the length of time since the last poll, almost everything here is within margin of error. The SNP’s share is continuing to slide, though as is common with Ipsos it’s a bit higher than other pollsters have found lately. Given we know that’s the case, what matters a bit more here is the trend, and like everyone else that’s downward. Interestingly Labour are down a bit as well, though still remaining significantly higher than their share at the last election.
The poll makes for poor reading for the Conservatives, dropping a couple of points, and overall emerging as the worst poll for them this side of summer. The Greens too are down, and given that Ipsos have typically been on the higher end of their polling could suggest the ongoing difficulties facing the Scottish Government, of which they are now of course part, could be impacting them too.
The one thing that’s just outside margin of error, when accounting for that margin reducing the closer you get to 0%, is the Lib Dem increase. The previous Ipsos had been a joint worst of the term for them on this vote, no better than their 2021 performance, so they’ll be pleased to see a bounce back to roughly their average here. Finally, as we’re seeing with everyone, SNP troubles simply are not translating to any gains whatsoever for Alba who continue to languish on an absolutely nothing vote share.
Constituency Vote
Some similarities over on the constituency side of things, with the SNP, Labour and Conservatives all down on the last poll, most sharply for the SNP. Oddly some of that here does seem to go Alba’s way, as they actually come out better than their regional share. That’s largely a rounding artefact however, as there’s a difference of only one respondent between the two, amounting to 2.42% for the regional and 2.56% for the constituency vote. The Lib Dems are also up here, though not as notably as on the regional level.
Seat Projection
Projecting that into seats might give us something like this:
Please see this page for how projections work and important caveats.
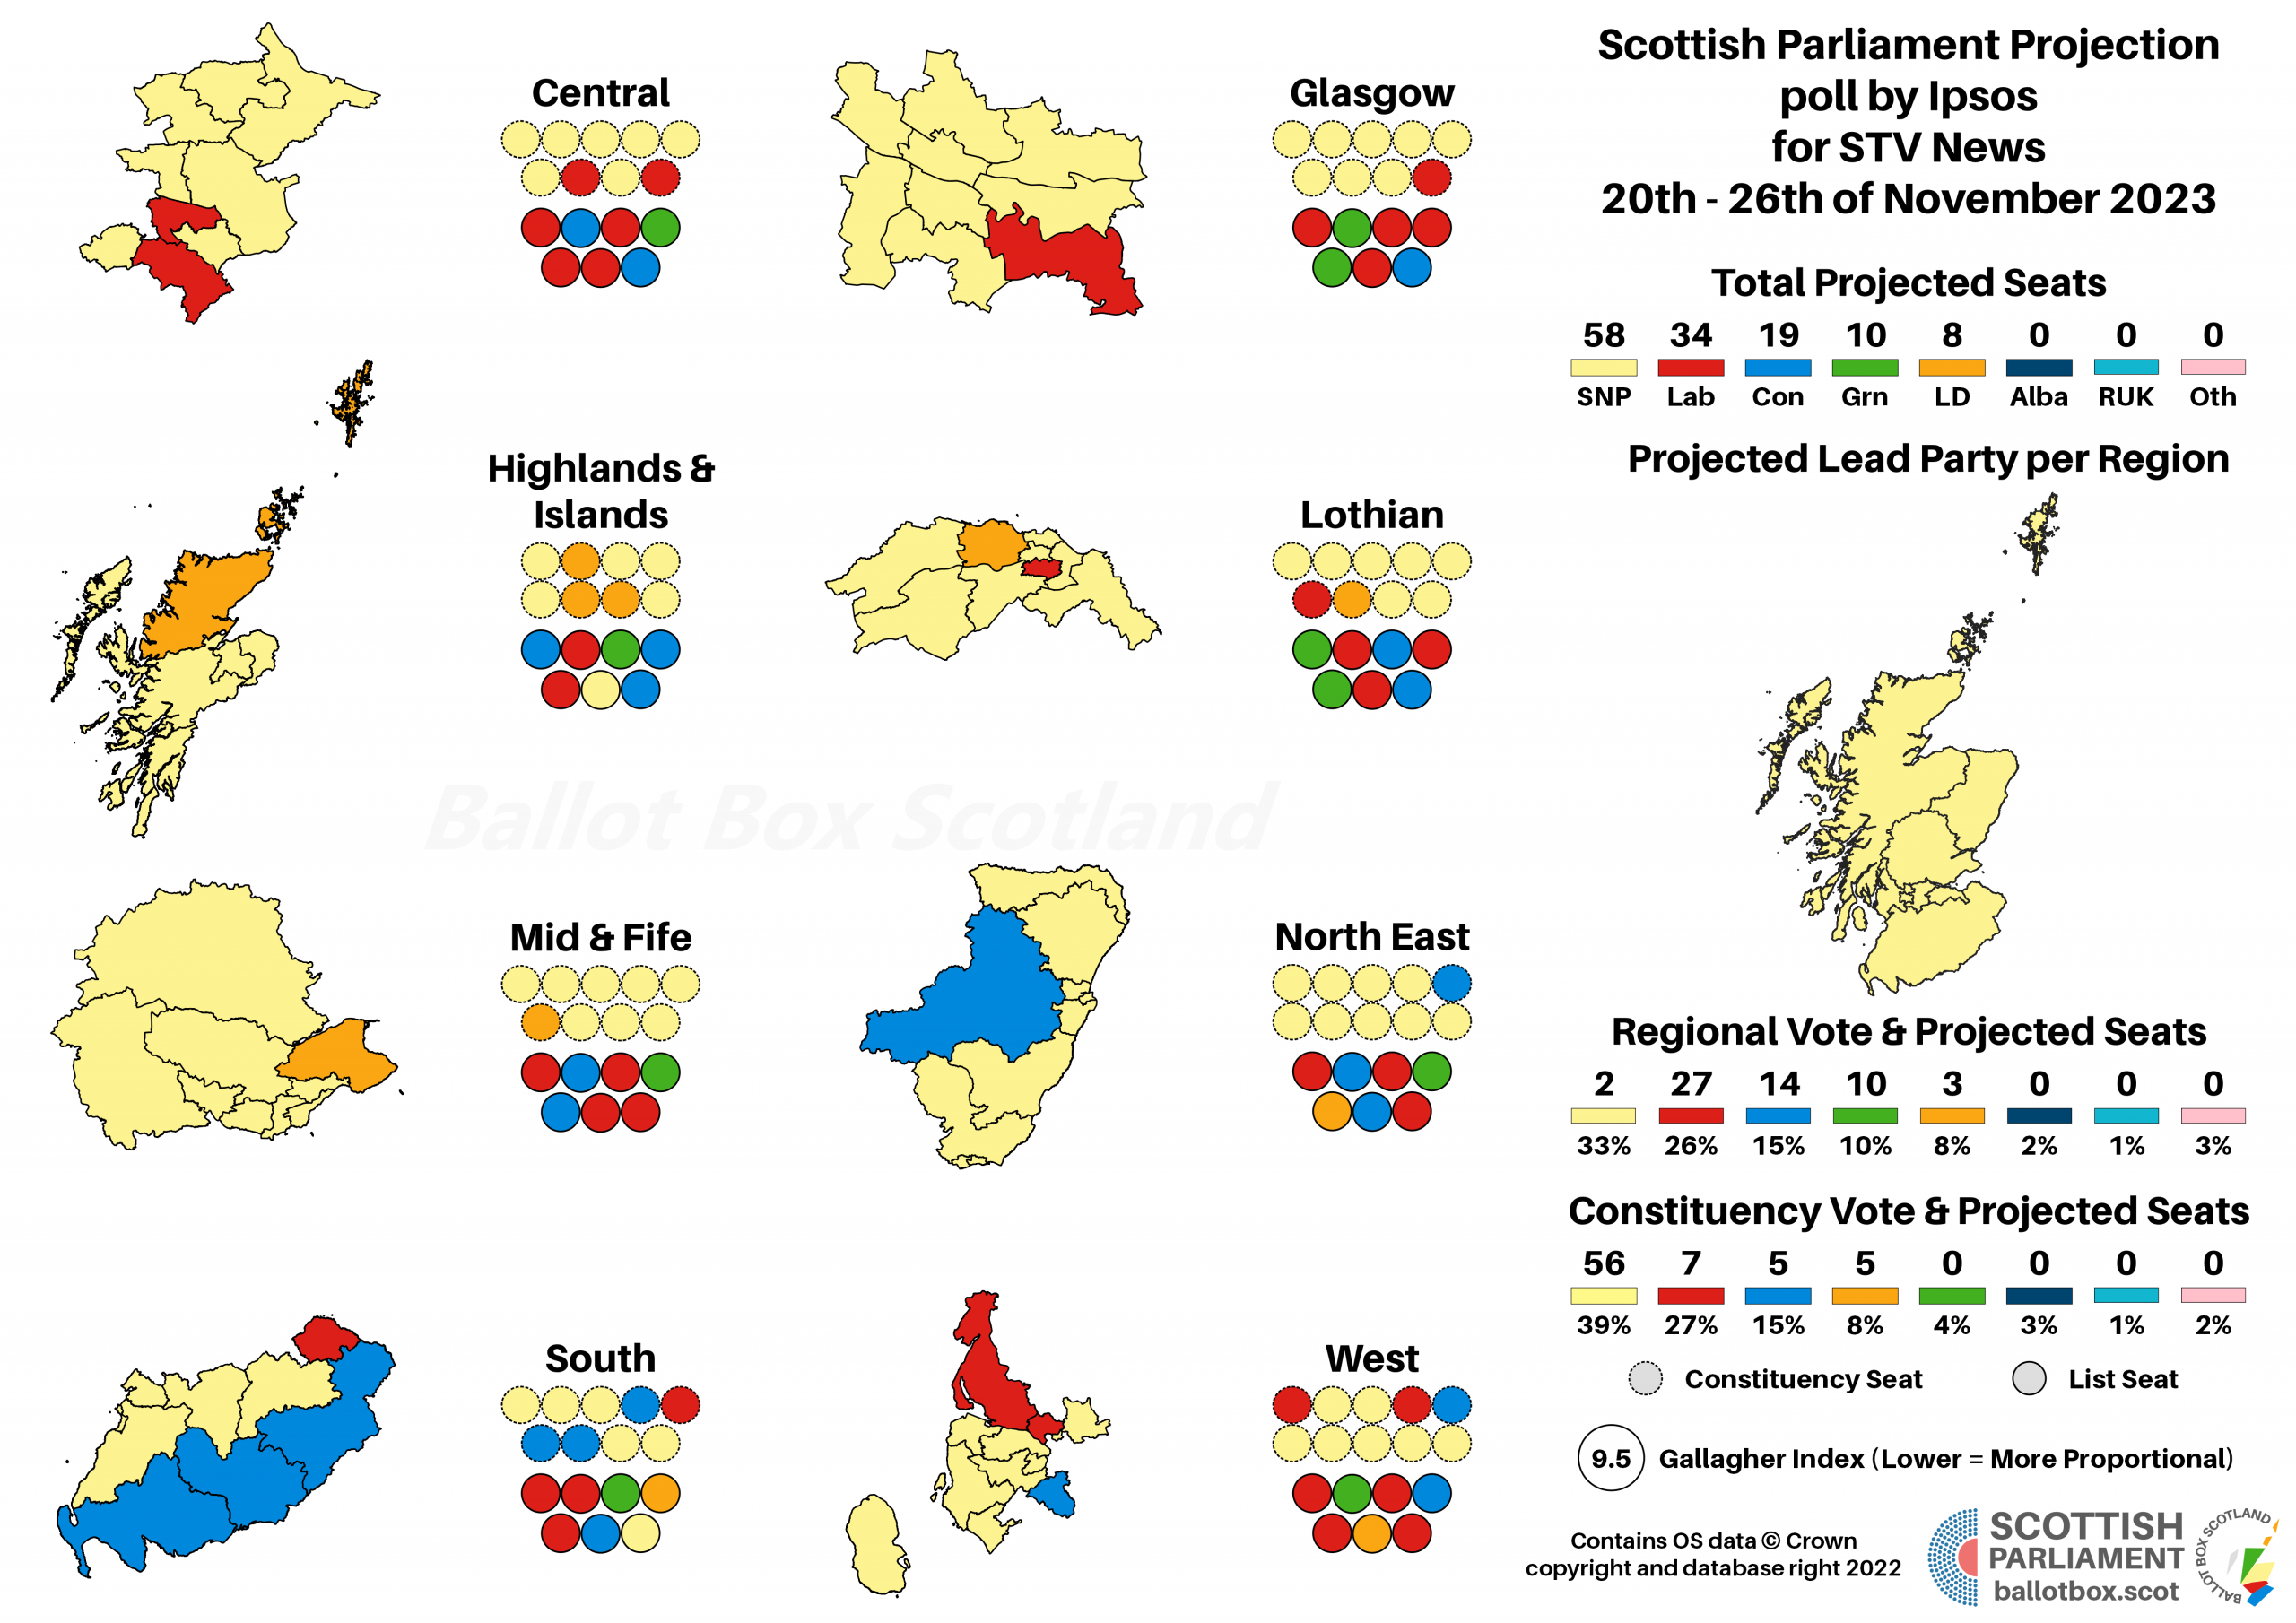

Even allowing for the fact that we know Ipsos find stronger SNP figures than other pollsters, I had wondered whether their next poll might be the first to show the current SNP-Green government projected to lose office. That hasn’t proven the case, as the SNP’s continued strong constituency lead in particular helps insulate the government majority. Naturally, that means this map is quite starkly different and a lot yellower than other recent polls have spat out.
The party that’ll probably be happiest with this one relative to the last poll isn’t then going to be Labour, but the Lib Dems. The previous poll had been the one and only poll so far this term that didn’t give them any more seats than they won in 2021, but here they would double their numbers.
This is one of the two standout bits of this poll, because we’re all expecting the Westminster election next year and everyone else has had a very close contest between the SNP and Labour. In line with Ipsos tendencies though, despite 1% dropping from the SNP and Labour gaining the same, there’s still a quite mighty 10% gap.
That’s the point after which Labour do begin to pick up lots more seats, but remember that in 2017 the SNP-Labour gap was about 10% and that only did 7 seats for Labour. It might do them slightly more in this scenario, but it’d still be a huge SNP majority, especially given the dire figure for the Conservatives.
Last but not least on the voting intention, dramatic Independence figures. Much like the SNP, Ipsos have a known and marked habit of finding better results for Independence than other pollsters. Movement here is entirely margin of error so I certainly wouldn’t read anything into the fact the No figure is slightly lower than the last poll here – this is near enough a no-change poll, albeit one with the opposite constitutional balance to other pollsters. On this especially I do tend to view Ipsos as an outlier, but crucially it’s a consistent outlier, and we can all account for that when we look at figures like this.
Again, what might be useful here is comparing trend rather than the direct voting figures. If we look at the most recent ordinary-series poll which was from Savanta, even the Don’t Know inclusive figure for Yes was running at 4% ahead of the combined total for the Pro-Independence parties on the Holyrood list vote. It’s a similar story here, with about a 6% advantage for Yes over the parties backing it.
In that sense, Ipsos are telling us something similar to other polls – the drop in support for the SNP and other parties that back Independence isn’t being fully matched by a drop in support for Independence. Whether that position can hold for the long term, or whether that eventually begins to erode support for Independence, we can’t say with any certainty right now.
Hypotheticals
As ever, the last little bit of analysis concerns those hypothetical and more proportional voting systems that BBS likes to play about with. The use of pure FPTP at Westminster is an affront to democracy, and though Holyrood fares far better, AMS is still deeply imperfect. The examples here simply transpose the poll findings onto more proportional voting systems – the reality is that different systems would of course result in different voter behaviour.
These days I often let this hypothetical section pass without additional commentary as it’s more for fun than serious, but this is a poll where it’s useful for brief specific comment. Note that a more proportional version of AMS would have the SNP and Greens come up short of a majority – just – at 72 to 73 seats for their Pro-Union counterparts. The SNP are overhanging significantly in the standard AMS model, giving them much more than their fair share of seatrs.
We can see that even more clearly in this almost maximally proportional system, where despite the Greens benefitting to the tune of 4 seats versus AMS, the SNP are down 12 and therefore the government places well short of a majority at 60 seats to the 69 for the opposition.
Scandinavian Style Westminster
Note that this is the first Ipsos since the final Westminster boundary changes were submitted, so the figures here sum up to 57 rather than 59. I’ve therefore recalculated both the previous poll and the 2019 result to match 57 seats.
If you find this or other Ballot Box Scotland output useful and/or interesting, and you can afford to do so, please consider donating to support my work. I love doing this, but it’s a one-man project and takes a lot of time and effort. All donations, no matter how small, are greatly appreciated and extremely helpful.
(About Donations)