I’m currently playing a little bit of catch-up on Ballot Box Scotland, having had a few days on holiday in Northern Ireland. Late on the night before I was getting the ferry over, this poll from Survation (link to tables) was… partly published. Conducted on behalf of the Diffley Partnership and Charlotte Street Partners, it seems to have been initially given to the Sunday Times as an exclusive.
Unfortunately, as I have written before, the Sunday Times’ reporting of polling is an absolute joke. There has been a consistent pattern of not reporting the Holyrood voting intention figures in their coverage. This issue isn’t shared with their daily equivalent, by the way, so for whatever reason it’s Sunday specific – a rare instance of where the snarky “you fool, that’s a different paper!” about Sunday editions actually holds significant water! That’s what happened this time, where the initial coverage included only Westminster intention and Holyrood seats – but no votes, and no Independence figures either.
It’s not simply frustrating to keep encountering this as a polling and elections project that wants the data. As Mark McGeoghegan, who has more in-depth and direct experience of polling than myself, points out in this Twitter thread, it actually has implications in terms of transparent and accurate reporting. In this case, the paper had also published articles suggesting polling was showing the leadership election was damaging the SNP. That’s a perfectly fair and reasonable assertion to make in the current moment – but they didn’t provide the data to back it up, despite the fact they had it to hand! That’s just shoddy and embarrassing.
Frankly, if this had been a purely Sunday Times commissioned poll I would have extended my ongoing non-coverage policy to it. Since it turns out to have been commissioned by others and merely reported by the Sunday Times, I am letting it slide – this time. If in future polling is given exclusively to the Sunday Times, and they again fail to report the core, basic figures, I will simply omit the poll from my detailed reporting and coverage – though, of course, I will include the data in relevant trackers!
The previous Survation covered the 15th – 17th of February 2023. Changes are shown as (vs that poll / vs last election). Note that didn’t seem to include Independence intention, and therefore changes there are versus 1st – 7th of February 2023.
Regional Vote
Broadly speaking this is a classic example of an “all within margins of error” poll, but within that it does show a continued downtick in the SNP vote, albeit not quite as severe as a couple of other recent polls. Labour remain on what is a term-high for them, whilst the Conservatives nudge upwards to what would still be the loss of a fair chunk of their vote relative to 2021. The Greens and Lib Dems tie in votes here, though that’s static for the former and a gain for the latter since the election. That means Survation have now in two polls clearly swung into being a lowball pollster for Greens, having previously been highball.
Constituency Vote
It’s an almost identical story over on the constituency vote, though notably Diffley et all seem to have insisted on Green and Alba inclusion on this question – when I’d asked Survation to include Greens on constituency in my poll last year I got telt “no”, basically! Anyway, as has tended to be the case lately, the SNP’s lead on this one is much chunkier than it is on the list, though still down significantly since May 2021.
Seat Projection
Projecting that into seats might give us something like this:
Please see this page for how projections work and important caveats.
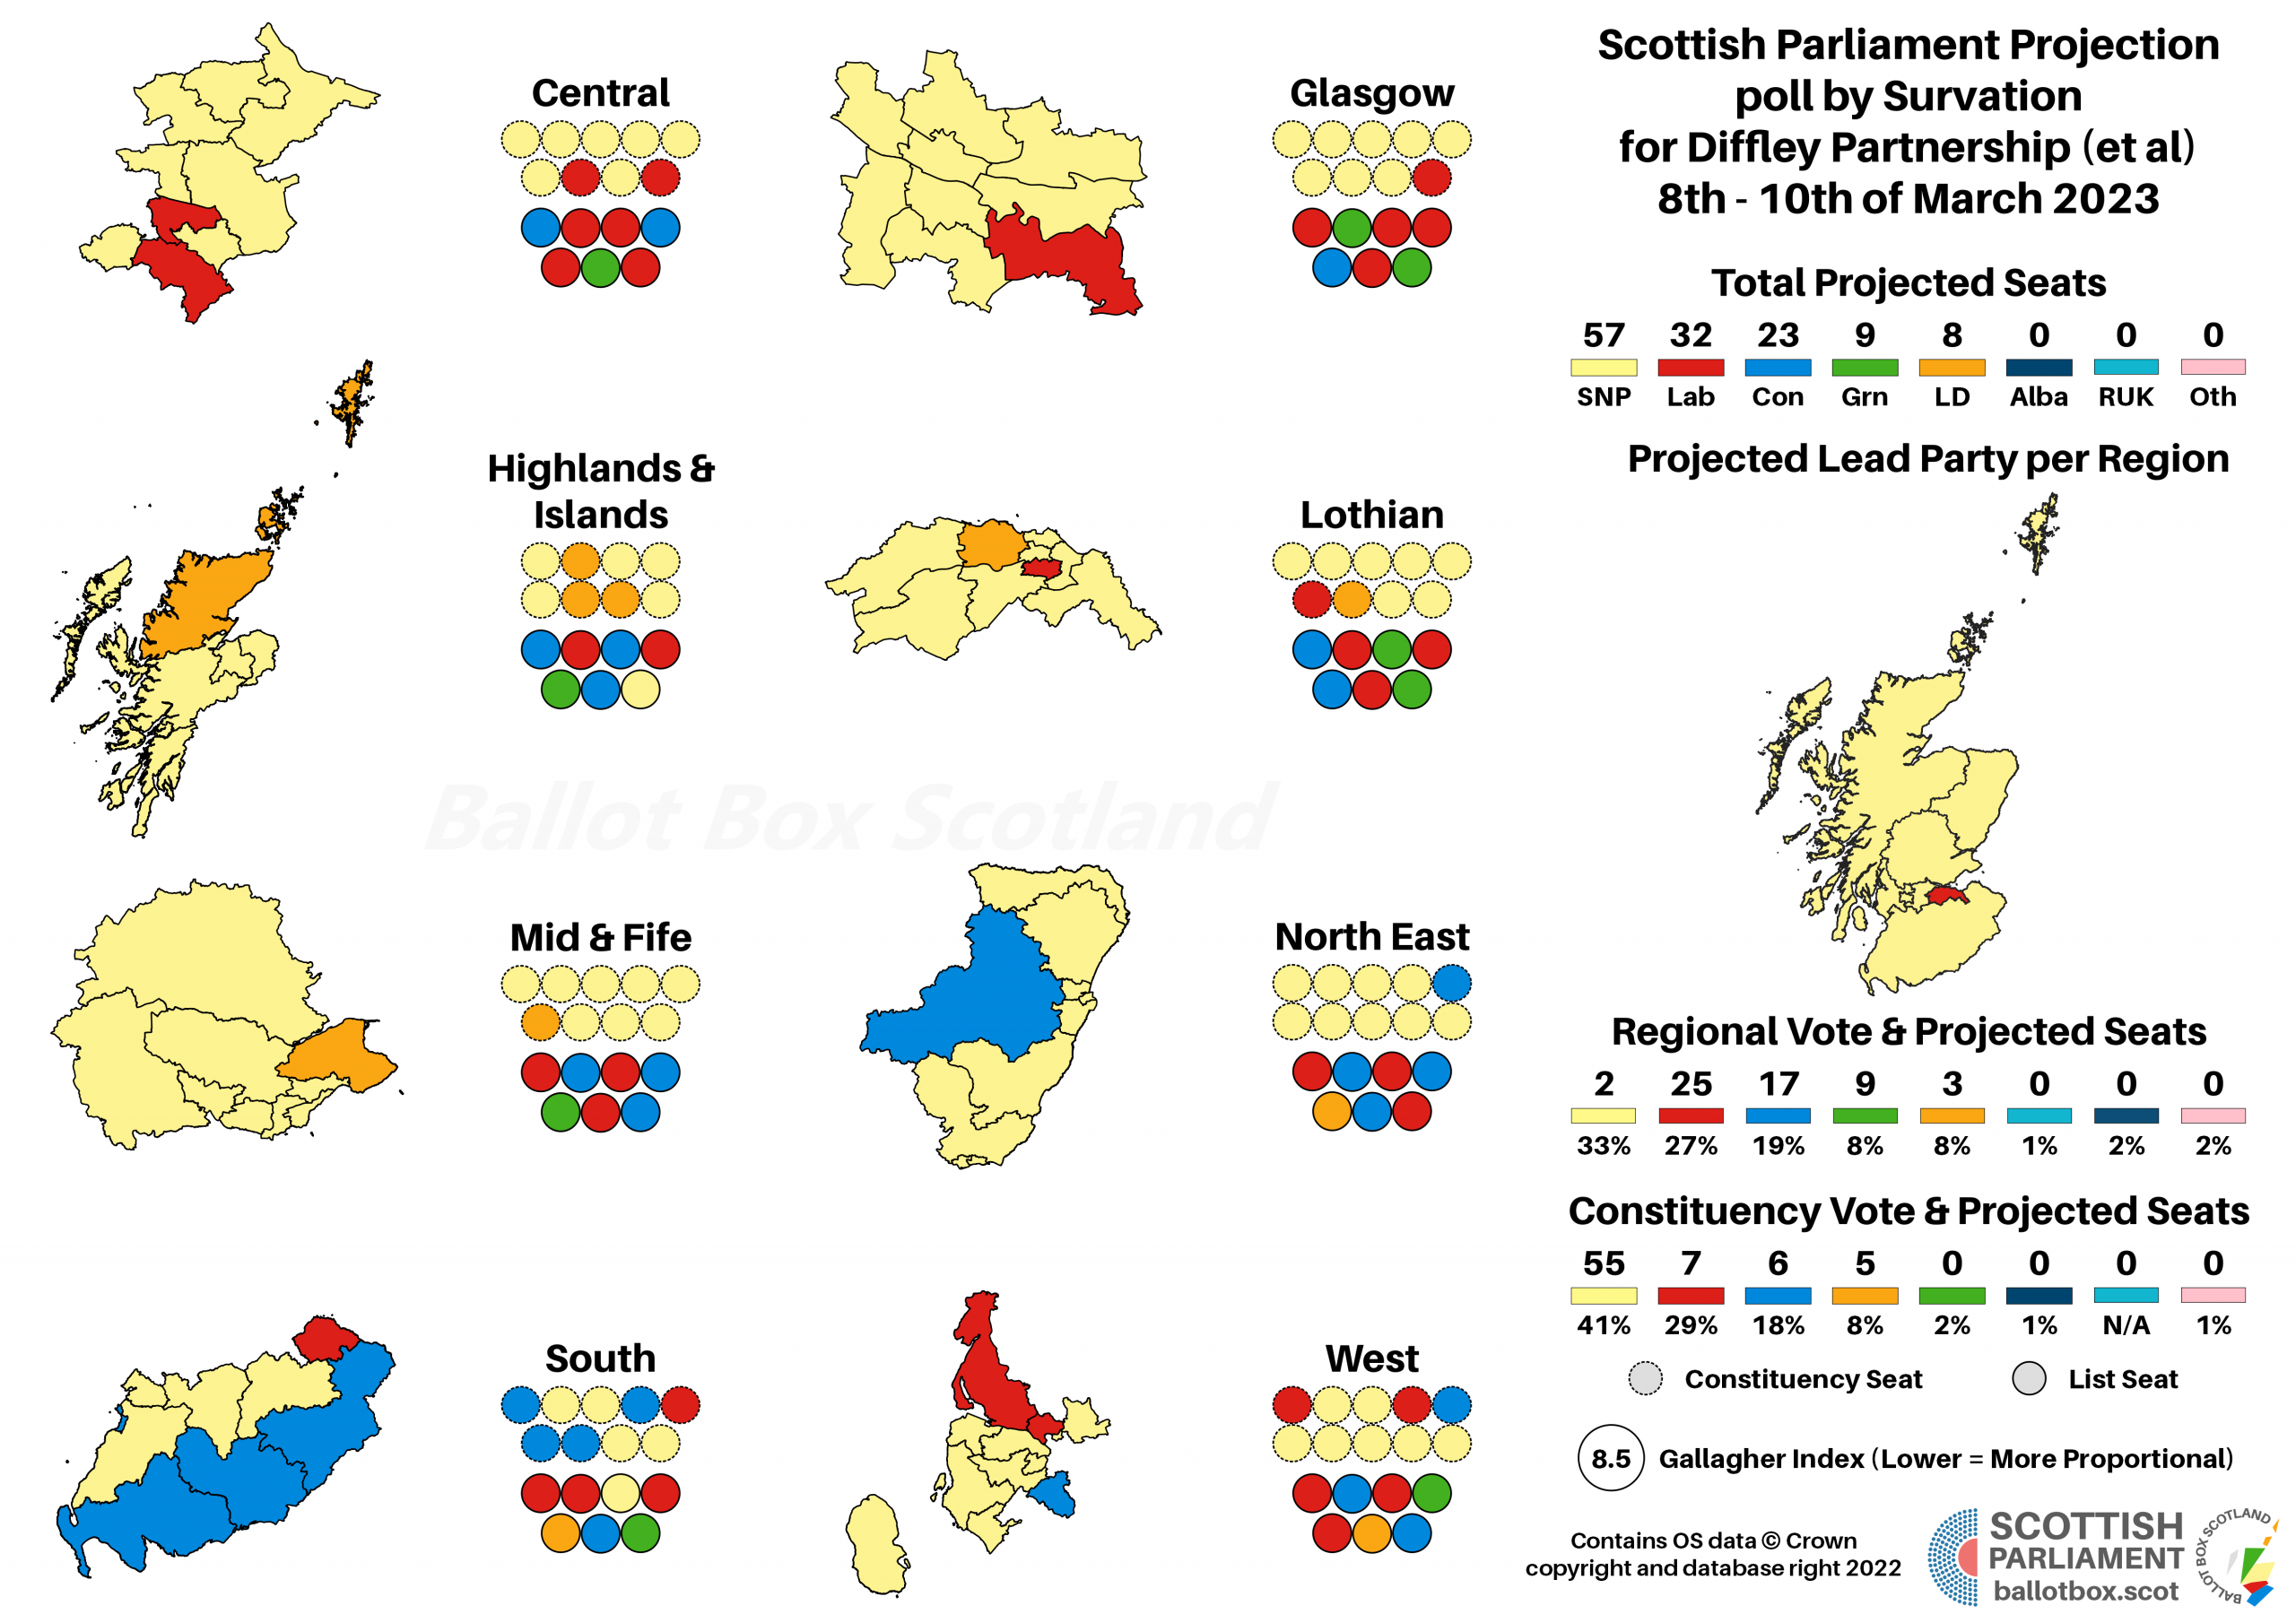

This continues the recent trend of Labour making some constituency headway, which helps to shake off some of the effects of overhang. The projection here is a very narrow 66 seat majority for the co-operative SNP-Green government, which is the second lowest projection for them so far this term – the only one that’s been lower was a clear loss of majority.
Incidentally, this projection illustrates why it’s important to be provided with vote share figures as well as the seat projection – because different models give different results! In this case, the projection for the Sunday Times had 10 Green seats and 56 SNP, whereas my model says 9 Green and 57 SNP. That’s not a big difference overall, but differences are useful reminders of how polling and projections aren’t exact sciences.
Over on the UK Parliament vote, and this is firmly in what I’ve been terming the SNP’s “danger zone”, with the gap between the SNP and Labour at 8%, a narrowing of 5% versus the last poll and 18% versus the 2019 election. This is definitely where I’d be expecting Labour to enter double figures in terms of seats won, though relatively weak Conservative and Lib Dem shares would probably see the SNP holding on to most of their more rural seats quite easily.
There’s a quite weighty swing over on the constitutional question, very much in the Union’s favour. After excluding Don’t Knows, this is the second poll of the Holyrood term to have the question snapped back to 2014 levels. I think we can safely move away from “too close to call” type analysis into “clear advantage to the Pro-Union side”, but as we know from 2014 itself, this is a level of support that keeps the issue high on the agenda.
Hypotheticals
As ever, the last little bit of analysis concerns those hypothetical and more proportional voting systems that BBS likes to play about with. The use of pure FPTP at Westminster is an affront to democracy, and though Holyrood fares far better, AMS is still deeply imperfect. The examples here simply transpose the poll findings onto more proportional voting systems – the reality is that different systems would of course result in different voter behaviour.
This continues what was established in the previous Survation, which is the combined SNP-Green figures are now weak enough that making AMS a bit more proportional is enough to tip the parliament into a majority for the Pro-Union parties.
That is obviously even more strongly seen when we apply a fully proportional model instead, with a comfortable 73 to 56 seat lead.
Scandinavian Style Westminster
Although in the “danger zone” in terms of their polling, under FPTP you’d nonetheless expect the SNP to maintain a clear lead in seats over Labour. Make it proportional, and the gap is very slim indeed, with just four seats between them in this model.
If you find this or other Ballot Box Scotland output useful and/or interesting, and you can afford to do so, please consider donating to support my work. I love doing this, but it’s a one-man project and takes a lot of time and effort. All donations, no matter how small, are greatly appreciated and extremely helpful.
(About Donations)